

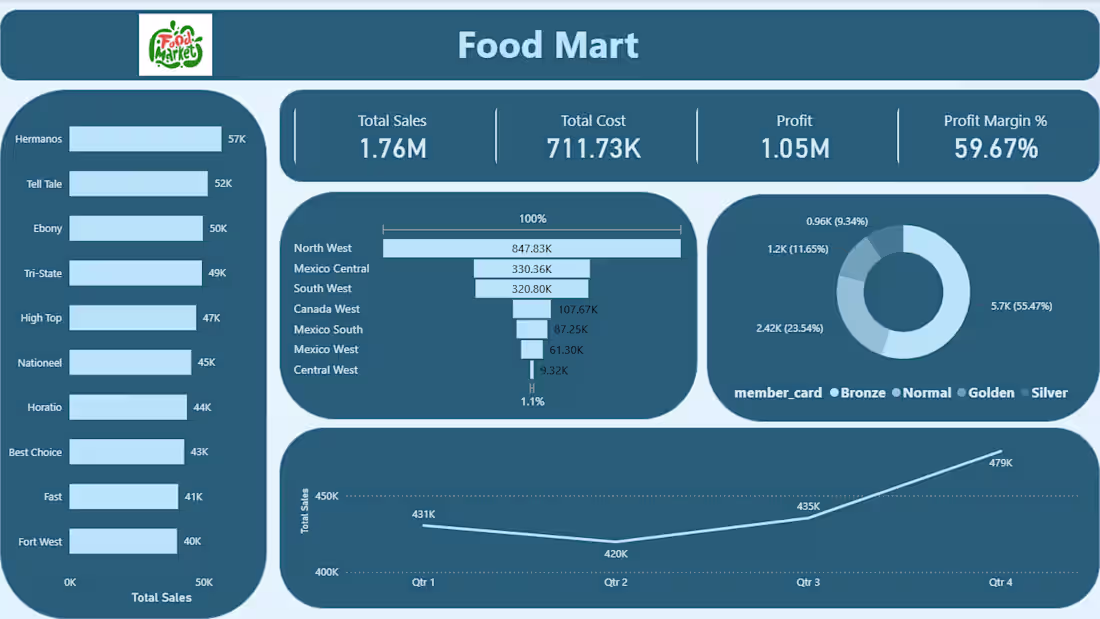
I design an interactive Food Mart dashboard to analyze sales performance, product categories, and customer purchasing behavior. The dashboard includes key metrics such as total revenue, top-selling products, branch performance, and monthly trends. It helps in identifying sales patterns, improving inventory management, and supporting data-driven business decisions through clear and visual insights.
1
17
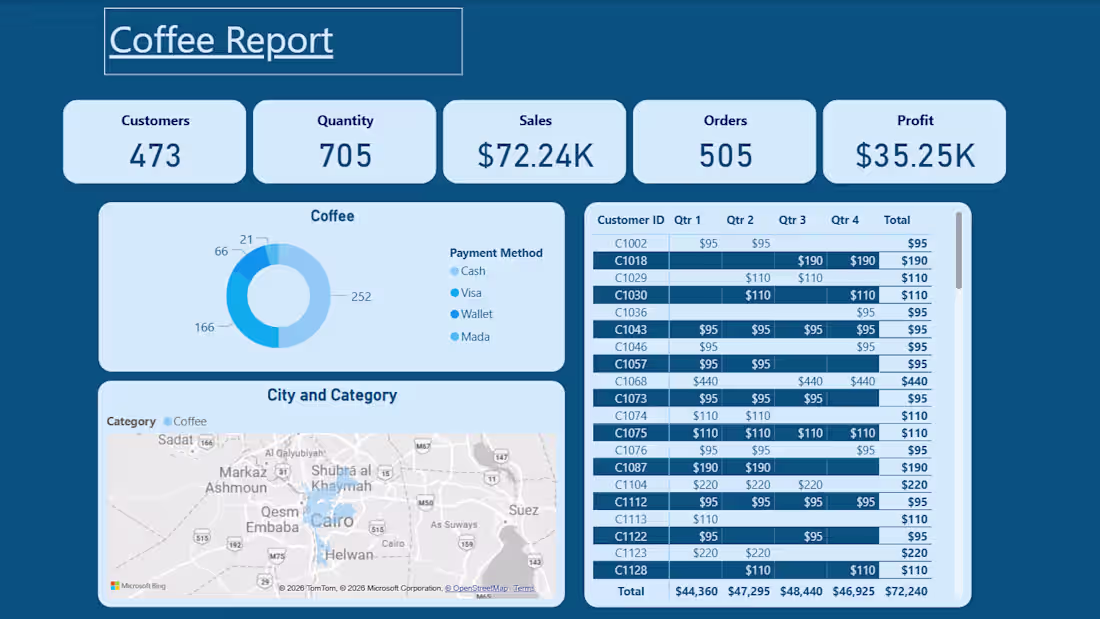
I create detailed coffee sales reports that analyze performance across products, locations, and time periods. The report includes key metrics such as total sales, top-selling coffee items, revenue trends, and customer preferences. I organize the data into clear visuals and summaries to help identify business opportunities, optimize inventory, and improve overall decision-making.
1
20
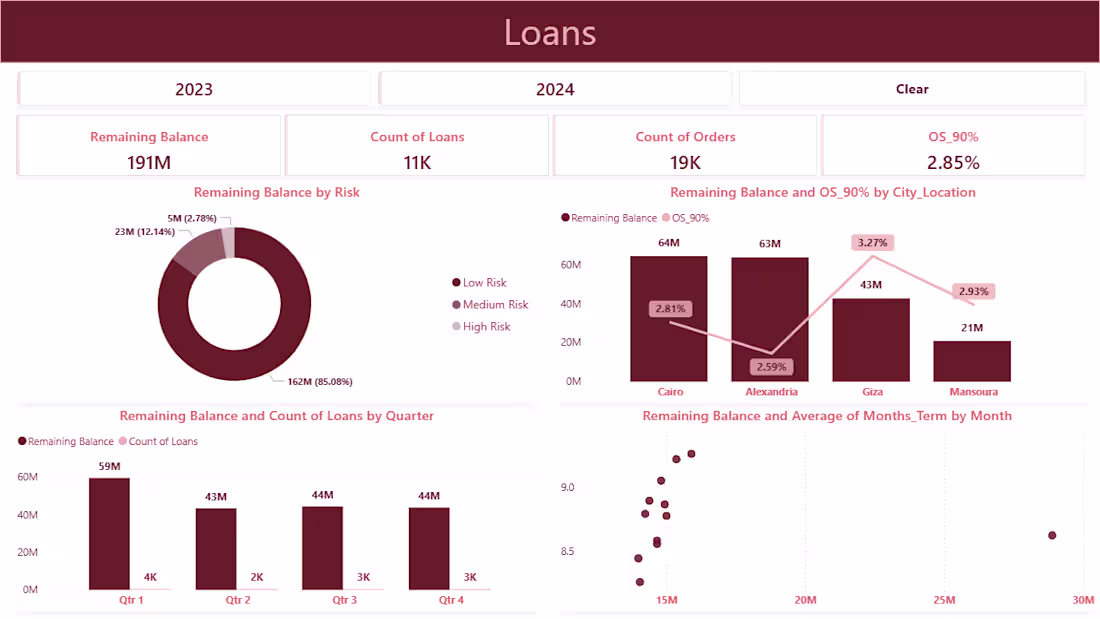
I analyze and manage loan data by organizing key financial details such as loan amounts, interest rates, repayment schedules, and customer information. I create clear reports and dashboards to track loan performance, monitor repayment status, and identify risks. This helps in improving financial decision-making, ensuring accurate reporting, and maintaining efficient loan portfolio management.
0
30
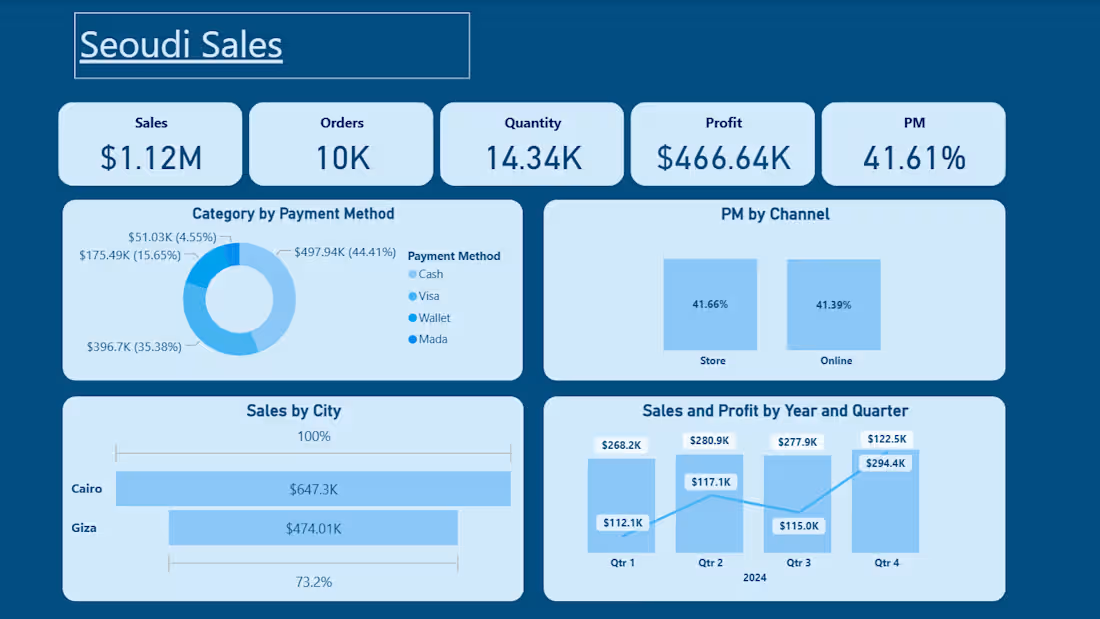
Developed an interactive Sales Dashboard for Seoudi, designed to track and analyze key sales performance indicators such as total revenue, product performance, branch comparison, and monthly trends. The dashboard provides clear visual insights to support data-driven decision-making, improve sales strategy, and monitor business growth effectively.
1
47