
8 months ago, I didn't know what a JOIN was.
Today, I just completed a full end-to-end analytics project on Samsung's Global Sales — 52 countries, 4 years, 15,500 transactions.
Here's what the journey looked like 👇
─────────────────────
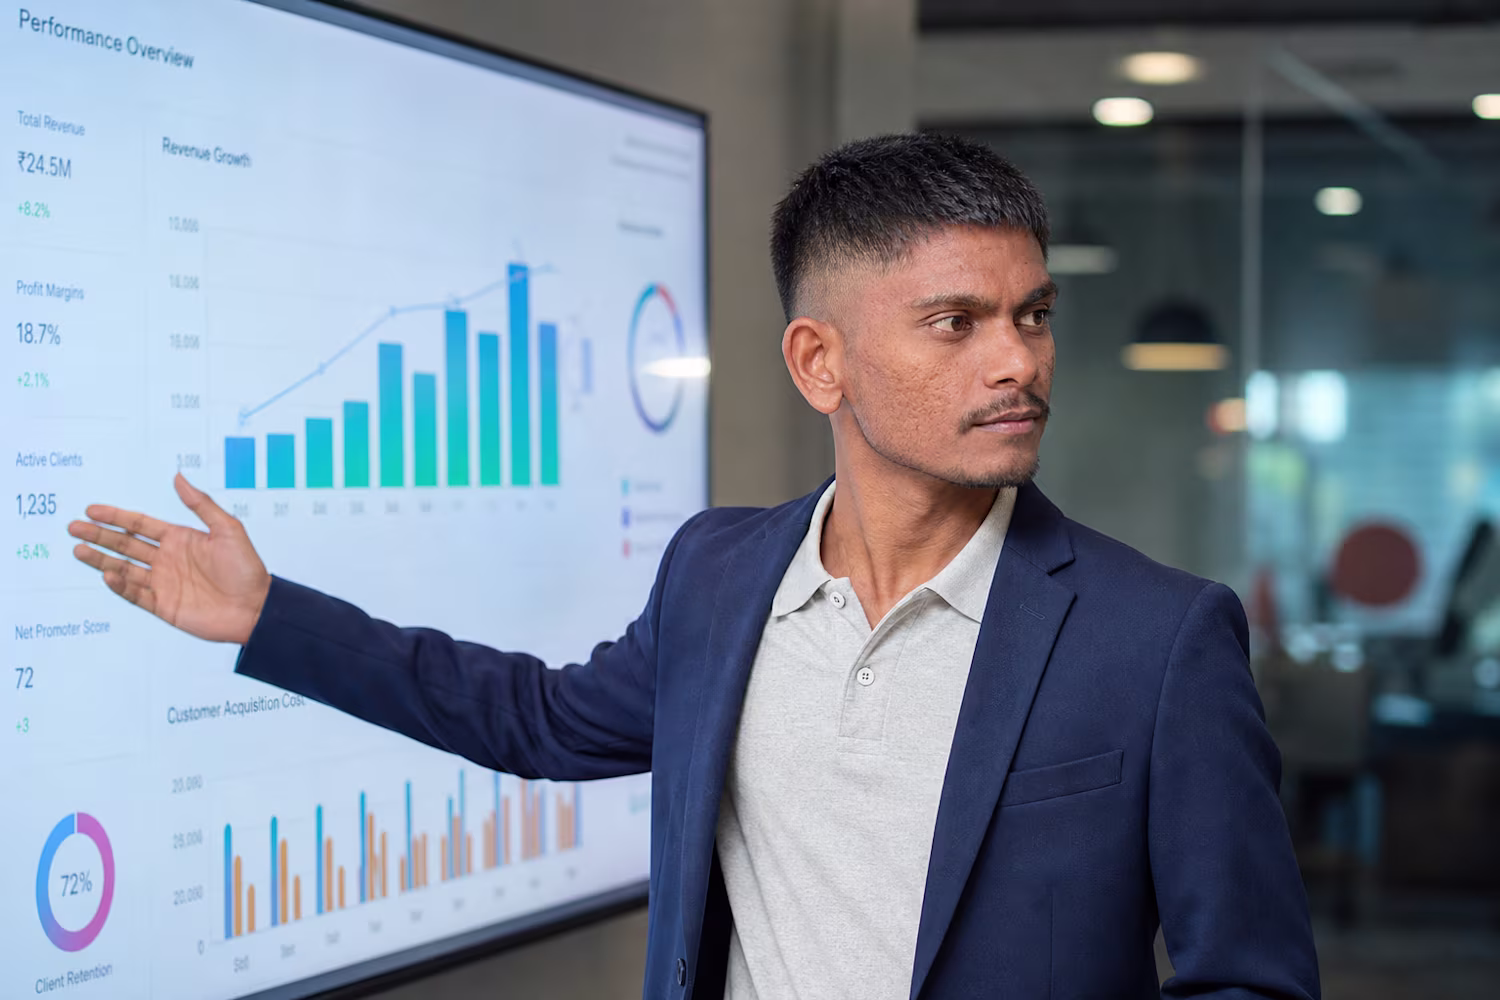
🔷 The Problem
─────────────────────
Raw data. 15,500 rows. 28 columns. No structure. No story.
Just numbers sitting in a CSV file — doing nothing.
My job? Turn it into decisions.
─────────────────────
🛢️ Step 1 — MySQL (The Foundation)
─────────────────────
I built the entire database from scratch.
Schema design → data import → indexes → validation.
Then I ran 7 analytical blocks to extract real insights:
→ Which category generates the most revenue? (Smart TV — $5.6M)
→ Which region dominates globally? (Europe — $7.9M)
→ Which product has the highest return rate? (Galaxy Z — 10.87%)
→ Does 5G actually command a price premium? (Yes — $130 higher avg price)
→ Who are the most valuable customers? (Government segment — $4.7M)
SQL didn't just query data. It told a story.
─────────────────────
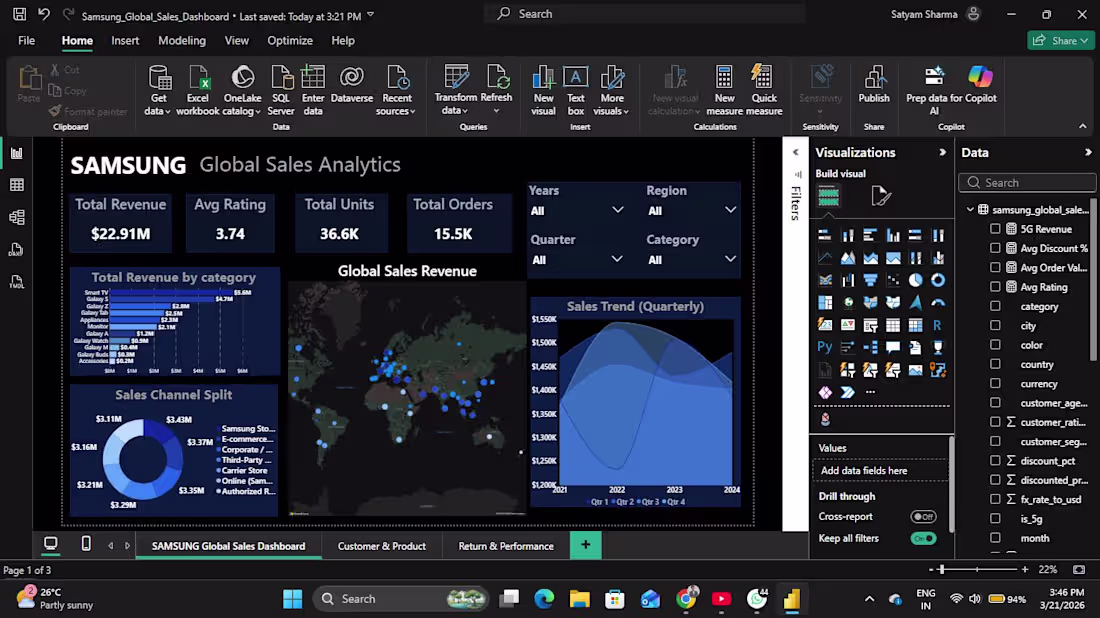
📊 Step 2 — Power BI (The Story)
─────────────────────
Dark theme. Samsung Blue hashtag#1428A0 (https://www.linkedin.com/search/results/all/?keywords=%231428a0&origin=HASH_TAG_FROM_FEED). 3 pages.
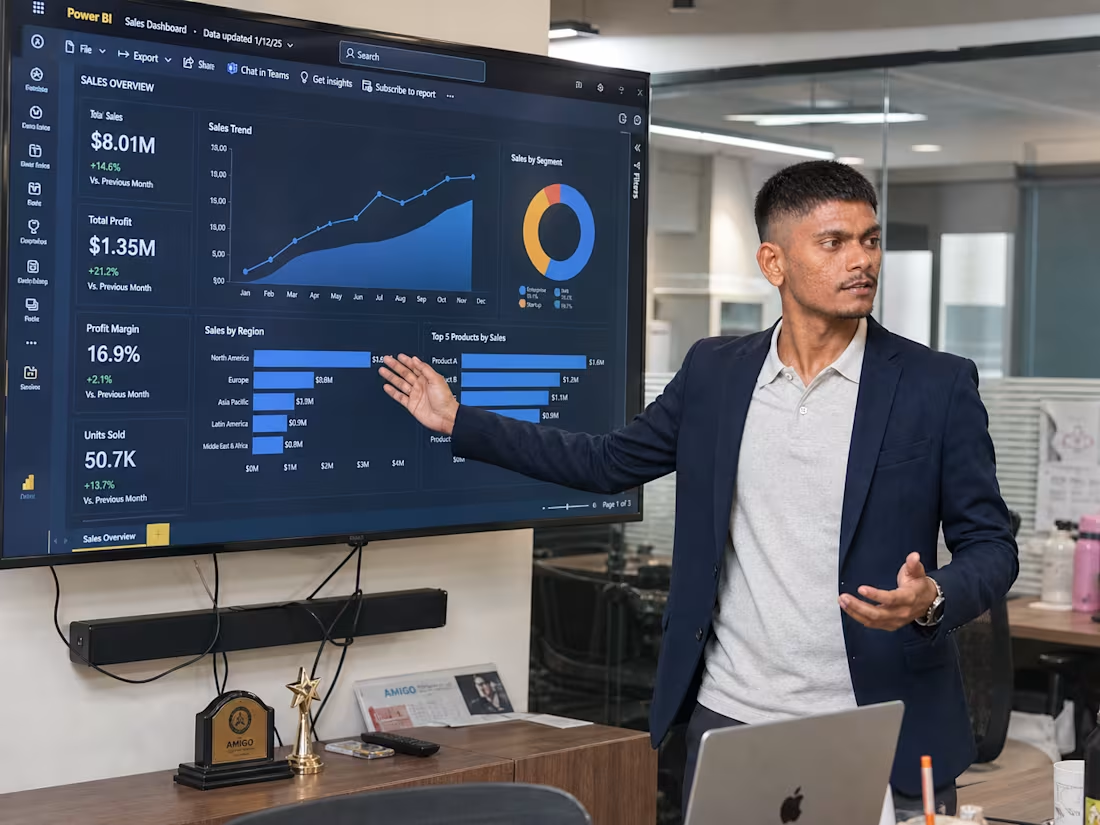
𝗣𝗮𝗴𝗲 𝟭 — Executive Overview
KPIs + Global Map + Quarterly Trend + Channel Split
𝗣𝗮𝗴𝗲 𝟮 — Customer & Product Analysis
Segments + Age Groups + Payment Methods + 5G vs Non-5G
𝗣𝗮𝗴𝗲 𝟯 — Return & Performance
Return rates + Region Matrix + Revenue Impact
One dashboard. Every answer a business needs.
─────────────────────
💡 Key Findings
─────────────────────
💰 Total Revenue → $22.91M across 4 years
📺 Top Category → Smart TV ($5.6M)
🌍 Top Region → Europe ($7.9M)
🏆 Top Country → Greece ($551K)
📉 Highest Returns → Galaxy Z (10.87%)
📶 5G Premium → $130 higher avg price vs Non-5G
👤 Top Segment → Government ($4.7M)
─────────────────────
Full project — SQL queries, Power BI file, dataset — link in comments 👇
If this helped you or gave you an idea for your own project, drop a 🔥 below.
And if you're also on this data journey — let's connect.
hashtag#DataAnalytics (https://www.linkedin.com/search/results/all/?keywords=%23dataanalytics&origin=HASH_TAG_FROM_FEED) hashtag#PowerBI (https://www.linkedin.com/search/results/all/?keywords=%23powerbi&origin=HASH_TAG_FROM_FEED) hashtag#MySQL (https://www.linkedin.com/search/results/all/?keywords=%23mysql&origin=HASH_TAG_FROM_FEED) hashtag#Samsung (https://www.linkedin.com/search/results/all/?keywords=%23samsung&origin=HASH_TAG_FROM_FEED) hashtag#DataVisualization (https://www.linkedin.com/search/results/all/?keywords=%23datavisualization&origin=HASH_TAG_FROM_FEED) hashtag#PortfolioProject (https://www.linkedin.com/search/results/all/?keywords=%23portfolioproject&origin=HASH_TAG_FROM_FEED) hashtag#SQL (https://www.linkedin.com/search/results/all/?keywords=%23sql&origin=HASH_TAG_FROM_FEED) hashtag#BusinessIntelligence (https://www.linkedin.com/search/results/all/?keywords=%23businessintelligence&origin=HASH_TAG_FROM_FEED) hashtag#DataAnalyst (https://www.linkedin.com/search/results/all/?keywords=%23dataanalyst&origin=HASH_TAG_FROM_FEED)
1
18
Satyam Sharma — Data Analyst Portfolio
1
0