
Sara Akram
Data Analyst passionate about turning data into insights.
New to Contra
Sara is building their profile!
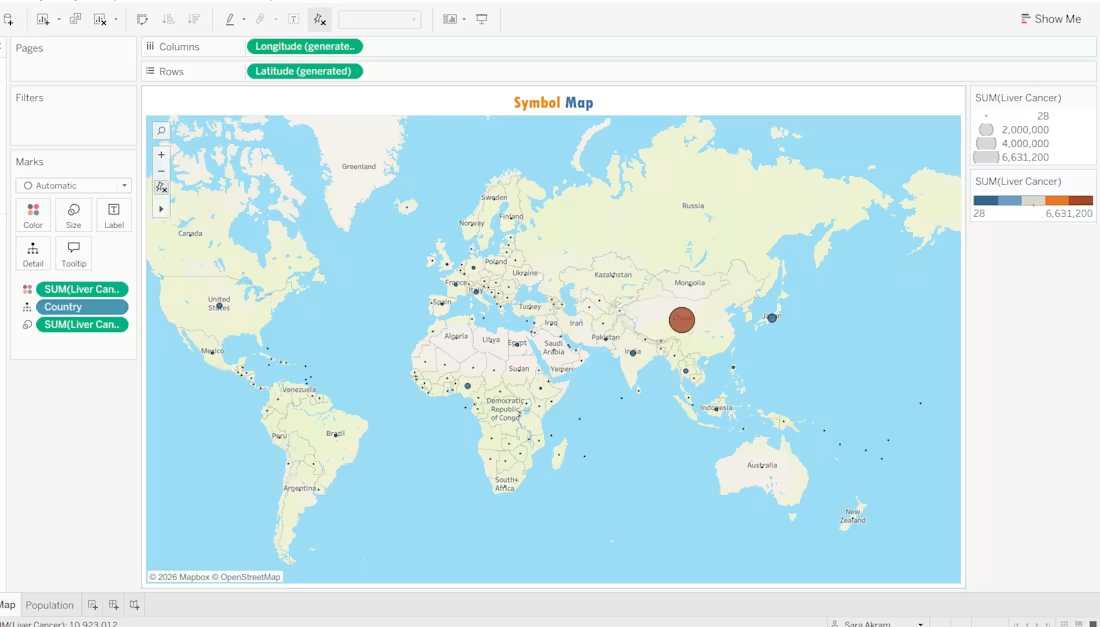
In this project, I used Tableau to build a professional dashboard for analyzing medical and health data. I focused on visualizing key health indicators and trends, transforming complex datasets into clear, interactive charts to help in better data-driven decision making.
0
5
I managed a marketing campaign across Instagram, Facebook, and Email using Google Sheets. I tracked and analyzed the performance data, which revealed that Email marketing delivered the best results with the highest engagement rates.
0
10
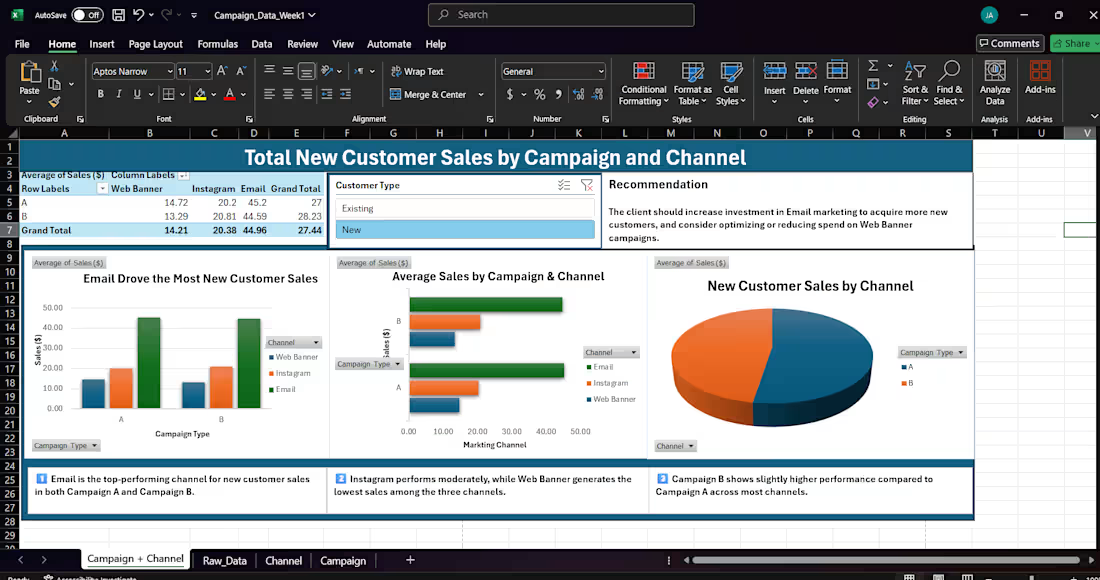
We conducted a multi-channel marketing campaign across Instagram, Facebook, and Email to drive engagement. After analyzing the performance data, the results clearly showed that the Email campaign outperformed all other platforms, achieving the highest conversion rates and audience response.
0
14
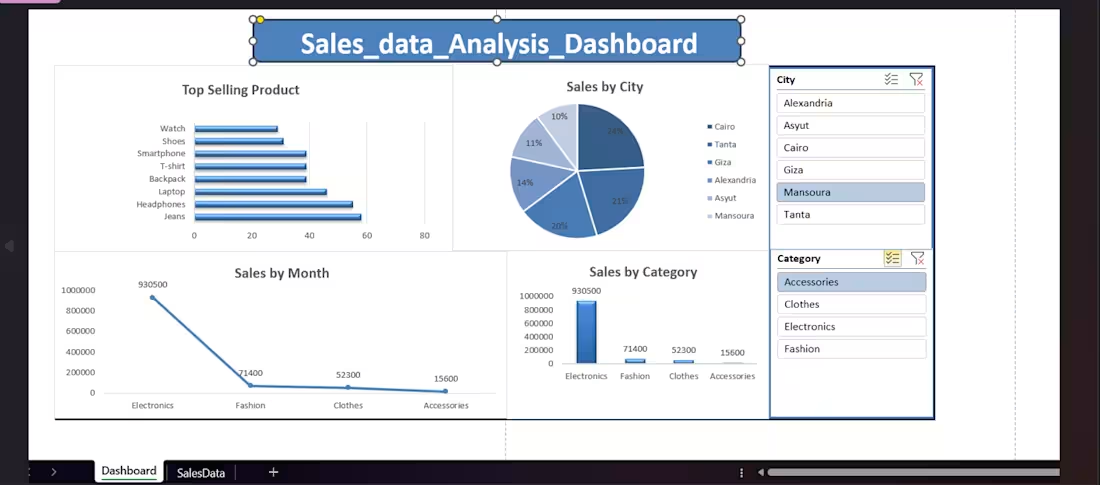
This project is an interactive Sales Data Analysis Dashboard designed to explore and visualize sales performance across multiple dimensions. It highlights top-selling products, sales distribution by city, and category performance, providing a clear view of where revenue is generated. The dashboard also tracks sales trends and allows users to filter data dynamically by city and category, enabling deeper insights into customer behavior and regional performance. Built using data visualization tools, this dashboard transforms raw sales data into meaningful insights that support strategic decision-making.
0
19
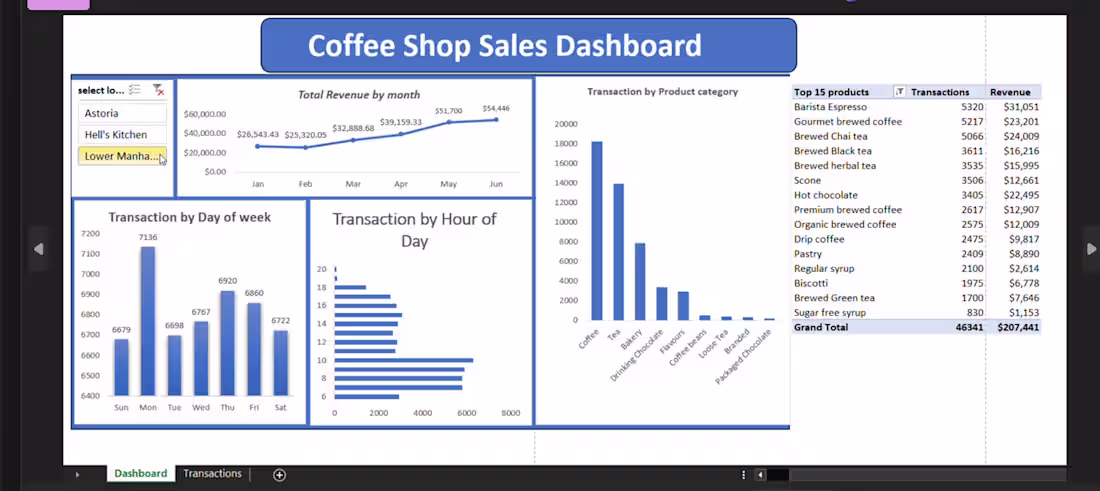
This project is an interactive Coffee Shop Sales Dashboard built to analyze sales performance across different store locations. It tracks total revenue by month, transactions by product category, sales by day of the week, and hourly transaction trends, helping identify peak sales periods and best-selling products. The dashboard also includes dynamic filters for store locations and highlights the top 15 products based on transactions and revenue. It was created using data analysis and visualization techniques to transform raw sales data into actionable business insights that support better decision-making.
0
17