
Sandeep Bhukya
Data Analyst | SQL, Power BI & Excel Expert
New to Contra
Sandeep is building their profile!
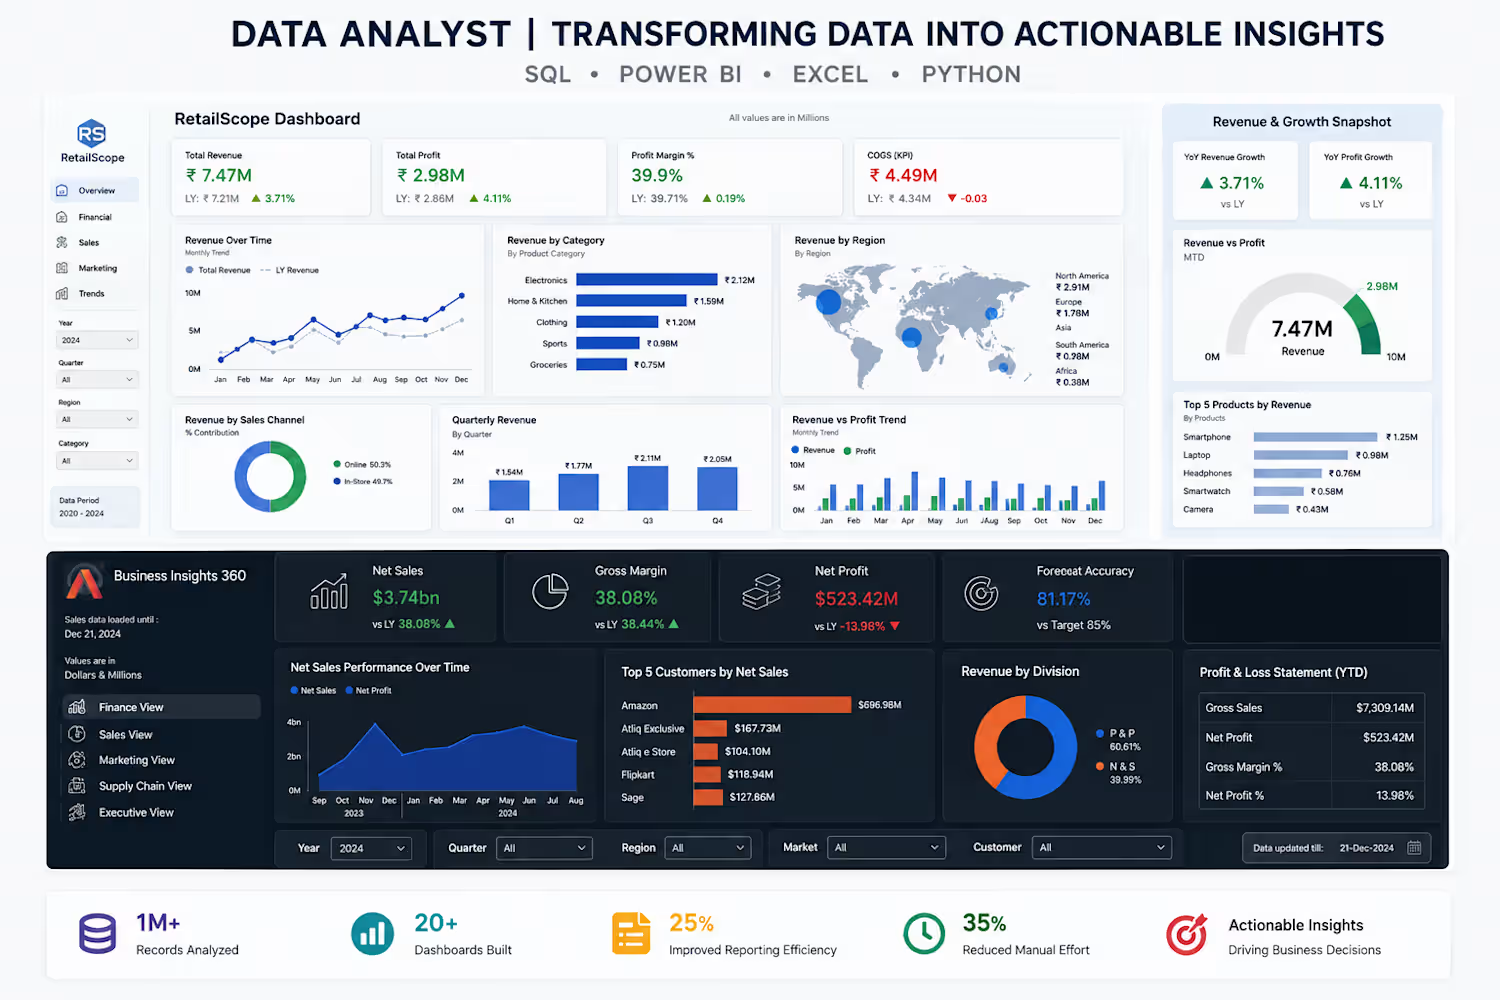
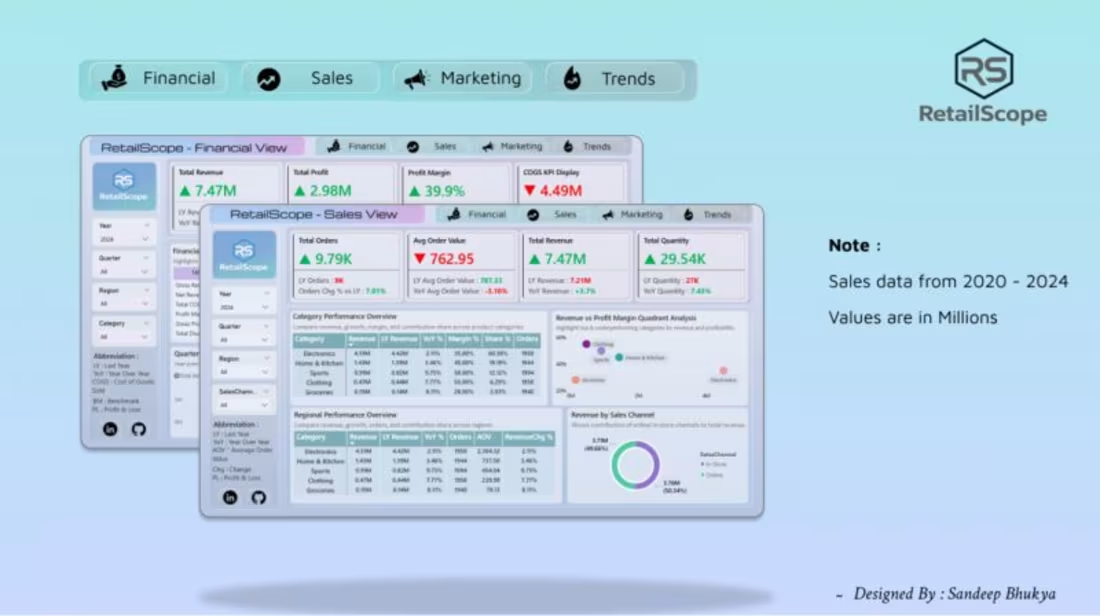
RetailScope 360°: Retail Analytics Dashboard
0
0
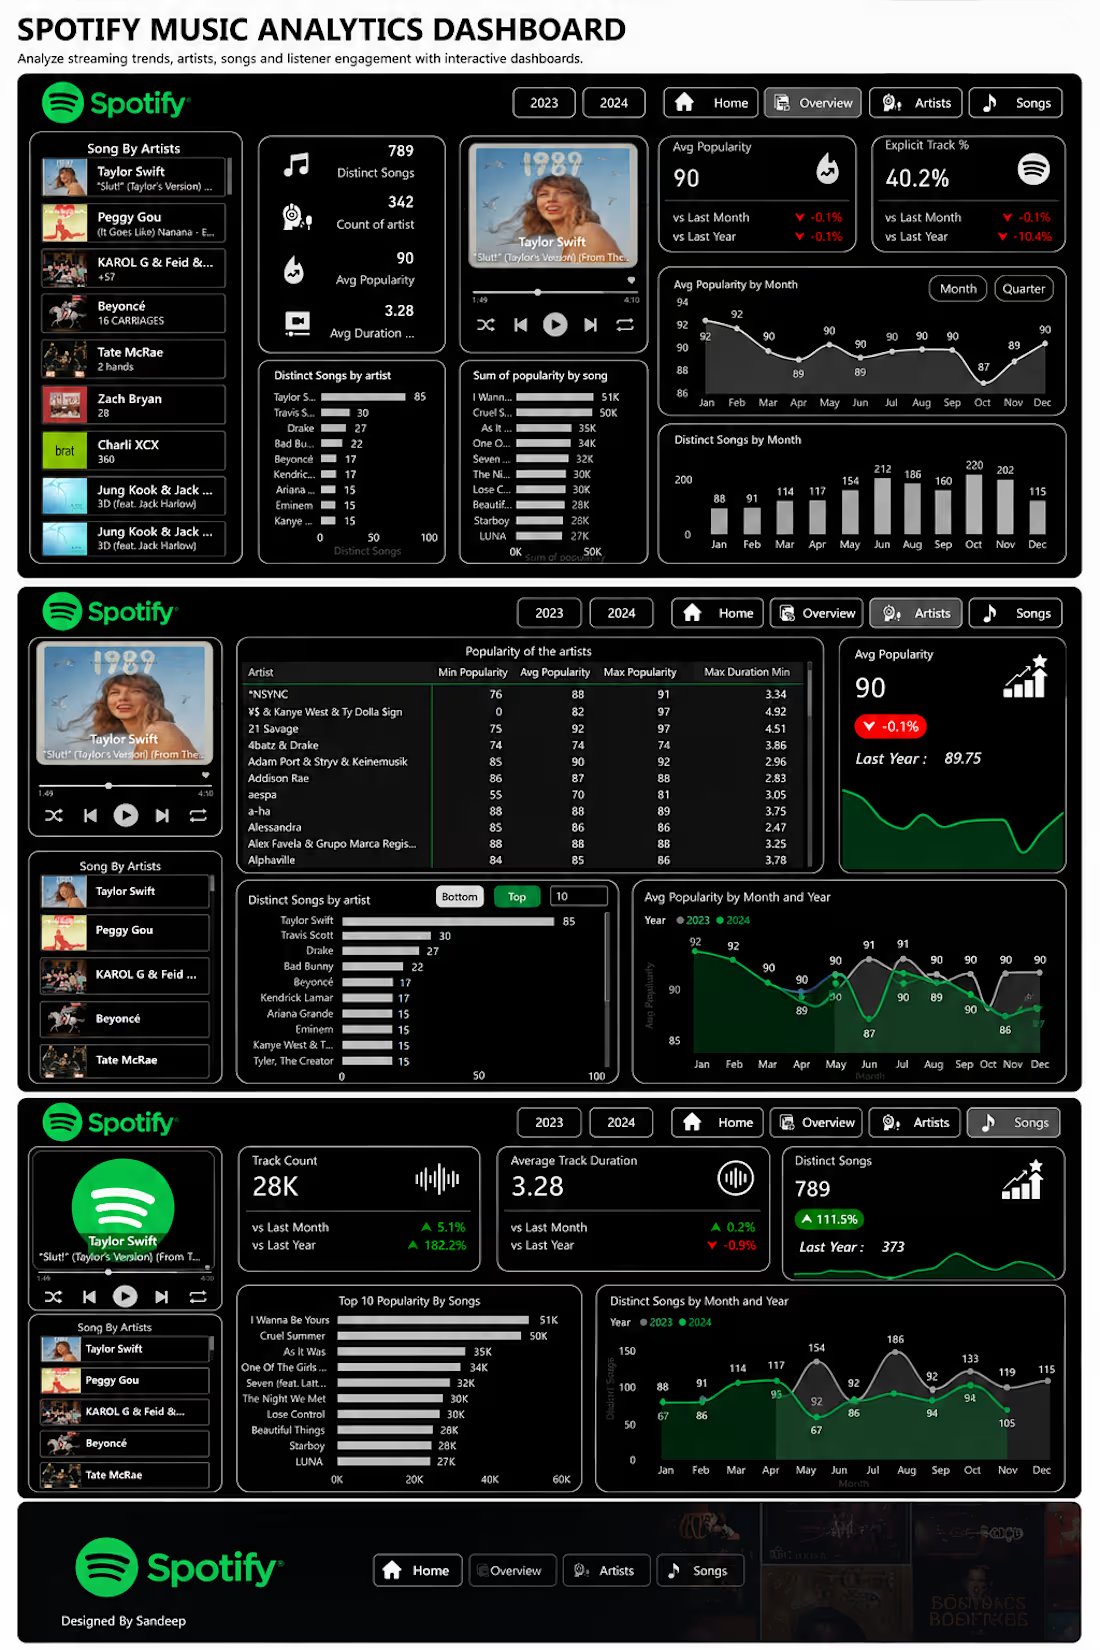
🎵 Spotify Music Analytics Dashboard | Power BI & SQL
Transforming music streaming data into actionable insights using SQL, Power BI, Python, and Excel.
Spotify Music Analytics is an end-to-end Business Intelligence solution designed to analyze streaming trends, artist performance, track popularity, and listener engagement through interactive dashboards and data-driven visualizations.
🔹 What I Did
• Collected, cleaned, and transformed Spotify streaming data using SQL and Python
• Built an optimized data model in Power BI
• Created interactive dashboards with drill-down and cross-filtering capabilities
• Developed DAX measures for key music streaming KPIs
• Designed dashboards to analyze artists, albums, tracks, genres, and streaming trends
📊 Dashboard Features
• Executive Summary Dashboard
• Streaming Performance Analysis
• Top Artists & Top Tracks
• Album & Genre Performance
• Monthly & Yearly Streaming Trends
• Popularity Score Analysis
• Listening Behavior Insights
• Track & Artist Comparison
• Interactive Filters & Drill-through Navigation
🛠 Tools & Technologies
• Power BI
• SQL
• Python
• Pandas
• Microsoft Excel
• DAX
• Power Query
📈 Project Impact
• Analyzed 100K+ Spotify streaming records
• Built interactive dashboards for music analytics
• Identified top-performing artists, albums, and tracks
• Analyzed streaming trends and listener engagement
• Improved reporting through automated visual analytics
• Delivered actionable insights for data-driven decision-making
🔗 Live Dashboard
https://app.powerbi.com/view?r=eyJrIjoiZGVkMGFjZWEtYzQ1ZS00Nzc0LWFkNzEtZTFhM2I1ZTUyM2ZkIiwidCI6ImY3ZGEyNGU1LWIyNDAtNDZlZC04OWFjLWE0NjczYTRlZGMxMSJ9
💻 GitHub Repository
https://github.com/Sandeep-crtl/Spotify-Insights
📝 LinkedIn Project Post
https://www.linkedin.com/feed/update/urn:li:activity:7414892040796229632/
#PowerBI #SQL #Python #Spotify #MusicAnalytics #DataAnalytics #BusinessIntelligence #Dashboard #DataVisualization #DAX #PowerQuery #Pandas #DataScience
0
16
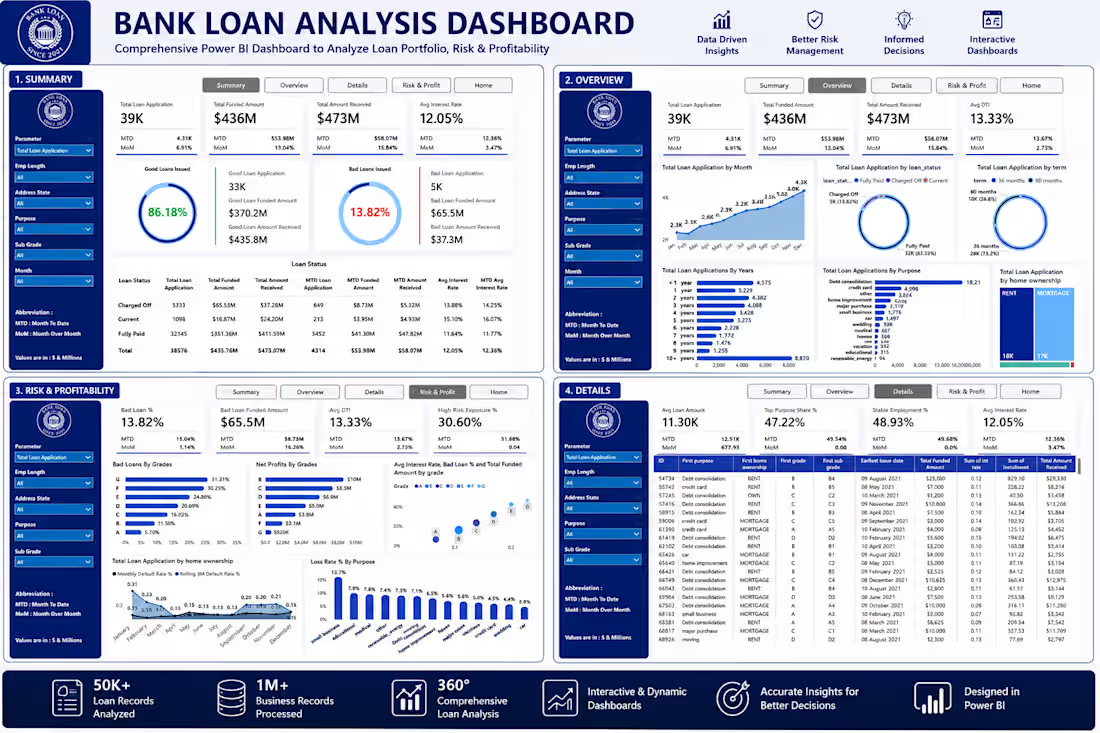
🏦 Bank Loan Analysis Dashboard | Power BI & SQL
Transforming raw banking data into actionable insights using SQL, Power BI, Excel, and DAX.
Bank Loan Analysis is an end-to-end Business Intelligence solution designed to help banks and financial institutions monitor loan performance, borrower behavior, portfolio quality, and risk through interactive dashboards and KPI-driven analytics.
🔹 What I Did
• Extracted, cleaned, and transformed loan data using SQL and Excel
• Built an optimized data model in Power BI
• Created interactive dashboards with drill-down and cross-filtering capabilities
• Developed DAX measures for key banking and lending KPIs
• Designed Summary, Overview, Risk & Profitability, and Details dashboards
📊 Dashboard Features
• Executive Summary Dashboard
• Loan Portfolio Overview
• Good Loans vs Bad Loans Analysis
• Funded Amount & Amount Received Analysis
• Interest Rate & Debt-to-Income (DTI) Analysis
• Loan Status Monitoring
• Loan Purpose Analysis
• Home Ownership Analysis
• Risk & Profitability Dashboard
• Loan Grade & Sub-Grade Analysis
• Interactive Filters & Drill-through Navigation
🛠 Tools & Technologies
• Power BI
• SQL
• Microsoft Excel
• DAX
• Power Query
📈 Project Impact
• Analyzed 39K+ loan applications
• Processed over $436M in funded loans
• Tracked over $473M in loan repayments
• Identified 86.18% Good Loans and 13.82% Bad Loans
• Delivered interactive dashboards for faster, data-driven lending decisions
• Improved portfolio monitoring through real-time KPI tracking
🔗 Live Dashboard
https://app.powerbi.com/view?r=eyJrIjoiOTdlMzgxMWMtYmFkMi00MzQyLThmYzgtYjg4OTRkMzRjMzdhIiwidCI6ImY3ZGEyNGU1LWIyNDAtNDZlZC04OWFjLWE0NjczYTRlZGMxMSJ9
💻 GitHub Repository
https://github.com/Sandeep-crtl/Bank_loan_analysis
📝 LinkedIn Project Post
https://www.linkedin.com/feed/update/urn:li:activity:7418738759317450752/
#PowerBI #SQL #BankingAnalytics #FinancialAnalytics #BusinessIntelligence #DataAnalytics #Dashboard #DataVisualization #DAX #PowerQuery #LoanAnalysis #RiskAnalysis #BusinessAnalytics
0
25
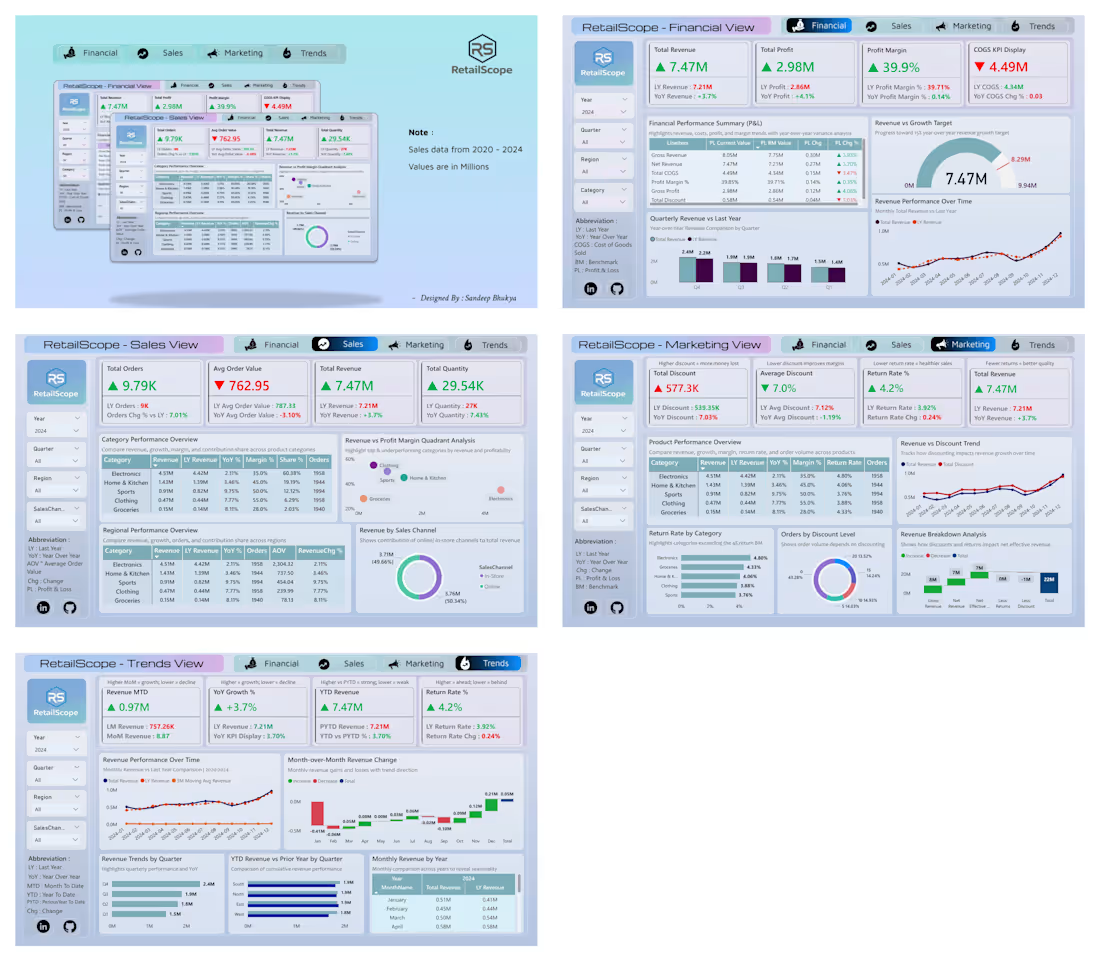
RetailScope is a retail analytics project developed using Advanced Excel, SQL, and Power BI to transform over 50,000 retail records into automated reporting solutions. I performed data cleaning, analysis, and reporting to create interactive dashboards that tracked key business metrics such as revenue, profit margins, sales performance, and conversion rates. By automating Excel reports and building Power BI dashboards, the project reduced manual reporting effort by 35% while providing actionable insights for better business decision-making.
0
24