RetailScope 360°: Retail Analytics Dashboard

Sandeep Bhukya


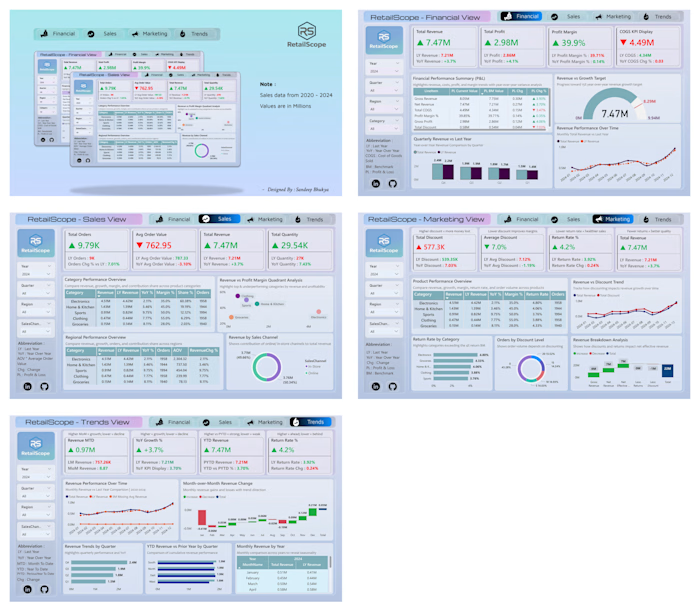
Excited to share my latest Power BI project — RetailScope 360°, a full-stack retail analytics dashboard built on 5 years of data (2020–2024) using Microsoft Power BI Desktop. What I built A 4-page interactive dashboard covering Finance, Sales, Marketing, and Trend Analysis — designed to reflect real business decision-making. Dataset overview 43,000+ daily transactions across 5 years 5 product categories: Electronics, Clothing, Groceries, Home & Kitchen, Sports 4 regions × 2 sales channels (Online and In-Store) Key business insights Electronics drives ~60% of revenue but only 35% margin Clothing delivers the highest profitability at 55% margin Growth is slowing — from +7.94% (2021) to +3.70% (2024) Online vs In-Store split is almost equal (50.34% vs 49.66%) Strong seasonality — Nov/Dec spikes 30–50% Return rate at 4.2% (above 4% benchmark) ~10.9% revenue loss due to discounts and returns Technical highlights 20+ DAX measures (YoY, MoM, YTD, PYTD, moving averages) Disconnected P&L table using SWITCH() Custom Date Table for time intelligence 4-quadrant performance analysis Waterfall charts, heat map, and trend visuals GitHub Repo: https://github.com/Sandeep-crtl/Retailsales Live Dashboard: https://app.powerbi.com/view?r=eyJrIjoiOWI3MTdmOGYtNjkxNi00OWM2LWEzYTMtOTk3NjM4MjRlZTczIiwidCI6ImY3ZGEyNGU1LWIyNDAtNDZlZC04OWFjLWE0NjczYTRlZGMxMSJ9 If you're building dashboards and focusing only on visuals, you're doing it wrong. Focus on insights that drive decisions. #PowerBI #DAX #RetailAnalytics #DataAnalytics #BusinessIntelligence #DataVisualization #PortfolioProject
Like this project
Posted Aug 6, 2026
Developed a retail analytics dashboard using Power BI covering finance and sales insights.
Likes
0
Views
0
Timeline
Jan 1, 2020 - Dec 31, 2024