
Samiya Imran
Data Analyst | SQL, Python, Excel, Power BI & Tableau
New to Contra
Samiya is building their profile!
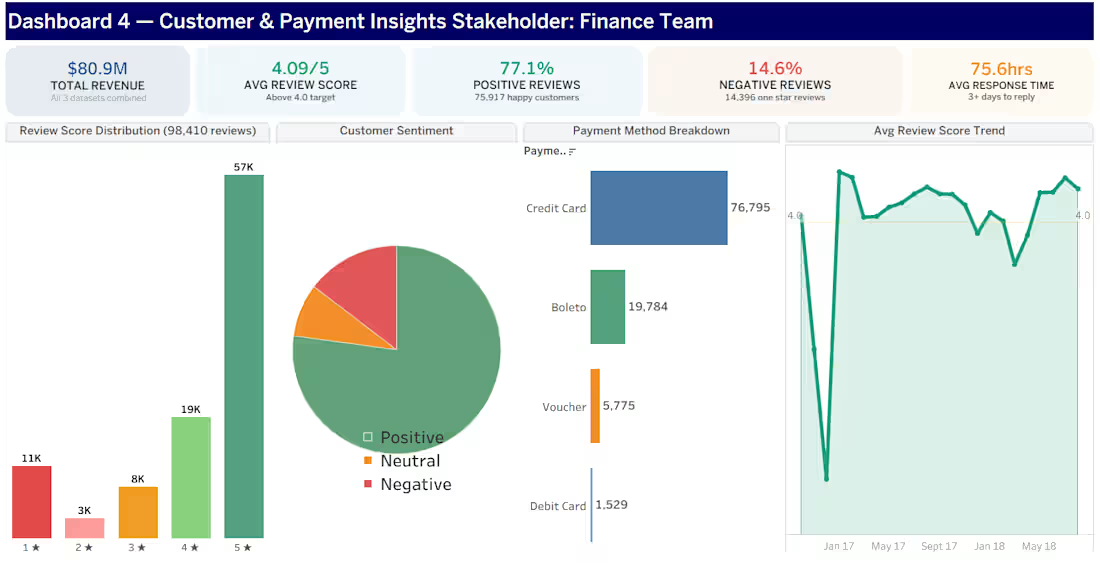
Built a 4-part Power BI dashboard suite analyzing $80M+ in revenue for supply chain & e-commerce data — designed for 4 different stakeholders.
📊 Executive KPI Dashboard (VP of Supply Chain) — Revenue, profit & a 71% revenue drop identified in 2018
🚚 Delivery Performance (Procurement Team) — 54.8% late delivery rate flagged, broken down by shipping class
📦 Product & Warehouse Analysis (Warehouse Ops) — 33K SKUs across 9 warehouses, revenue vs. margin comparison
💳 Customer & Payment Insights (Finance Team) — Sentiment, review scores & payment method breakdown
Tools: Tableau, SQL, Excel, Python
1
31