
Salma El Zahar
Excel & Business Support Specialist
Ready for work
Salma is ready for their next project!
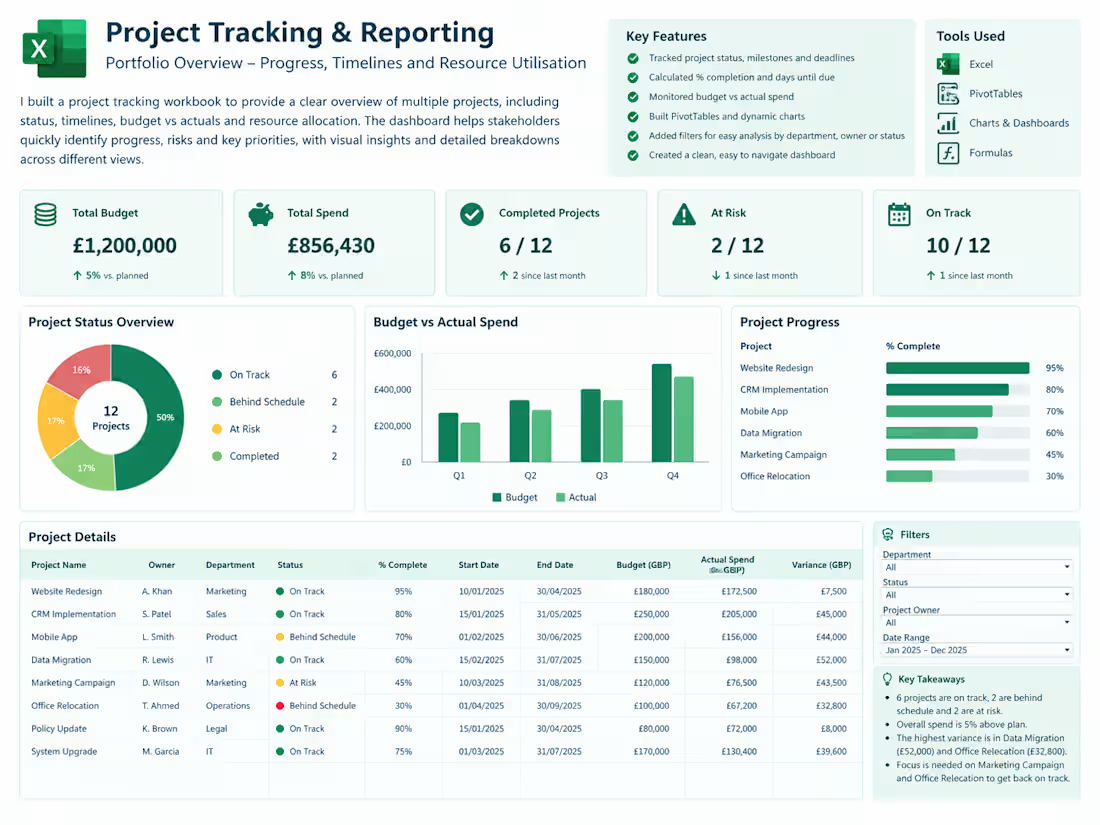
I developed an Excel-based project tracking and reporting workbook to bring project status, milestones, timelines, budgets and resource information into one place. I organised the underlying data, calculated project completion and budget variances, and used formulas, PivotTables and charts to create a clear reporting dashboard. The final output made it easier to monitor progress, identify projects requiring attention and provide a concise view of overall portfolio performance.
0
23
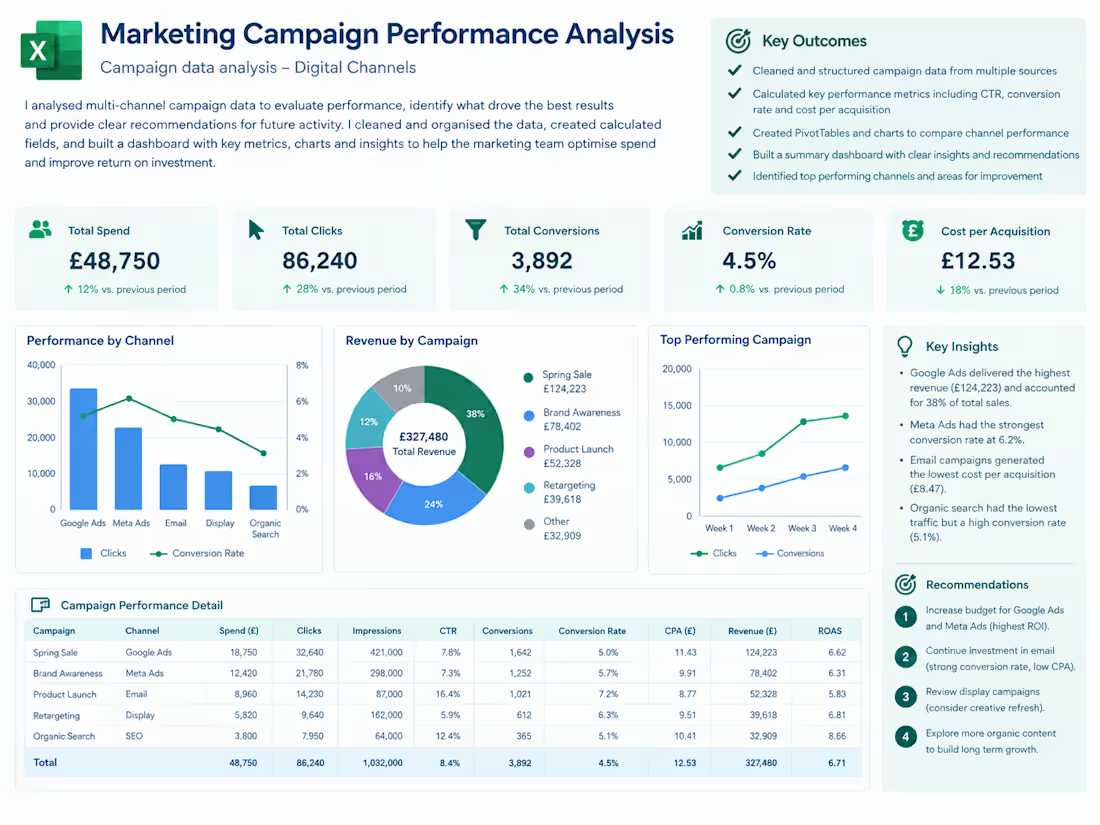
I analysed multi-channel marketing campaign data to evaluate campaign performance, spend, conversions and return on investment. I cleaned and structured the data, calculated key metrics including click-through rate, conversion rate and cost per acquisition, and used Excel formulas, PivotTables and charts to compare performance across channels and campaigns. I then created a dashboard highlighting key findings and areas for improvement to support future marketing decisions.
0
24
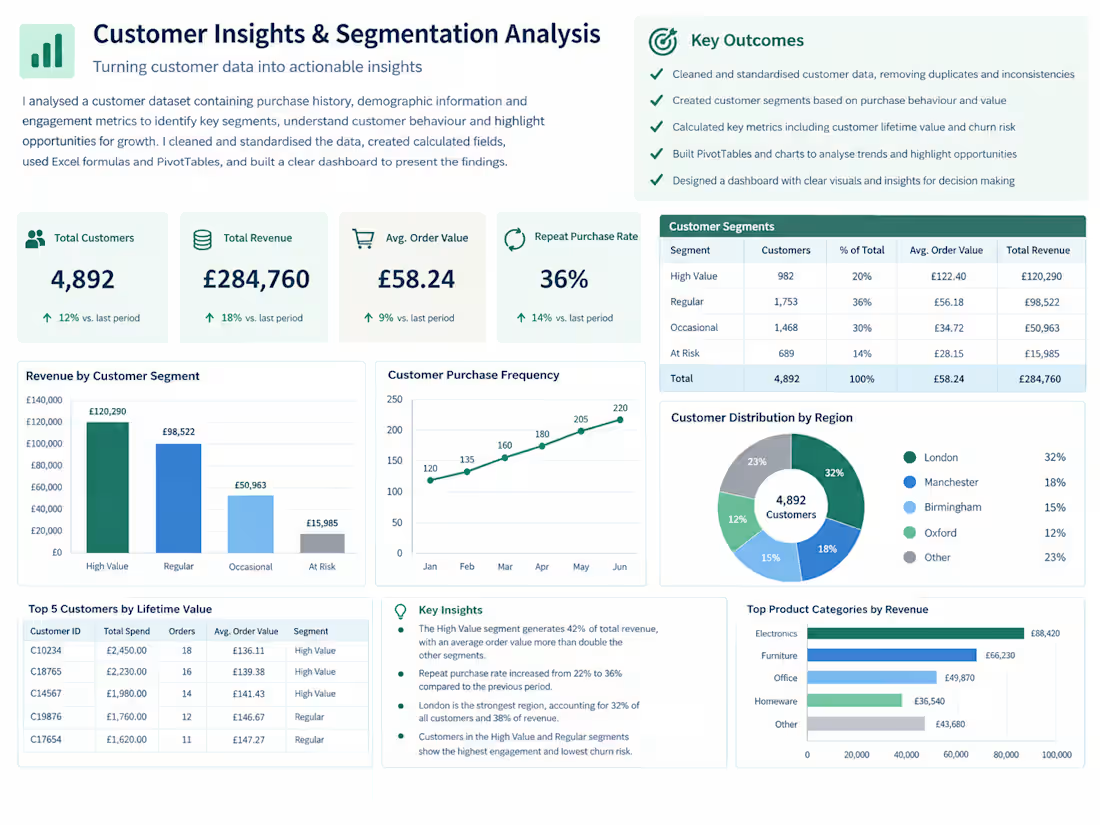
I analysed customer data covering purchase history, customer behaviour and engagement to identify key customer segments and performance trends.
I cleaned and standardised the underlying data, created calculated fields and used Excel formulas and PivotTables to analyse customer value, purchase frequency, revenue and regional performance.
I then developed a clear dashboard bringing the findings together, including customer segmentation, key performance metrics, charts and insights to support commercial analysis and decision-making.
0
26
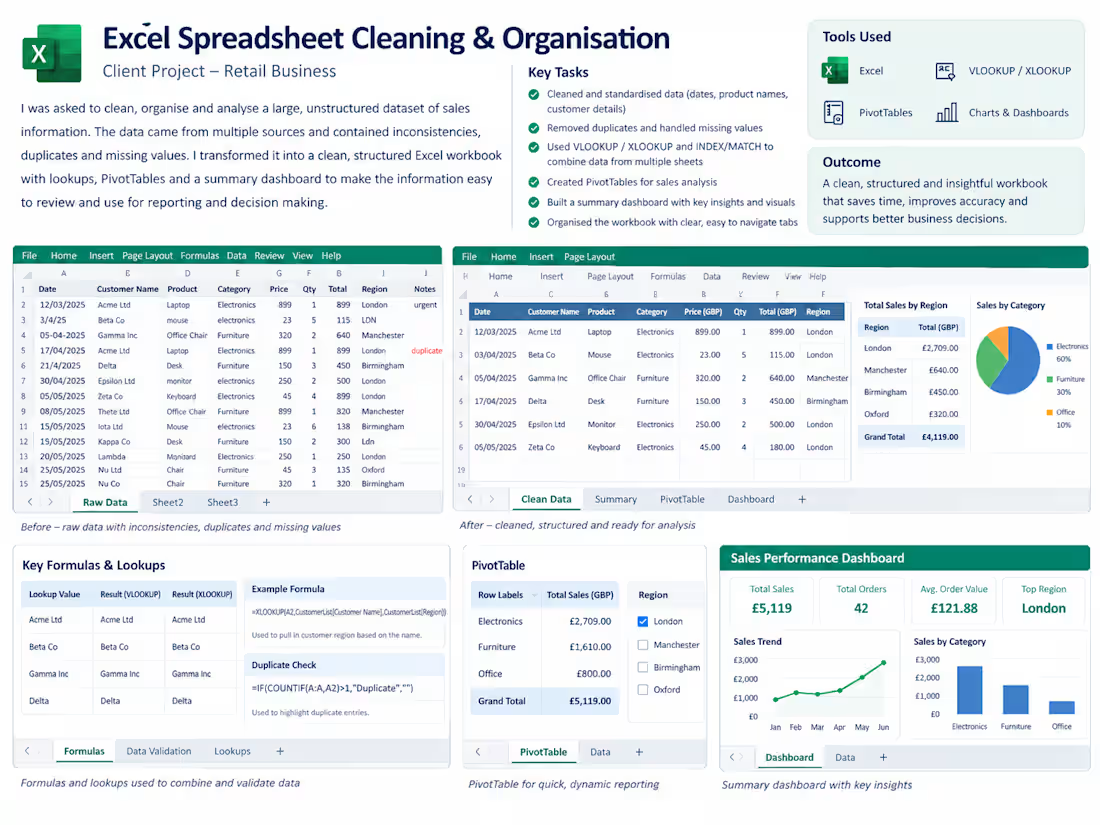
I worked on an Excel data organisation and reporting project involving a large retail sales dataset with inconsistent formatting, duplicate records and information across multiple worksheets.
I cleaned and standardised the data, used VLOOKUP/XLOOKUP and INDEX/MATCH to connect information, and created PivotTables to analyse sales by category and region.
I then structured the workbook into clear, easy-to-navigate sections and created a summary dashboard with key metrics and visual insights, making the data much easier to review, analyse and use for reporting.
0
25