
Data Analysis, SQL & Business Intelligence DashboardsNandan Priyadarshi
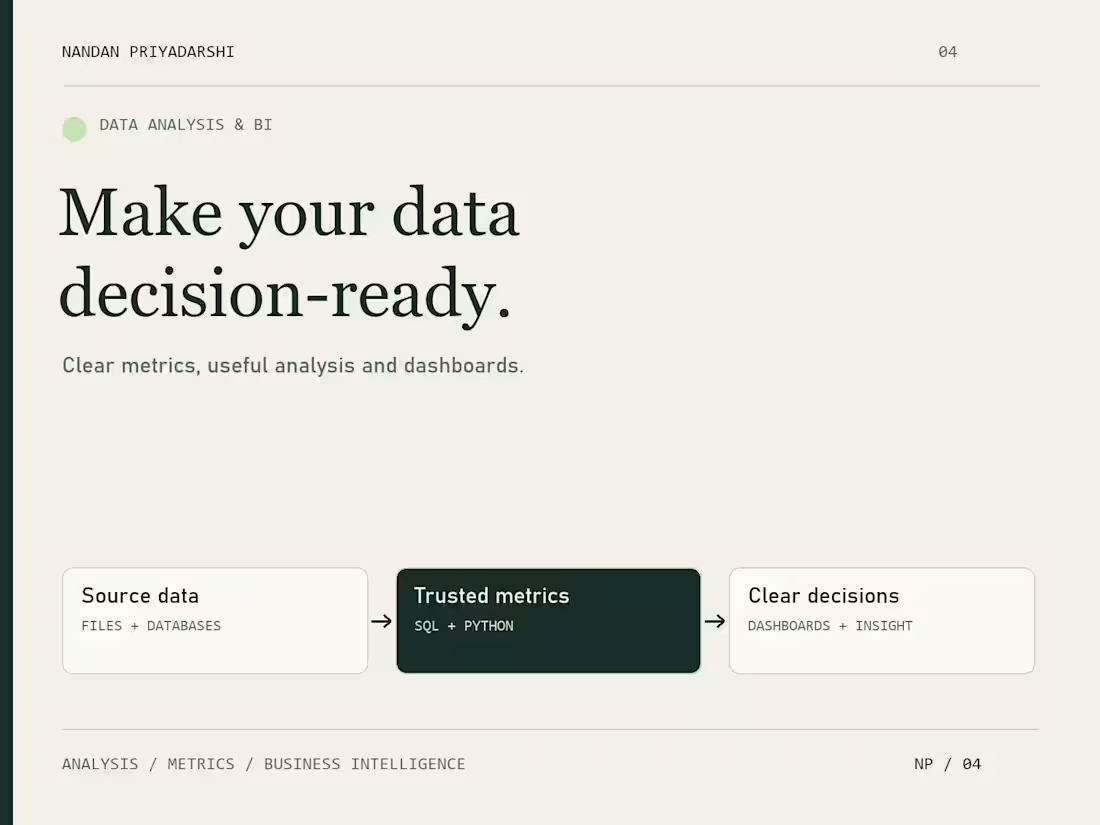
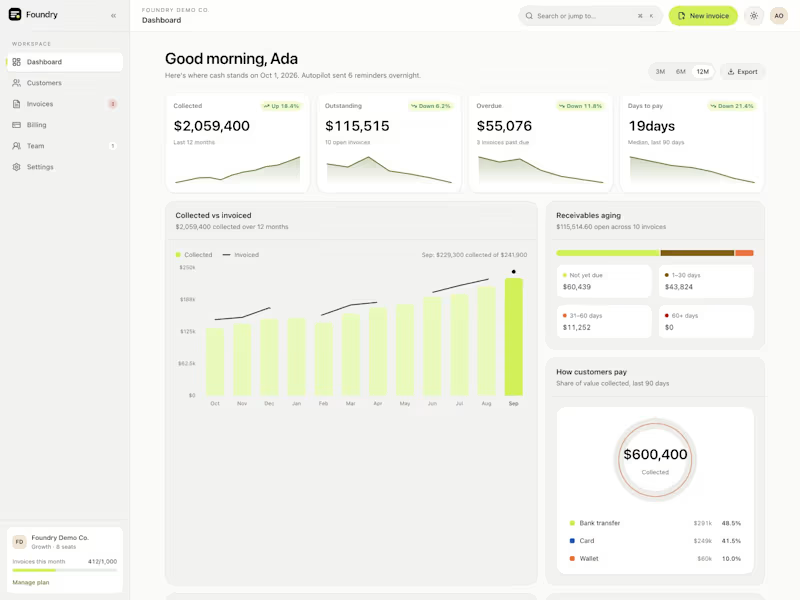
Turn scattered spreadsheets and database tables into clear business decisions.
I combine data product thinking with practical analysis to help teams understand performance, define consistent KPIs and build useful reporting workflows.
What you get
Review of your data sources and business questions
Data cleaning, exploratory analysis and documented assumptions
Agreed metric definitions and SQL/Python analysis
A dashboard or visual report suited to your workflow
Findings, limitations and prioritized recommendations
Reusable queries or code and a handover
Good fit
Sales and operational reporting, KPI alignment, spreadsheet analysis, reporting automation and data quality checks. Tools are selected around your existing stack, including Power BI where appropriate.
Start with one milestone
One business question and one representative dataset: validate the data, agree the KPI definitions and deliver one report or dashboard with reusable queries or code.
To get started
Send your decision questions, current reports, a sample dataset and the audience for the analysis. Use anonymized data for initial scoping.
Pricing & scope
Contact me for a scoped quote. Data availability, refresh requirements and the number of sources determine the timeline.
FAQs
Example work
Contact for pricing
Duration1 week
Tags
Python

Data Analyst
Service provided by
Nandan Priyadarshi proIndia
Data Analysis, SQL & Business Intelligence DashboardsNandan Priyadarshi
Contact for pricing
Duration1 week
Tags
Python
Data Analyst
Turn scattered spreadsheets and database tables into clear business decisions.
I combine data product thinking with practical analysis to help teams understand performance, define consistent KPIs and build useful reporting workflows.
What you get
Review of your data sources and business questions
Data cleaning, exploratory analysis and documented assumptions
Agreed metric definitions and SQL/Python analysis
A dashboard or visual report suited to your workflow
Findings, limitations and prioritized recommendations
Reusable queries or code and a handover
Good fit
Sales and operational reporting, KPI alignment, spreadsheet analysis, reporting automation and data quality checks. Tools are selected around your existing stack, including Power BI where appropriate.
Start with one milestone
One business question and one representative dataset: validate the data, agree the KPI definitions and deliver one report or dashboard with reusable queries or code.
To get started
Send your decision questions, current reports, a sample dataset and the audience for the analysis. Use anonymized data for initial scoping.
Pricing & scope
Contact me for a scoped quote. Data availability, refresh requirements and the number of sources determine the timeline.
FAQs
Example work
Contact for pricing