
Professional KPI Dashboard Design in Excel or Power BIAtanranshe Oluwabusola
📊 Custom KPI Dashboard
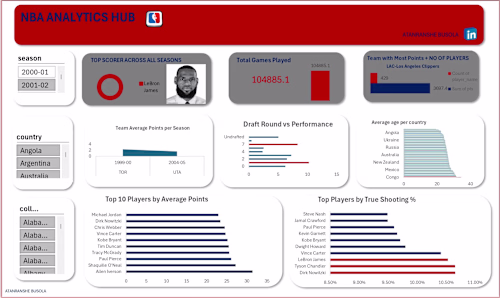
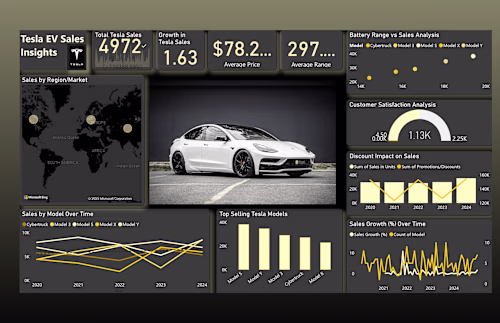
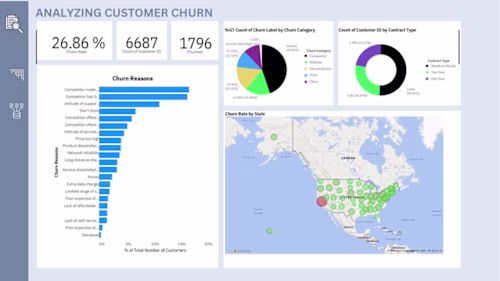
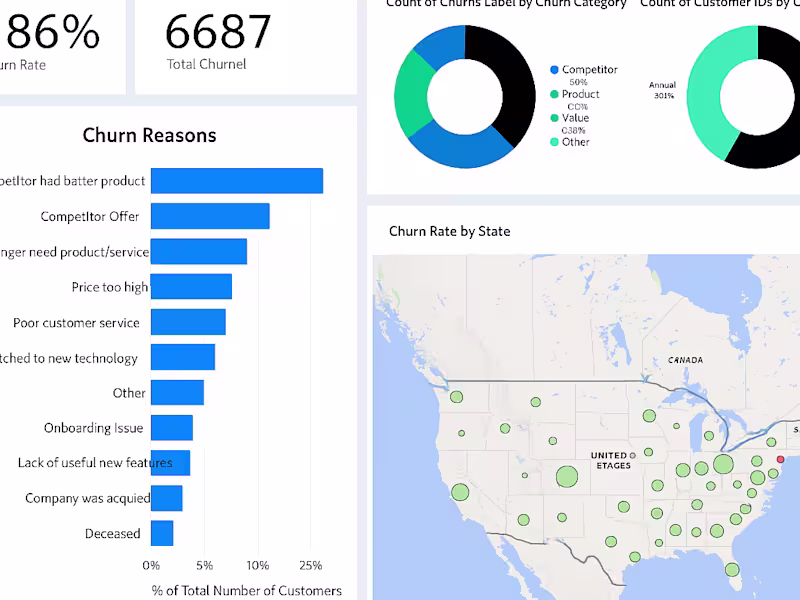
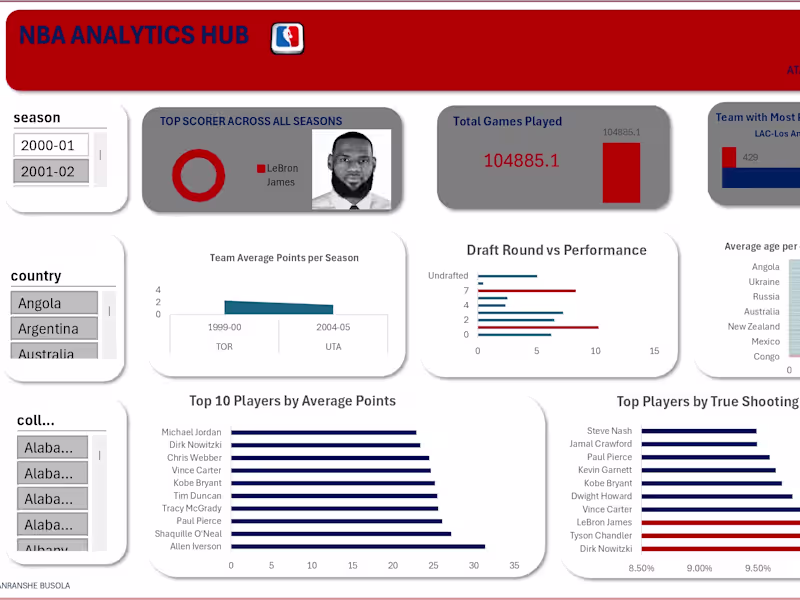
A personalized dashboard designed to visualize your most important business metrics — from revenue, sales, and conversions to churn, retention, and customer behavior — with clear and compelling visuals.
🎯 Tailored KPI Selection
Help in selecting the right KPIs for your business goals. I don’t just design — I collaborate with you to make sure you’re tracking the right metrics.
🧹 Data Cleaning & Preparation
I will clean and organize your raw data, ensuring consistency, accuracy, and readiness for visualization. This includes removing duplicates, formatting, creating calculated fields, and restructuring messy data.
🧠 Data Modeling (Power BI)
For Power BI projects, I’ll build relationships between tables, create calculated measures using DAX, and optimize your model for performance.
🎨 Brand-Aligned Design
Your dashboard will reflect your brand’s colors, fonts, and style, making it presentation-ready for stakeholders and internal reports.
🖱️ Interactive Filters & Drill-downs
Add functionality like slicers, date range filters, drill-downs, tooltips, and clickable charts to explore data in-depth — no tech experience needed.
🌐 Auto-Refresh Setup (Power BI Only)
Set up scheduled refreshes for real-time or live connections to data sources like Excel files, Google Sheets, or SQL databases.
📈 Insights Summary & Key Takeaways
A short insights report or callout section that highlights trends, anomalies, and strategic recommendations based on your data.
🎥 Walkthrough Video Guide (Optional)
A short video (3–5 mins) walking you through your dashboard so you or your team can use it confidently, even if you’re not tech-savvy.
💼 This is Perfect For:
Startups & growing businesses
Marketing teams
Sales managers
Product managers
CEOs/founders who want clarity on performance
🛠️ Tools I Use:
Microsoft Excel
Power BI
Google Sheets (as data source if needed)
🔁 Optional Add-ons:
Monthly updates to your dashboard
PDF export or PowerPoint-ready versions
Additional data source integration
Embedding Power BI dashboard on your website
What's included
Professional KPI Dashboard Design in Excel or Power BI
Looking for a stunning, fully customized KPI dashboard to track your business performance and drive better decisions?
I will design a professional, interactive dashboard using Excel or Power BI, tailored to your specific business needs. Whether it’s tracking sales, marketing performance, customer churn, or internal operations — you’ll get a clear, actionable view of your data in a format that’s easy to use and visually appealing.
📊 Custom Dashboard Design
🎨 Visual Styling & Branding
🔍 Data Cleaning & Modeling
📱 Interactive Elements
🚀 Insights & Recommendations
Professional KPI Dashboard Design in Excel or Power BI
📊 Custom Dashboard Design
Professional KPI Dashboard Design in Excel or Power BI
🎨 Visual Styling & Branding
Starting at$300
Duration5 days
Tags
D3.js
Matplotlib
Tableau
TensorFlow
three.js
Data Analyst
Data Scientist
Data Visualizer
Service provided by
Atanranshe Oluwabusola Lagos, Nigeria
- 1
- Paid projects
- 5.00
- Rating
- 30
- Followers
Professional KPI Dashboard Design in Excel or Power BIAtanranshe Oluwabusola
Starting at$300
Duration5 days
Tags
D3.js
Matplotlib
Tableau
TensorFlow
three.js
Data Analyst
Data Scientist
Data Visualizer
📊 Custom KPI Dashboard
A personalized dashboard designed to visualize your most important business metrics — from revenue, sales, and conversions to churn, retention, and customer behavior — with clear and compelling visuals.
🎯 Tailored KPI Selection
Help in selecting the right KPIs for your business goals. I don’t just design — I collaborate with you to make sure you’re tracking the right metrics.
🧹 Data Cleaning & Preparation
I will clean and organize your raw data, ensuring consistency, accuracy, and readiness for visualization. This includes removing duplicates, formatting, creating calculated fields, and restructuring messy data.
🧠 Data Modeling (Power BI)
For Power BI projects, I’ll build relationships between tables, create calculated measures using DAX, and optimize your model for performance.
🎨 Brand-Aligned Design
Your dashboard will reflect your brand’s colors, fonts, and style, making it presentation-ready for stakeholders and internal reports.
🖱️ Interactive Filters & Drill-downs
Add functionality like slicers, date range filters, drill-downs, tooltips, and clickable charts to explore data in-depth — no tech experience needed.
🌐 Auto-Refresh Setup (Power BI Only)
Set up scheduled refreshes for real-time or live connections to data sources like Excel files, Google Sheets, or SQL databases.
📈 Insights Summary & Key Takeaways
A short insights report or callout section that highlights trends, anomalies, and strategic recommendations based on your data.
🎥 Walkthrough Video Guide (Optional)
A short video (3–5 mins) walking you through your dashboard so you or your team can use it confidently, even if you’re not tech-savvy.
💼 This is Perfect For:
Startups & growing businesses
Marketing teams
Sales managers
Product managers
CEOs/founders who want clarity on performance
🛠️ Tools I Use:
Microsoft Excel
Power BI
Google Sheets (as data source if needed)
🔁 Optional Add-ons:
Monthly updates to your dashboard
PDF export or PowerPoint-ready versions
Additional data source integration
Embedding Power BI dashboard on your website
What's included
Professional KPI Dashboard Design in Excel or Power BI
Looking for a stunning, fully customized KPI dashboard to track your business performance and drive better decisions?
I will design a professional, interactive dashboard using Excel or Power BI, tailored to your specific business needs. Whether it’s tracking sales, marketing performance, customer churn, or internal operations — you’ll get a clear, actionable view of your data in a format that’s easy to use and visually appealing.
📊 Custom Dashboard Design
🎨 Visual Styling & Branding
🔍 Data Cleaning & Modeling
📱 Interactive Elements
🚀 Insights & Recommendations
Professional KPI Dashboard Design in Excel or Power BI
📊 Custom Dashboard Design
Professional KPI Dashboard Design in Excel or Power BI
🎨 Visual Styling & Branding
$300