
Custom Excel Dashboard & Data Analysis for Business InsightsAtanranshe Oluwabusola
Fully Custom KPI Dashboard
A well-designed Excel dashboard tailored to your unique business needs. Visualize key metrics using pivot tables, slicers, dynamic charts, and conditional formatting for at-a-glance reporting.
Data Cleaning & Structuring
Raw data? No problem. I’ll clean, format, and organize your data for seamless analysis — removing duplicates, correcting errors, and structuring tables for optimal performance.
Data Analysis + Insights
I’ll go beyond visuals to analyze your data and provide key business insights. Expect clear patterns, trends, and performance breakdowns that help you act faster and smarter.
Automated Calculations & Formulas
From dynamic KPIs to advanced Excel formulas (LOOKUPs, IFs, INDEX/MATCH, nested logic), I’ll automate everything to keep your dashboard working even with new data.
Slicer-Based Filtering + Drill-Down Views
Filter your data by region, product, team, or time period — all with a few clicks. You’ll get interactive filtering that makes it easy to focus on what matters.
User Guide or Walkthrough Video
I’ll provide simple instructions or a walkthrough video to help you or your team understand how to use the dashboard without needing to be a data expert.
This is Perfect For:
Small business owners
E-commerce sellers
Marketing & sales teams
Coaches and consultants
Founders who need investor-ready visuals
Anyone who wants to move from confusion to clarity
Delivery Format:
Excel (.xlsx) File
Loom video walkthrough (on request)
PDF summary of key insights (if needed)
Optional Add-ons:
Monthly dashboard updates
Power BI version of your dashboard
Extra dashboards for team or department breakdowns
Live call to review and walk through data
Ready to turn your data into a powerful business tool?
Let’s build something great together.
What's included
Custom Excel Dashboard & Data Analysis for Business Insights
Struggling to make sense of your business data? You're not alone. Most businesses collect tons of data but lack the tools and visuals to turn it into actionable insight. That’s where I come in.
Whether you're tracking sales, revenue, customer behavior, operations, or marketing performance, I’ll help you uncover what’s working, what’s not, and what to do next. With my dashboards, you don’t just get charts — you get clarity.
My approach blends clean design, advanced Excel techniques, and real business strategy to give you dashboards that are as beautiful as they are powerful.
Custom Excel Dashboard & Data Analysis for Business Insights
📈 Data Cleaning & Structuring
Raw data? No problem. I’ll clean, format, and organize your data for seamless analysis — removing duplicates, correcting errors, and structuring tables for optimal performance.
Custom Excel Dashboard & Data Analysis for Business Insights
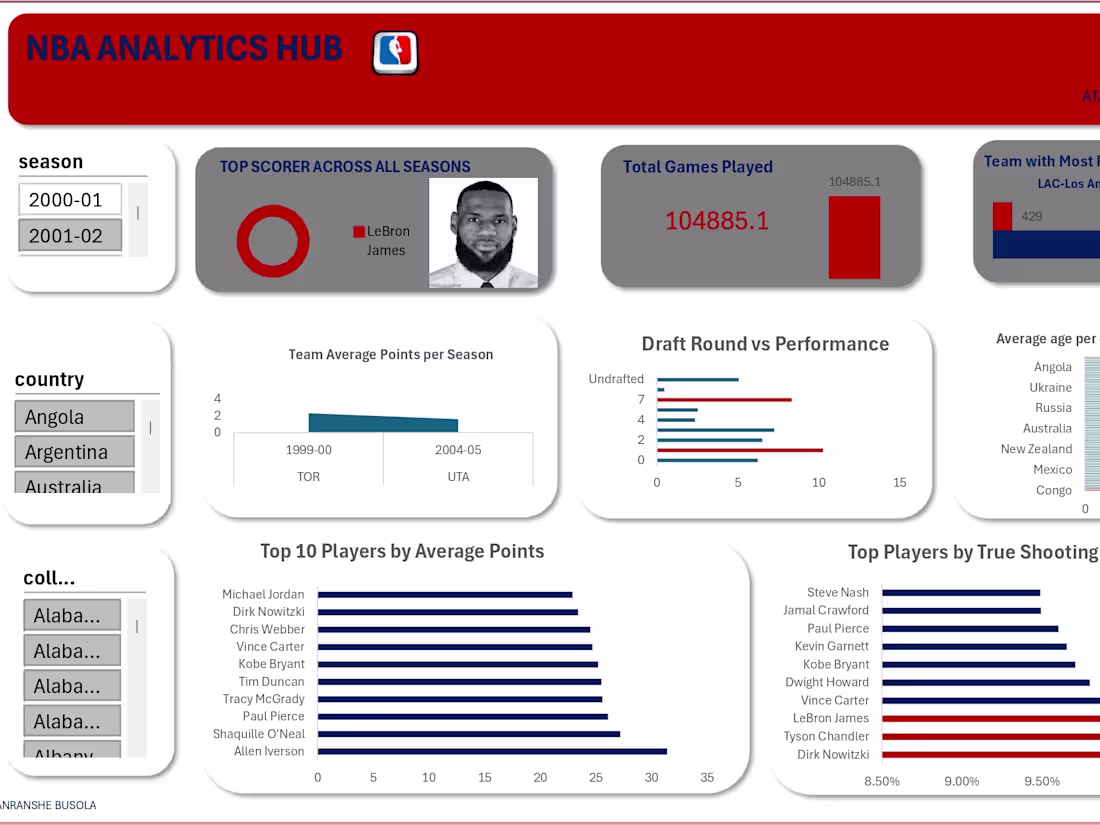
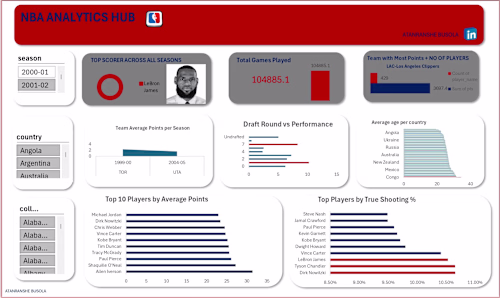
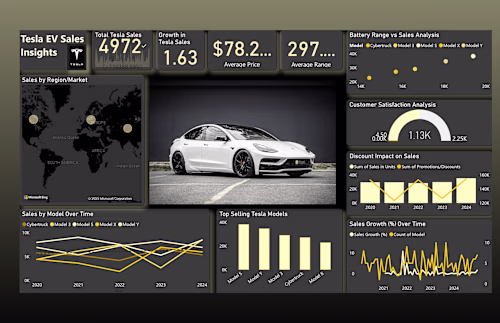
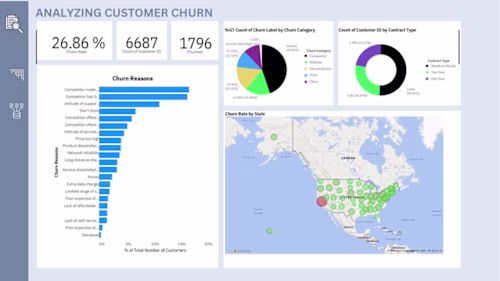
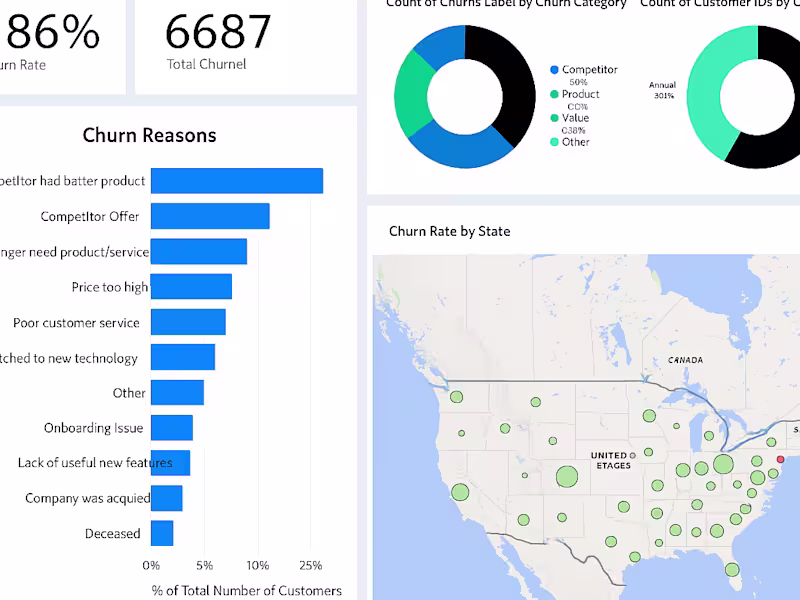
I design interactive, easy-to-understand Excel dashboards that transform raw data into clear visual stories — so you can make smarter decisions, spot trends early, and monitor your KPIs at a glance
Starting at$300
Duration7 days
Tags
MATLAB
Microsoft Excel
pandas
Tableau
Data Analyst
Data Modelling Analyst
Data Scientist
Service provided by
Atanranshe Oluwabusola Lagos, Nigeria
- 1
- Paid projects
- 5.00
- Rating
- 30
- Followers
Custom Excel Dashboard & Data Analysis for Business InsightsAtanranshe Oluwabusola
Starting at$300
Duration7 days
Tags
MATLAB
Microsoft Excel
pandas
Tableau
Data Analyst
Data Modelling Analyst
Data Scientist
Fully Custom KPI Dashboard
A well-designed Excel dashboard tailored to your unique business needs. Visualize key metrics using pivot tables, slicers, dynamic charts, and conditional formatting for at-a-glance reporting.
Data Cleaning & Structuring
Raw data? No problem. I’ll clean, format, and organize your data for seamless analysis — removing duplicates, correcting errors, and structuring tables for optimal performance.
Data Analysis + Insights
I’ll go beyond visuals to analyze your data and provide key business insights. Expect clear patterns, trends, and performance breakdowns that help you act faster and smarter.
Automated Calculations & Formulas
From dynamic KPIs to advanced Excel formulas (LOOKUPs, IFs, INDEX/MATCH, nested logic), I’ll automate everything to keep your dashboard working even with new data.
Slicer-Based Filtering + Drill-Down Views
Filter your data by region, product, team, or time period — all with a few clicks. You’ll get interactive filtering that makes it easy to focus on what matters.
User Guide or Walkthrough Video
I’ll provide simple instructions or a walkthrough video to help you or your team understand how to use the dashboard without needing to be a data expert.
This is Perfect For:
Small business owners
E-commerce sellers
Marketing & sales teams
Coaches and consultants
Founders who need investor-ready visuals
Anyone who wants to move from confusion to clarity
Delivery Format:
Excel (.xlsx) File
Loom video walkthrough (on request)
PDF summary of key insights (if needed)
Optional Add-ons:
Monthly dashboard updates
Power BI version of your dashboard
Extra dashboards for team or department breakdowns
Live call to review and walk through data
Ready to turn your data into a powerful business tool?
Let’s build something great together.
What's included
Custom Excel Dashboard & Data Analysis for Business Insights
Struggling to make sense of your business data? You're not alone. Most businesses collect tons of data but lack the tools and visuals to turn it into actionable insight. That’s where I come in.
Whether you're tracking sales, revenue, customer behavior, operations, or marketing performance, I’ll help you uncover what’s working, what’s not, and what to do next. With my dashboards, you don’t just get charts — you get clarity.
My approach blends clean design, advanced Excel techniques, and real business strategy to give you dashboards that are as beautiful as they are powerful.
Custom Excel Dashboard & Data Analysis for Business Insights
📈 Data Cleaning & Structuring
Raw data? No problem. I’ll clean, format, and organize your data for seamless analysis — removing duplicates, correcting errors, and structuring tables for optimal performance.
Custom Excel Dashboard & Data Analysis for Business Insights
I design interactive, easy-to-understand Excel dashboards that transform raw data into clear visual stories — so you can make smarter decisions, spot trends early, and monitor your KPIs at a glance
$300