
Transform Data into Powerful Visual Stories Atanranshe Oluwabusola
📊 Custom Data Visualizations
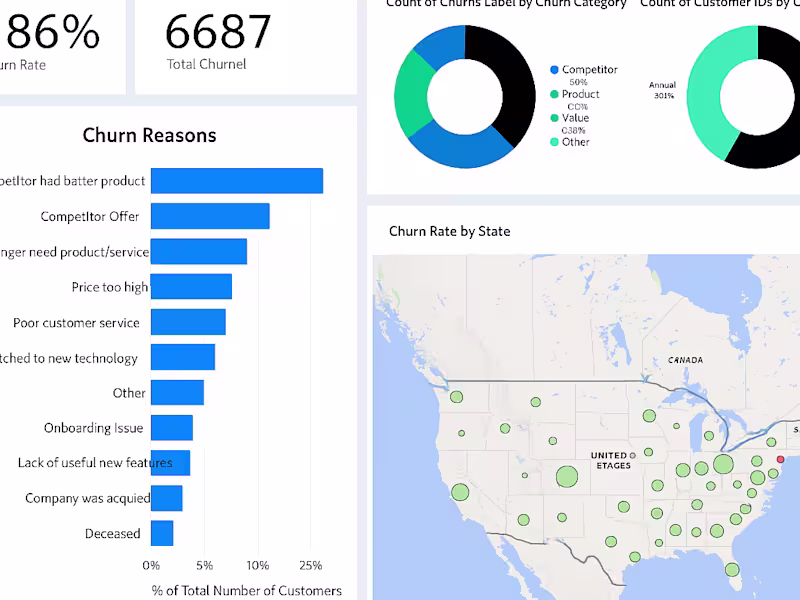
Tailored Dashboards & Charts: Using Excel or Power BI, I will design dynamic, interactive dashboards that visually represent key metrics, KPIs, or performance data.
User-Friendly Visuals: From bar graphs and line charts to heatmaps and pie charts, I use a wide range of visual tools to make your data both accessible and visually engaging.
📈 Data Storytelling
Narrative Integration: Beyond just presenting data, I provide insights and context. Each visualization will be paired with a narrative that helps interpret the data and highlights key trends, opportunities, and actionable insights.
Contextual Data Insights: I analyze the data before visualizing it to ensure your visuals reflect not only the current state but also trends and future forecasts.
🎨 Branded Visual Design
Consistent Branding: Every visualization will align with your company’s branding, including color schemes, fonts, and logo placements, so your data tells a story consistent with your brand identity.
Interactive Dashboards: I create interactive, drill-down dashboards where you can filter data by region, time period, or other variables, giving you deeper insights into specific areas.
🔍 Data Accuracy & Precision
Data Clean-Up: I ensure the integrity of your data by cleaning and validating it before any visualization, making sure that the insights are built on reliable data.
Real-Time Data Integration: For ongoing projects, I can set up dashboards that update automatically as new data comes in, so you always have real-time insights.
📥 Exportable Reports
Exportable Dashboards: Receive your visual reports in Excel, Power BI, or PDF formats, so you can easily share them with stakeholders, teams, or clients.
Actionable Summary Reports: Along with your visuals, I will provide concise, actionable reports highlighting key findings and recommendations for strategic decisions.
💼 This Service is Ideal For:
Business Owners & Managers: Get a clear overview of your business performance, sales, and operations at a glance.
Marketing Teams: Track campaign performance, customer behavior, and lead conversion rates with visually compelling charts.
Data-Driven Executives: Make informed decisions with dynamic, easy-to-read dashboards that showcase your key business KPIs.
Financial Analysts: Visualize financial data for budgeting, forecasting, and reporting with precision and clarity.
Project Managers: Track project milestones, timelines, and deliverables with visual timelines and Gantt charts.
📁 Delivery Format:
Excel (.xlsx) Dashboards
Power BI Reports
PDF/PNG Exportable Reports
Interactive Dashboards (when applicable)
🔁 Optional Add-ons:
Real-Time Data Integration: Set up automatic data refresh and integration with live data sources (e.g., Google Analytics, CRM, databases).
Advanced Analytics: Add predictive analytics and machine learning models to your visualizations for future trend forecasting.
Consultation Call: A one-on-one call to walk you through the dashboard and its key features, ensuring you can fully utilize the tool.
Ongoing Reporting: Subscribe for regular updates and maintenance of your dashboards.
Let me turn your data into a powerful visual story that not only makes sense but drives smarter business decisions. Contact me today, and let’s bring your data to life!
What's included
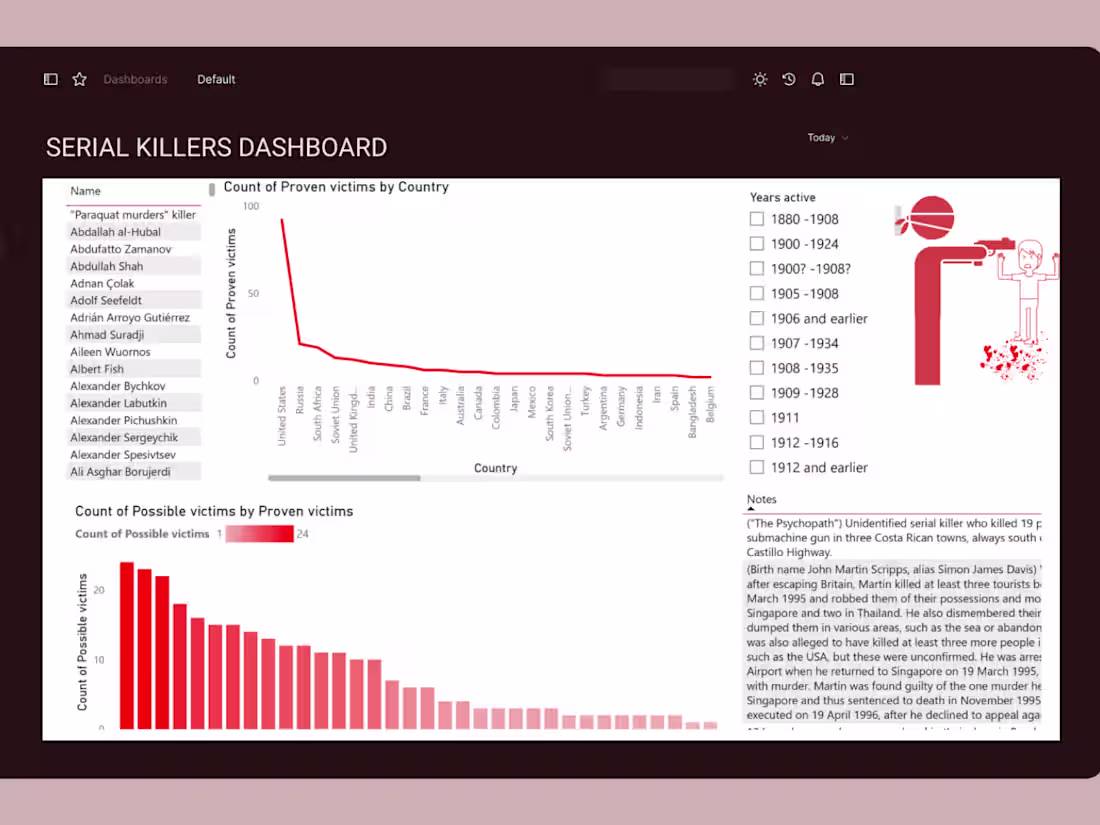
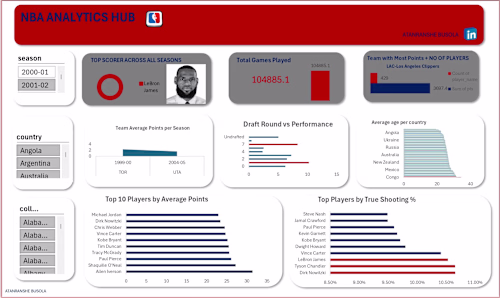
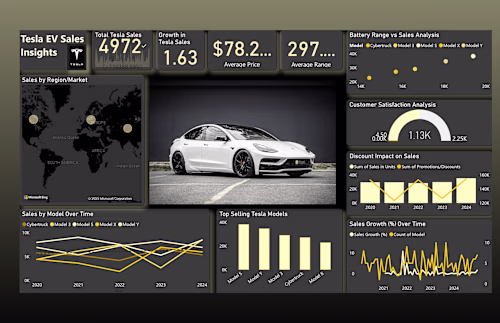
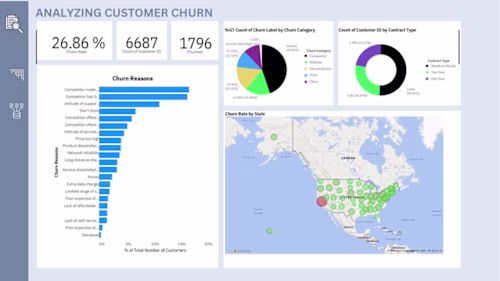
Interactive Data Visualization Dashboard
In a world overwhelmed by raw data, data visualization is the key to unlocking valuable insights and making informed decisions. As an expert in data storytelling, I specialize in transforming complex, hard-to-digest data into clear, compelling visuals that convey meaningful insights at a glance. Whether you're tracking business performance, customer behavior, or operational metrics, I craft custom visual dashboards and charts that make your data easy to understand and act upon.
Interactive Data Visualization Dashboard
By leveraging advanced Excel and Power BI, I provide rich, interactive visualizations that bring your data to life. My goal is to not just present numbers, but to turn them into a narrative that drives actionable insights and fuels decision-making. Whether you need a quick glance at your KPIs or a deep dive into your data, I’ll design visuals that capture the essence of your data in a way that resonates with both technical and non-technical audiences.
Interactive Data Visualization Dashboard
Let me help you tell your data’s story and make it more than just numbers on a page.
Starting at$300
Duration6 days
Tags
Microsoft Excel
SQL
Data Analyst
Data Visualizer
Service provided by
Atanranshe Oluwabusola Lagos, Nigeria
- 1
- Paid projects
- 5.00
- Rating
- 30
- Followers
Transform Data into Powerful Visual Stories Atanranshe Oluwabusola
📊 Custom Data Visualizations
Tailored Dashboards & Charts: Using Excel or Power BI, I will design dynamic, interactive dashboards that visually represent key metrics, KPIs, or performance data.
User-Friendly Visuals: From bar graphs and line charts to heatmaps and pie charts, I use a wide range of visual tools to make your data both accessible and visually engaging.
📈 Data Storytelling
Narrative Integration: Beyond just presenting data, I provide insights and context. Each visualization will be paired with a narrative that helps interpret the data and highlights key trends, opportunities, and actionable insights.
Contextual Data Insights: I analyze the data before visualizing it to ensure your visuals reflect not only the current state but also trends and future forecasts.
🎨 Branded Visual Design
Consistent Branding: Every visualization will align with your company’s branding, including color schemes, fonts, and logo placements, so your data tells a story consistent with your brand identity.
Interactive Dashboards: I create interactive, drill-down dashboards where you can filter data by region, time period, or other variables, giving you deeper insights into specific areas.
🔍 Data Accuracy & Precision
Data Clean-Up: I ensure the integrity of your data by cleaning and validating it before any visualization, making sure that the insights are built on reliable data.
Real-Time Data Integration: For ongoing projects, I can set up dashboards that update automatically as new data comes in, so you always have real-time insights.
📥 Exportable Reports
Exportable Dashboards: Receive your visual reports in Excel, Power BI, or PDF formats, so you can easily share them with stakeholders, teams, or clients.
Actionable Summary Reports: Along with your visuals, I will provide concise, actionable reports highlighting key findings and recommendations for strategic decisions.
💼 This Service is Ideal For:
Business Owners & Managers: Get a clear overview of your business performance, sales, and operations at a glance.
Marketing Teams: Track campaign performance, customer behavior, and lead conversion rates with visually compelling charts.
Data-Driven Executives: Make informed decisions with dynamic, easy-to-read dashboards that showcase your key business KPIs.
Financial Analysts: Visualize financial data for budgeting, forecasting, and reporting with precision and clarity.
Project Managers: Track project milestones, timelines, and deliverables with visual timelines and Gantt charts.
📁 Delivery Format:
Excel (.xlsx) Dashboards
Power BI Reports
PDF/PNG Exportable Reports
Interactive Dashboards (when applicable)
🔁 Optional Add-ons:
Real-Time Data Integration: Set up automatic data refresh and integration with live data sources (e.g., Google Analytics, CRM, databases).
Advanced Analytics: Add predictive analytics and machine learning models to your visualizations for future trend forecasting.
Consultation Call: A one-on-one call to walk you through the dashboard and its key features, ensuring you can fully utilize the tool.
Ongoing Reporting: Subscribe for regular updates and maintenance of your dashboards.
Let me turn your data into a powerful visual story that not only makes sense but drives smarter business decisions. Contact me today, and let’s bring your data to life!
What's included
Interactive Data Visualization Dashboard
In a world overwhelmed by raw data, data visualization is the key to unlocking valuable insights and making informed decisions. As an expert in data storytelling, I specialize in transforming complex, hard-to-digest data into clear, compelling visuals that convey meaningful insights at a glance. Whether you're tracking business performance, customer behavior, or operational metrics, I craft custom visual dashboards and charts that make your data easy to understand and act upon.
Interactive Data Visualization Dashboard
By leveraging advanced Excel and Power BI, I provide rich, interactive visualizations that bring your data to life. My goal is to not just present numbers, but to turn them into a narrative that drives actionable insights and fuels decision-making. Whether you need a quick glance at your KPIs or a deep dive into your data, I’ll design visuals that capture the essence of your data in a way that resonates with both technical and non-technical audiences.
Interactive Data Visualization Dashboard
Let me help you tell your data’s story and make it more than just numbers on a page.
$300