
Johnson Wairimu
Delivering Strategic Growth Through Data, Finance & Tech.
Ready for work
Johnson is ready for their next project!
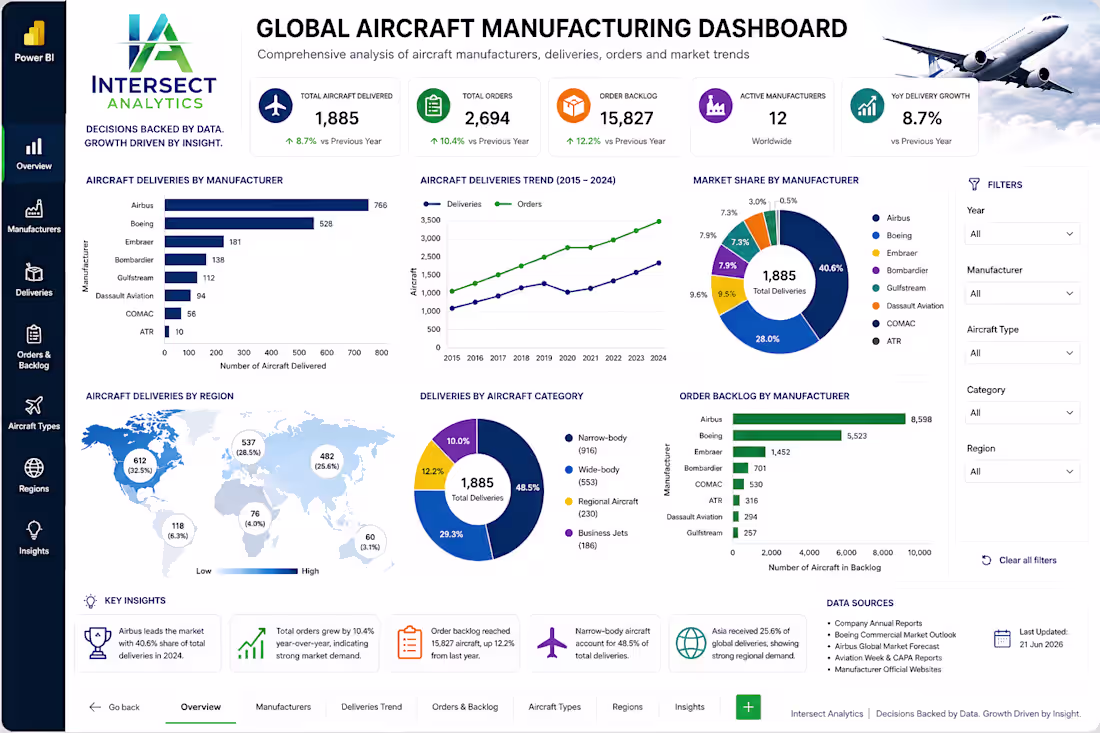
Executive Review: Global Aircraft Manufacturing Intelligence Dashboard
The Global Aircraft Manufacturing Intelligence Dashboard demonstrates how modern Business Intelligence can transform complex aviation datasets into strategic insights that support executive decision-making. By integrating production, delivery, market share, and regional performance data from leading aircraft manufacturers into a unified Power BI environment, the solution provides stakeholders with a comprehensive view of industry performance and emerging market trends.
The analysis indicates that Airbus and Boeing continue to dominate the global commercial aviation market, while manufacturers such as Embraer, Bombardier, Dassault Aviation, Gulfstream, and COMAC continue to strengthen their presence across regional, business, and emerging aviation segments. Through interactive visualizations, users can evaluate production performance, delivery trends, market distribution, and competitive positioning to better understand the evolving dynamics of the aerospace industry.
Beyond visualization, the dashboard serves as a strategic decision-support platform by enabling organizations to monitor key performance indicators, identify growth opportunities, anticipate market shifts, and improve forecasting accuracy. The ability to consolidate multiple data sources into a single, reliable reporting environment significantly reduces manual reporting effort while improving data consistency and operational visibility.
At Intersect Analytics, we specialize in designing enterprise-grade Business Intelligence solutions that convert fragmented business data into actionable intelligence. Our expertise spans Power BI Dashboard Development, Financial Analytics, Executive Reporting, SQL Data Modeling, Python Analytics, Excel Automation, Office Scripts, Power Automate, Predictive Analytics, and Data Engineering. Every solution we develop is tailored to enhance reporting efficiency, strengthen decision-making, and support long-term business growth.
Rather than simply building dashboards, we develop intelligent reporting ecosystems that enable organizations to automate reporting, improve operational performance, and make strategic decisions with confidence.
Intersect Analytics
Decisions Backed by Data. Growth Driven by Insight.
1
36
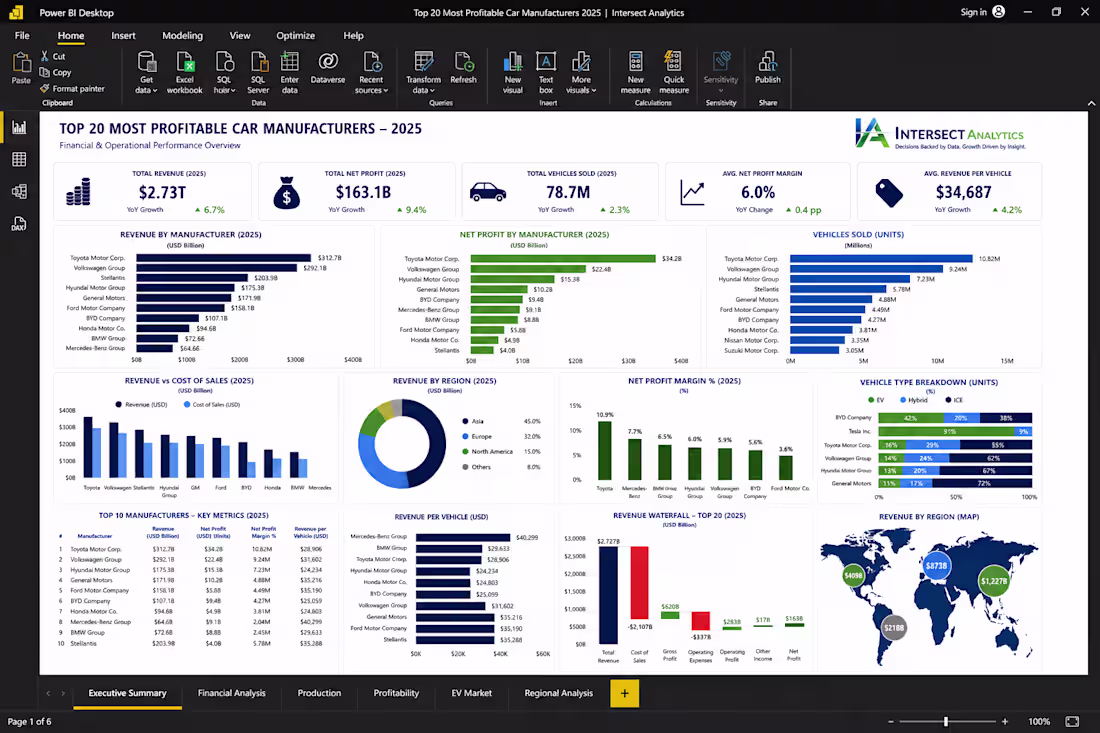
🚗 Executive Automotive Industry Intelligence — Powered by Power BI
How do the world's leading automotive manufacturers compare when it comes to revenue, profitability, production, and market performance?
At Intersect Analytics, we developed this executive Power BI dashboard to transform complex automotive industry data into a single source of truth for strategic decision-making.
📊 Executive Insights
Our analysis revealed several key industry trends:
🏆 Toyota Motor Corporation continues to lead the global automotive market, generating the highest revenue while maintaining exceptional profitability and vehicle production volumes.
📈 Volkswagen Group remains one of the strongest global competitors, demonstrating consistent revenue growth and a diversified international market presence.
⚡ BYD has emerged as one of the fastest-growing manufacturers, driven by rapid expansion in electric vehicle production and increasing global demand.
💰 While several manufacturers generate significant revenue, profit margins vary considerably, highlighting differences in operational efficiency, manufacturing costs, and pricing strategies.
🌍 Asian manufacturers continue to dominate the global automotive industry, contributing the largest share of revenue and vehicle production compared to Europe and North America.
🚘 The transition toward electric and hybrid vehicles is reshaping the competitive landscape, with manufacturers investing heavily in next-generation mobility technologies.
📉 Comparing Revenue against Cost of Sales reveals that companies with stronger cost control consistently deliver higher profitability despite operating in the same competitive environment.
📊 Revenue per vehicle varies significantly across manufacturers, reflecting differences in brand positioning, product mix, and premium versus mass-market strategies.
What This Dashboard Delivers
✔ Executive KPI Scorecards
✔ Revenue & Profitability Benchmarking
✔ Global Vehicle Sales Analysis
✔ Regional Performance Comparison
✔ Revenue vs Cost Analysis
✔ Net Profit Margin Analysis
✔ EV, Hybrid & ICE Market Breakdown
✔ Interactive Geographic Performance Mapping
✔ Executive-ready Multi-page Reporting
Our Services
At Intersect Analytics, we help organizations transform raw business data into executive intelligence through:
✅ Power BI Dashboard Development
✅ Financial Analytics & Executive Reporting
✅ Business Intelligence Solutions
✅ Excel & Google Sheets Automation
✅ SQL Data Modeling & ETL
✅ Power Query & DAX Optimization
✅ KPI Scorecards & Performance Monitoring
✅ Predictive Analytics & Decision Support
Every dashboard we build is designed to help leaders move beyond reporting—to uncover trends, optimize performance, and make confident, data-driven decisions.
📊 Decisions Backed by Data. Growth Driven by Insight.
If your organization is ready to unlock the full potential of its data, let's build a solution tailored to your business.
0
20
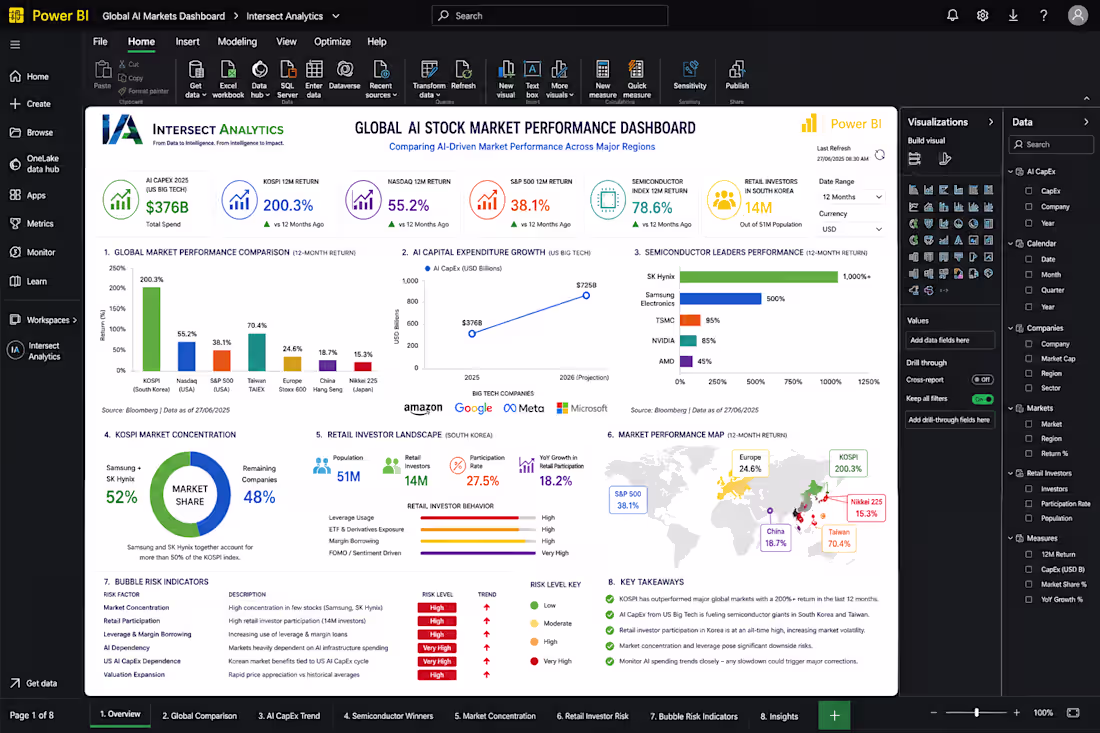
📊 GLOBAL AI STOCK MARKET PERFORMANCE DASHBOARD
Artificial Intelligence is no longer influencing individual companies alone — it is reshaping entire financial markets.
At Intersect Analytics, we developed this interactive Global AI Stock Market Performance Dashboard to analyze how AI investment is driving market performance across the United States, South Korea, Taiwan, Europe, China, and Japan.
Our analysis highlights several key findings:
✅ South Korea's KOSPI significantly outperformed many major global markets, driven largely by AI-related semiconductor companies.
✅ Massive AI capital expenditure by major US technology companies continues to fuel global semiconductor demand.
✅ Market concentration risk is increasing, with a small number of companies accounting for a significant share of market performance.
✅ Retail investor participation has reached historic levels in some markets, increasing both opportunity and risk.
✅ AI infrastructure spending is becoming one of the strongest drivers of global equity markets.
How We Built This Solution
This dashboard was developed using a complete Business Intelligence workflow:
• Data collection and market research
• Data transformation and modeling
• Power Query data preparation
• DAX calculations and performance measures
• KPI development and financial analysis
• Geographic and market visualization
• Risk assessment and investment analysis
• Executive dashboard design in Power BI
Services Delivered by Intersect Analytics
📈 Power BI Dashboard Development
📊 Financial & Market Analytics
🤖 Business Intelligence Solutions
⚙️ Data Modeling & Automation
📉 Executive Reporting & KPI Design
🗄️ Power Query & DAX Optimization
🌍 Economic & Market Intelligence Dashboards
☁️ Data Integration & Analytics Infrastructure
At Intersect Analytics, we help businesses, investors, and organizations transform complex data into clear insights that support better decisions.
DECISIONS BACKED BY DATA.
GROWTH DRIVEN BY INSIGHT.
#PowerBI #BusinessIntelligence #DataAnalytics #FinancialAnalytics #ArtificialIntelligence #StockMarket #DashboardDesign #DataVisualization #InvestmentAnalytics #BusinessGrowth
0
24
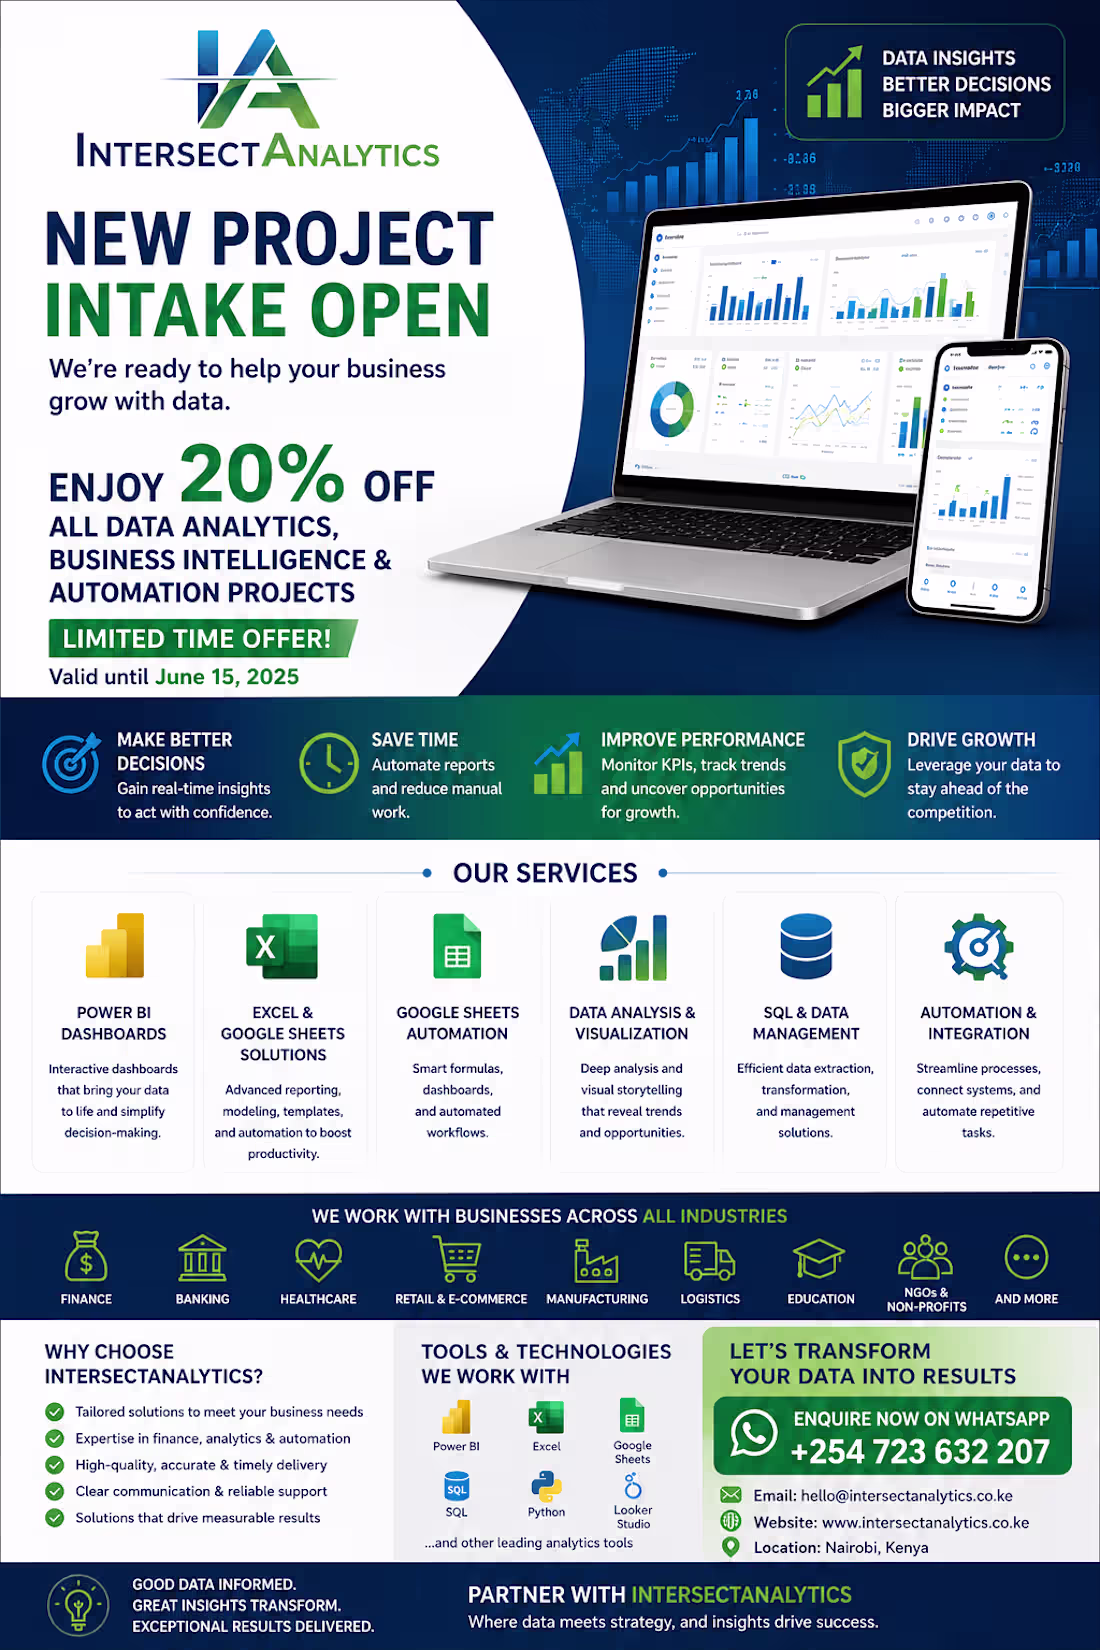
🚀 NEW PROJECT INTAKE OPEN | 20% OFF UNTIL JUNE 15
Every business generates data. The difference between industry leaders and everyone else is what they do with it.
At Intersect Analytics, we help organizations save time, eliminate manual reporting, automate repetitive processes, and turn data into actionable business intelligence that drives growth.
Our services include:
📊 Power BI Dashboards & Business Intelligence
📈 Data Analytics & Visualization
⚙️ Excel & Google Sheets Automation
🐍 Python Data Extraction & Preparation
🗄️ SQL & Database Solutions
🔄 Business Process Automation
Whether your business is just beginning its analytics journey or already has reporting systems in place, we help unlock greater value through smarter automation, better insights, and more efficient decision-making.
✅ Reduce reporting time
✅ Improve operational efficiency
✅ Monitor KPIs in real time
✅ Make faster, data-driven decisions
✅ Focus more time on growth and strategy
🎉 Enjoy 20% OFF all Data Analytics, Business Intelligence, and Automation projects until June 15.
📱 WhatsApp: +254 723 632 207
INTERSECT ANALYTICS
Decisions Backed by Data. Growth Driven by Insight.
0
33
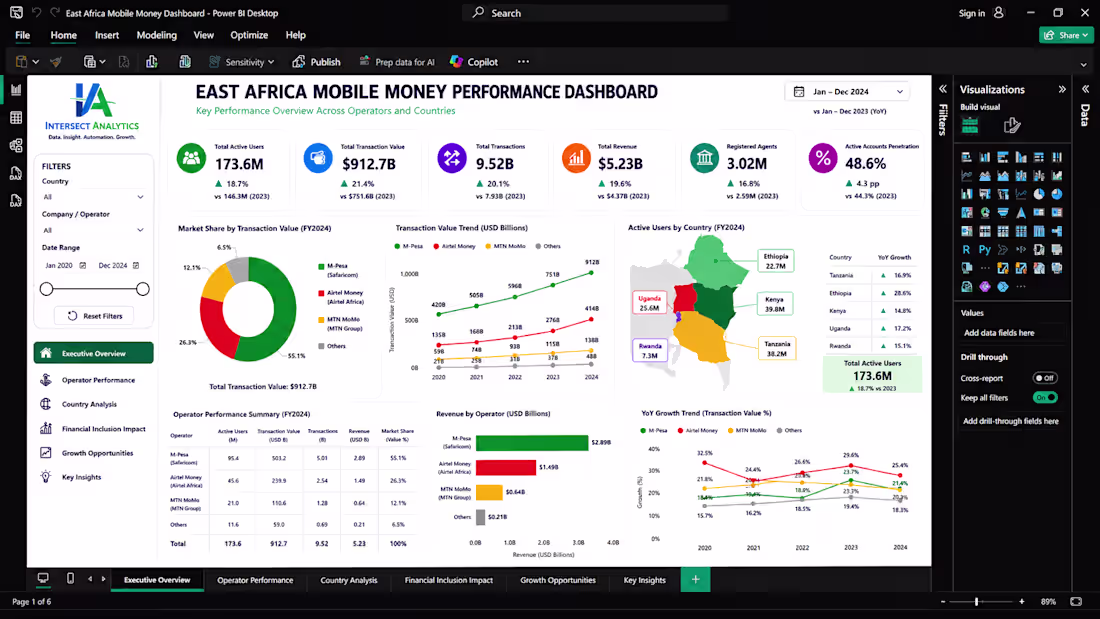
East Africa Mobile Money Performance Analysis Dashboard
Prepared by Intersect Analytics | Power BI, Data Analytics & Business Intelligence
Mobile money continues to reshape financial inclusion, digital payments, and economic activity across East Africa. To evaluate the performance of the region's leading operators, Intersect Analytics developed an executive-level Power BI dashboard analyzing transaction activity, user adoption, market share, and growth trends across key markets.
Key Findings
M-Pesa Maintains Regional Leadership
M-Pesa remains the dominant mobile money platform, leading in transaction volumes, active users, and market penetration. Its extensive ecosystem continues to strengthen its competitive position across the region.
Airtel Money Continues to Gain Momentum
Airtel Money has demonstrated strong growth, driven by increasing customer adoption, expanding service offerings, and rising transaction activity across multiple markets.
Digital Financial Services Are Experiencing Sustained Growth
The continued increase in mobile money usage highlights the growing importance of digital financial services in facilitating payments, commerce, savings, remittances, and financial accessibility.
East Africa Remains a High-Growth Market
Kenya, Uganda, Tanzania, Rwanda, and Ethiopia continue to present significant opportunities for financial institutions, fintech companies, investors, and businesses operating within the digital payments ecosystem.
Development Approach
Data was collected from industry publications, operator reports, and financial inclusion research.
Python was utilized for data extraction, cleaning, validation, and preparation using:
• Pandas
• NumPy
• Requests
• BeautifulSoup
• OpenPyXL
The final solution was developed in Power BI using Power Query, Data Modeling, DAX, and interactive visualizations to deliver clear, actionable insights for decision-makers.
Our Services
📊 Power BI Dashboards & Business Intelligence
📈 Financial Analysis & Performance Reporting
🐍 Data Scraping, Cleaning & Preparation
⚙️ Excel & Google Sheets Automation
🗄️ SQL & Database Analytics
🔄 Business Process Automation
Why Organizations Choose Intersect Analytics
We help organizations transform complex data into meaningful business intelligence by combining analytics, automation, and reporting expertise. Our solutions are designed to reduce manual effort, improve operational efficiency, accelerate decision-making, and provide the visibility required to support sustainable growth.
INTERSECT ANALYTICS
Power BI | Business Intelligence | Data Analytics | Automation | Financial Analysis
Decisions Backed by Data. Growth Driven by Insight.
📞 +254 723 632 207
5
242
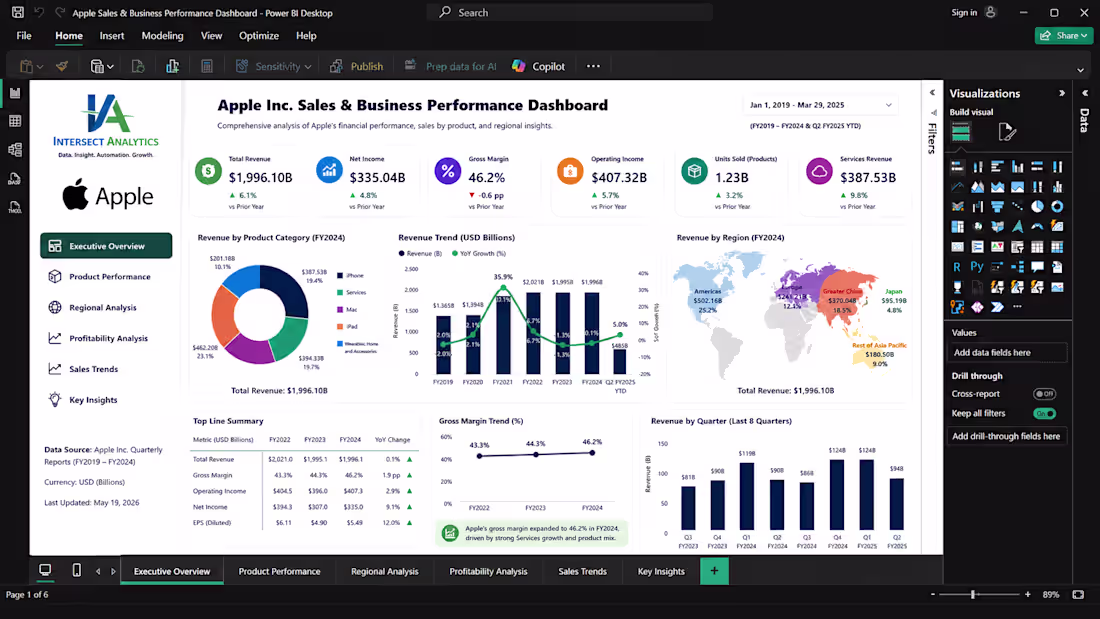
Apple’s Performance Is Not Built on Products Alone. It Is Built on Systems, Diversification, and Intelligent Decisions.
At Intersect Analytics, we scraped, transformed, and analyzed Apple Inc.’s sales and financial performance data using Python and Power BI to understand what drives one of the world’s most valuable companies.
The findings reveal an important lesson for every business:
Growth becomes sustainable when performance is measurable.
Key Findings From Apple’s Performance Analysis
📱 iPhone Continues Leading Revenue Generation
Apple’s iPhone business remains the company’s strongest revenue engine, demonstrating the importance of maintaining a strong core product while continuously innovating.
☁️ Services Revenue Continues Growing Rapidly
Subscription services, cloud ecosystems, and recurring revenue streams continue strengthening profitability and long-term business resilience.
🌍 Regional Diversification Reduces Risk
Apple’s strong performance across multiple global markets highlights the value of diversification in protecting businesses from overreliance on one market or customer segment.
📈 Strong Margins Reflect Operational Discipline
Sustained profitability demonstrates the importance of operational efficiency, cost management, and strategic investment.
📊 Performance Visibility Drives Better Decisions
Apple’s ability to track performance across products, regions, and financial metrics reinforces a simple reality:
What gets measured gets improved.
How We Built the Analysis
🐍 Python for Data Scraping & Transformation
📊 Power BI for Interactive Dashboard Development
📈 Business Performance & Financial Analytics
⚙️ Automated Reporting & KPI Monitoring
What This Means for Businesses
Most businesses are sitting on valuable data but spend too much time:
❌ Updating spreadsheets manually
❌ Preparing repetitive reports
❌ Chasing numbers across systems
❌ Making decisions with incomplete information
At Intersect Analytics, we help businesses turn raw data into automated dashboards, smarter reporting systems, and faster decision-making tools.
Our Services
✔ Power BI Dashboards & Business Intelligence
✔ Excel & Google Sheets Automation
✔ Python Data Analysis & Automation
✔ Financial Analysis & KPI Reporting
✔ SQL & Database Analytics
✔ Workflow Automation & Reporting Systems
Because successful businesses are not built by working harder alone.
They grow by building systems that save time, improve decisions, and scale performance.
INTERSECT ANALYTICS
Power BI | Automation | Financial Analysis | Business Intelligence
Decisions Backed by Data. Growth Driven by Insight.
📞 +254 723 632 207
1
72
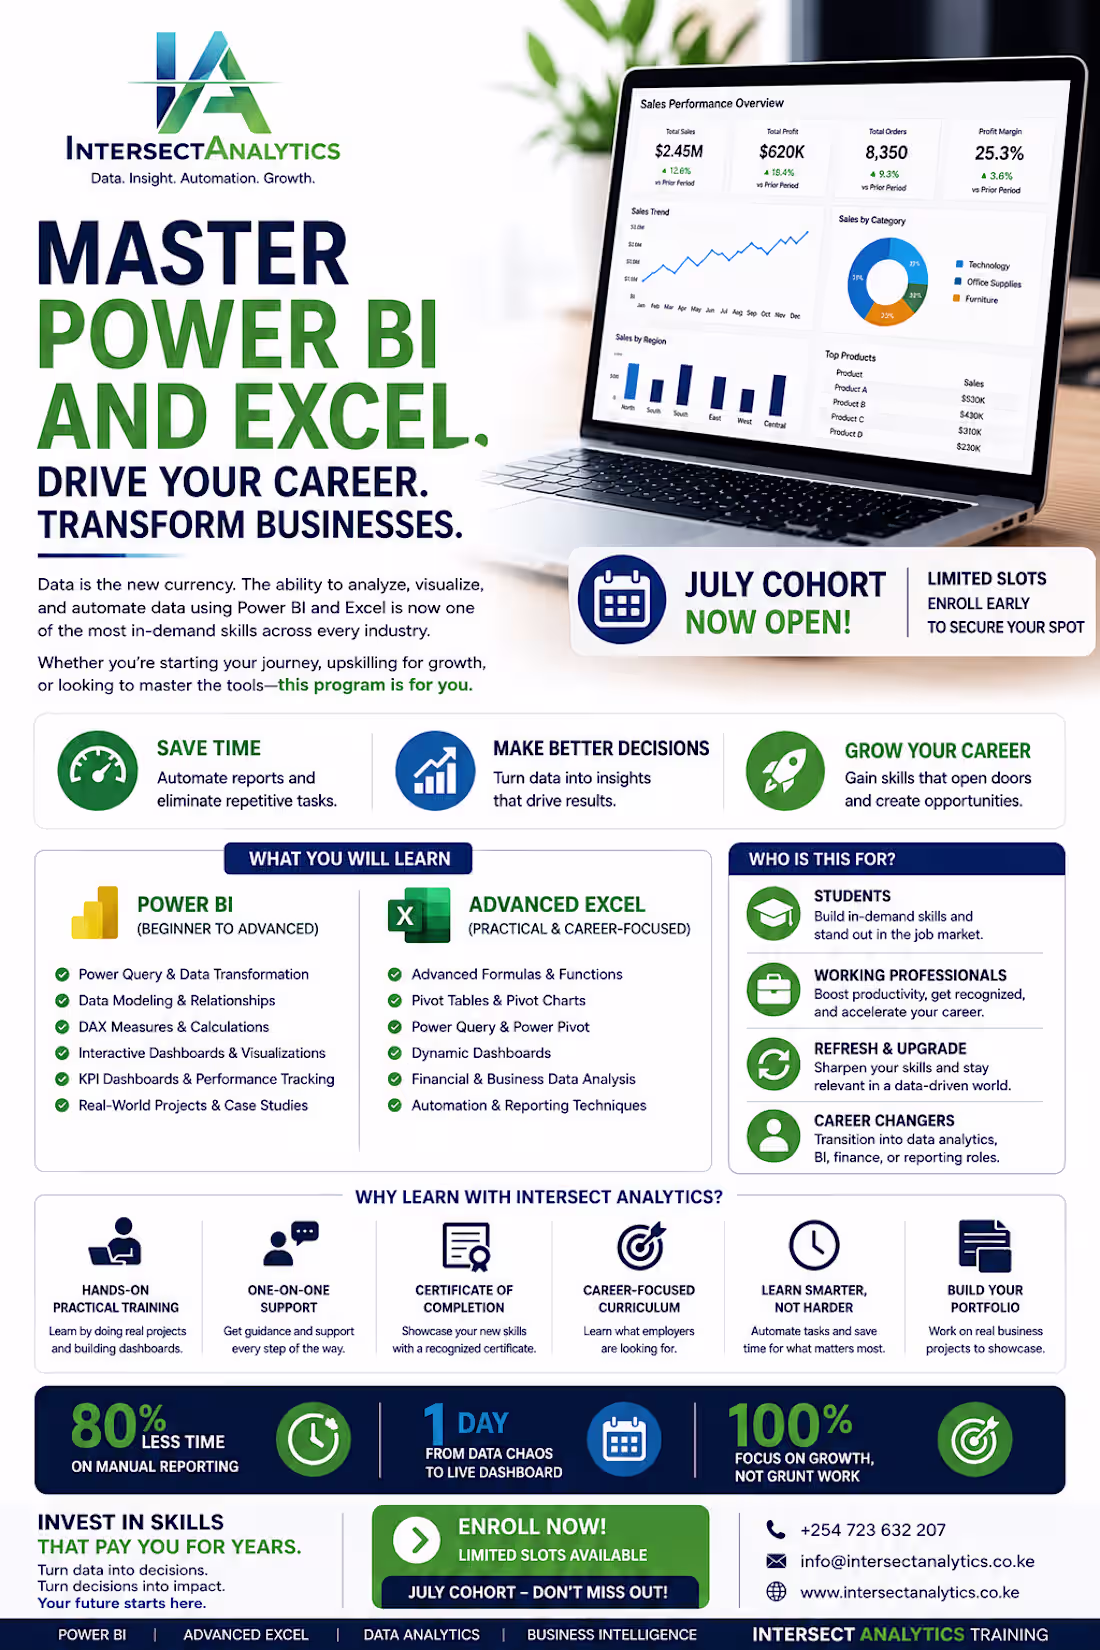
🚀 JULY COHORT NOW OPEN | POWER BI & ADVANCED EXCEL TRAINING
Looking to sharpen your skills, grow your career, or master modern reporting and analytics tools?
We are officially enrolling for our July Cohort in Power BI & Advanced Excel Training designed for:
🎓 Students looking to build in-demand skills
💼 Working professionals seeking career growth or promotion
📊 Finance, HR, Operations & Business professionals handling reports
🔄 Anyone looking for a refresher or mastery in Excel & Power BI
🚀 Career changers transitioning into Data Analytics & Business Intelligence
What You Will Learn
✔ Power BI Dashboards & Data Visualization
✔ Power Query & Data Transformation
✔ DAX Calculations & KPIs
✔ Advanced Excel Formulas & Functions
✔ Pivot Tables, Power Pivot & Dashboards
✔ Reporting Automation & Real-World Business Projects
✅ Practical & Hands-On Training
✅ Beginner to Advanced Friendly
✅ Real Projects for Your Portfolio
✅ Career-Focused Learning
📅 July Intake Ongoing | Limited Slots Available
👉 Register here:
https://lnkd.in/euWk3AQ8
(https://lnkd.in/euWk3AQ8)Master Power BI & Excel. Drive Your Career. Transform Businesses.
📞 +254 723 632 207
1
55
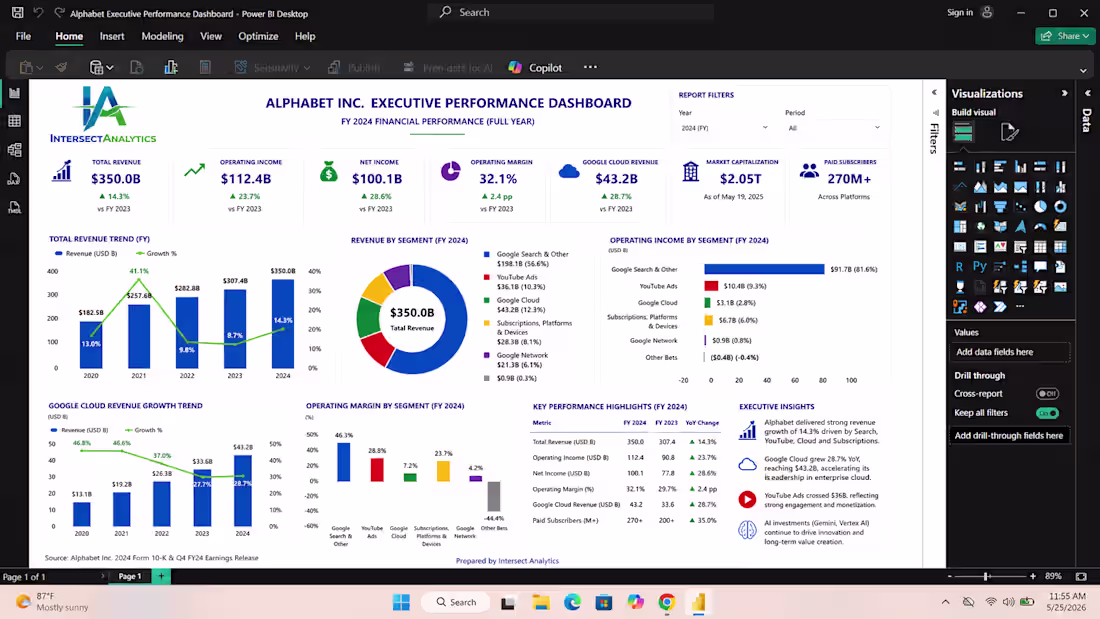
Alphabet Performance Analysis: What Business Leaders Can Learn From One of the World’s Most Successful Companies
Prepared by Intersect Analytics | Business Intelligence, Financial Analysis & Automation
Prepared by Intersect Analytics
At Intersect Analytics, we analyzed Alphabet Inc.’s financial and operational performance using Python for data extraction and transformation and Power BI for dashboard development to understand how business segments contribute to growth, profitability, and long-term performance.
Key Findings
Google Search Remains the Core Revenue Driver
Google Search & Other continues contributing the largest share of Alphabet’s revenue, maintaining its leadership in digital advertising and search services.
Google Cloud Continues Strong Growth
Google Cloud remains one of Alphabet’s fastest-growing business segments, supported by increased enterprise demand, AI adoption, and cloud infrastructure expansion.
YouTube Strengthens Revenue Performance
YouTube continues generating strong advertising revenue, reinforcing Alphabet’s ability to monetize digital engagement at scale.
Profitability Remains Strong
Despite major investments in AI, cloud infrastructure, and innovation, Alphabet continues maintaining strong operational performance and financial resilience.
Diversified Revenue Supports Stability
Alphabet benefits from multiple business segments across Search, Cloud, YouTube, Devices, and Emerging Ventures, strengthening resilience and reducing dependency on a single revenue source.
Recommendations
✔ Improve performance visibility through real-time dashboards and KPI tracking.
✔ Invest strategically in high-performing business segments.
✔ Use automation and analytics to improve reporting speed and decision-making.
✔ Strengthen operational monitoring to identify inefficiencies early.
How Intersect Analytics Helps Businesses
We help organizations transform manual reporting into intelligent business systems through:
📊 Power BI Dashboards & Business Intelligence
📈 Financial Analysis & Performance Reporting
🐍 Python Data Scraping & Automation
⚙️ Excel & Google Sheets Automation
🔄 Business Process Automation
📉 Data Analytics & Strategic Insights
Why Choose Intersect Analytics
✅ Business-focused solutions
✅ Executive-quality dashboards
✅ Automation-driven reporting
✅ Scalable analytics systems
Because growth is driven by better visibility, faster decisions, and intelligent execution.
INTERSECT ANALYTICS
Decisions Backed by Data. Growth Driven by Insight.
📞 +254 723 632 207
1
2
72
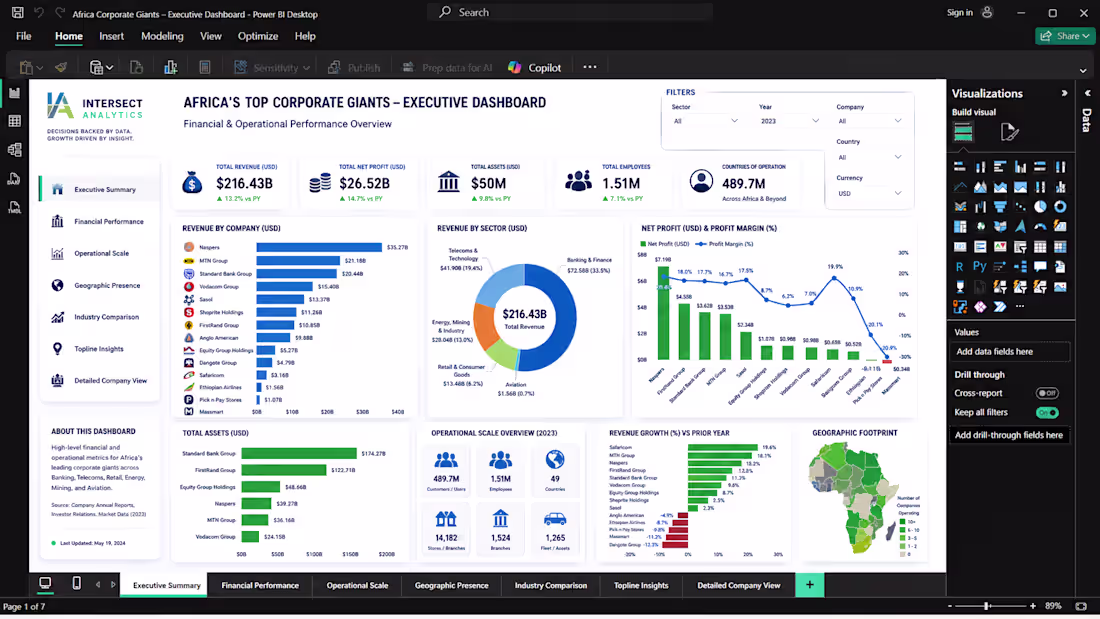
Africa’s corporate growth story is being shaped by a few powerful giants. But what truly drives performance across industries?
At Intersect Analytics, we wanted to answer that question.
So we scraped, structured, transformed, and analyzed real-world corporate data using Python, then developed an executive-level Power BI dashboard to uncover the performance drivers behind some of Africa’s most influential companies across:
🏦 Banking & Finance
📡 Telecoms & Technology
🛒 Retail & Consumer Goods
🛢️ Energy, Mining & Industry
✈️ Aviation
What did we uncover?
📈 Banking & Telecoms continue to dominate revenue generation
Large financial institutions and telecom operators remain the backbone of Africa’s corporate economy, driven by scale, customer reach, and digital expansion.
🌍 Geographic presence matters
Organizations operating across multiple countries demonstrate stronger resilience, diversified revenue streams, and greater long-term scalability.
📱 Technology-enabled businesses outperform
Companies leveraging digital ecosystems, mobile platforms, and customer connectivity continue creating stronger operational efficiencies and customer growth.
⚙️ Operational scale is a competitive advantage
Whether measured through customer base, branch networks, stores, subscribers, or infrastructure, scale continues separating market leaders from followers.
📊 Executive visibility drives better decisions
Complex business environments require more than spreadsheets. Leaders need real-time visibility into revenue, profitability, operations, geographic performance, and growth trends.
How we built it
Using Python, we scraped and consolidated multi-source corporate data, cleaned and transformed datasets, standardized financial and operational KPIs, and prepared a robust analytics model.
Using Power BI, we transformed complexity into an interactive executive dashboard designed for decision-makers.
The result?
A dashboard that answers:
✔️ What drives growth?
✔️ Which sectors outperform?
✔️ Where are risks and opportunities emerging?
✔️ What operational metrics matter most?
What we do at Intersect Analytics
We help organizations turn fragmented business information into decision-ready intelligence through:
📊 Power BI Executive Dashboards
🐍 Python Data Scraping & Automation
⚙️ Excel & Google Sheets Automation
📈 Financial Analysis & Forecasting
🗄️ Business Intelligence & KPI Reporting
Because growth becomes easier when leaders can see clearly.
DECISIONS BACKED BY DATA.
GROWTH DRIVEN BY INSIGHT.
📱 WhatsApp: +254 723 632 207
#PowerBI #Python #BusinessIntelligence #DataAnalytics #ExecutiveDashboard #Automation #DigitalTransformation #BusinessGrowth
1
2
110
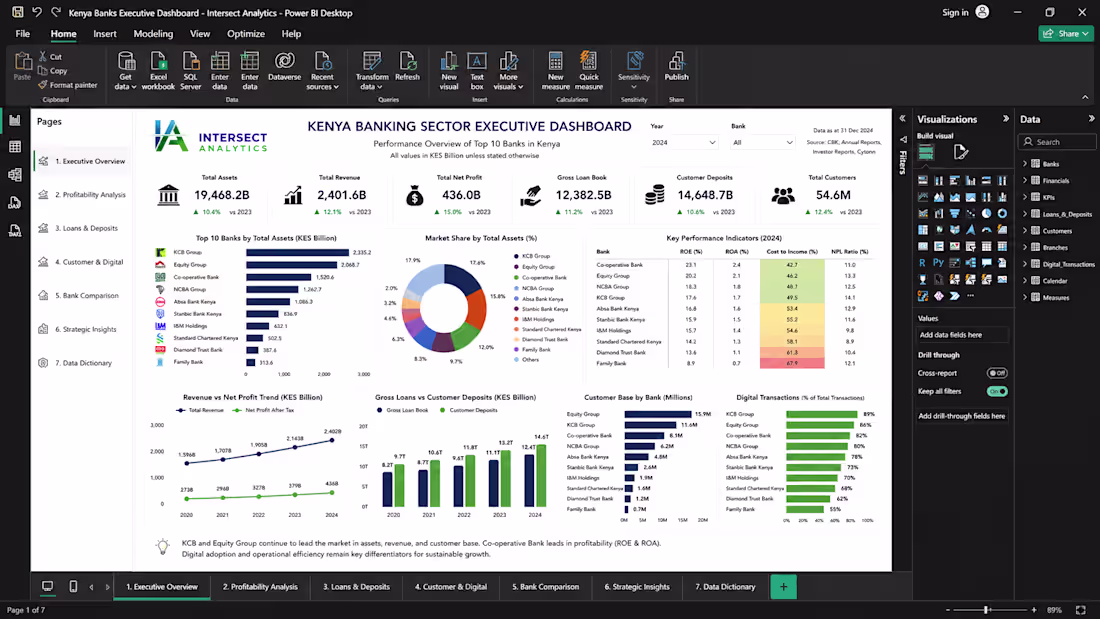
Executive Summary — Kenya Banking Sector Dashboard
At Intersect Analytics, we analyzed Kenya’s top-performing banks to uncover trends in profitability, growth, customer expansion, lending, and operational performance.
Using Power BI and advanced financial analytics, we transformed complex banking data into an executive dashboard that supports faster, smarter, and data-driven decision-making.
Key Insights
1. Market Leadership Remains Concentrated
KCB Group and Equity Group continue leading in assets, customer base, loan book, and revenue, reinforcing their dominance in Kenya’s banking sector.
2. Profitability Is Not Driven by Size Alone
Banks such as Co-operative Bank and NCBA demonstrate strong profitability and operational efficiency, proving that strategic execution matters as much as scale.
3. Digital Banking Is a Competitive Advantage
Banks with stronger digital transaction capabilities continue outperforming peers in customer engagement, scalability, and operational efficiency.
4. Lending & Deposit Growth Continue Driving Expansion
Strong customer deposits and healthy loan books remain major indicators of sector growth and long-term sustainability.
Why Executive Dashboards Matter
Leadership teams do not need more spreadsheets.
They need clear, decision-ready insights.
Executive dashboards help answer:
✔️ What changed?
✔️ What matters most?
✔️ Where is risk emerging?
✔️ What action should leadership take?
How Intersect Analytics Helps Businesses
We help organizations transform manual reporting into intelligent decision systems through:
📊 Power BI Executive Dashboards
📈 Financial Analysis & Forecasting
⚙️ Excel, Google Sheets & Workflow Automation
🗄️ Business Intelligence & Data Analytics
🔍 KPI Tracking & Executive Reporting
Why Choose Intersect Analytics?
✅ Executive-focused dashboards
✅ Clean, decision-driven reporting
✅ Automation that saves time
✅ Strategic insights for growth
We build solutions that help leaders understand faster, decide smarter, and grow confidently.
DECISIONS BACKED BY DATA.
GROWTH DRIVEN BY INSIGHT.
📱 WhatsApp: +254 723 632 207
0
17
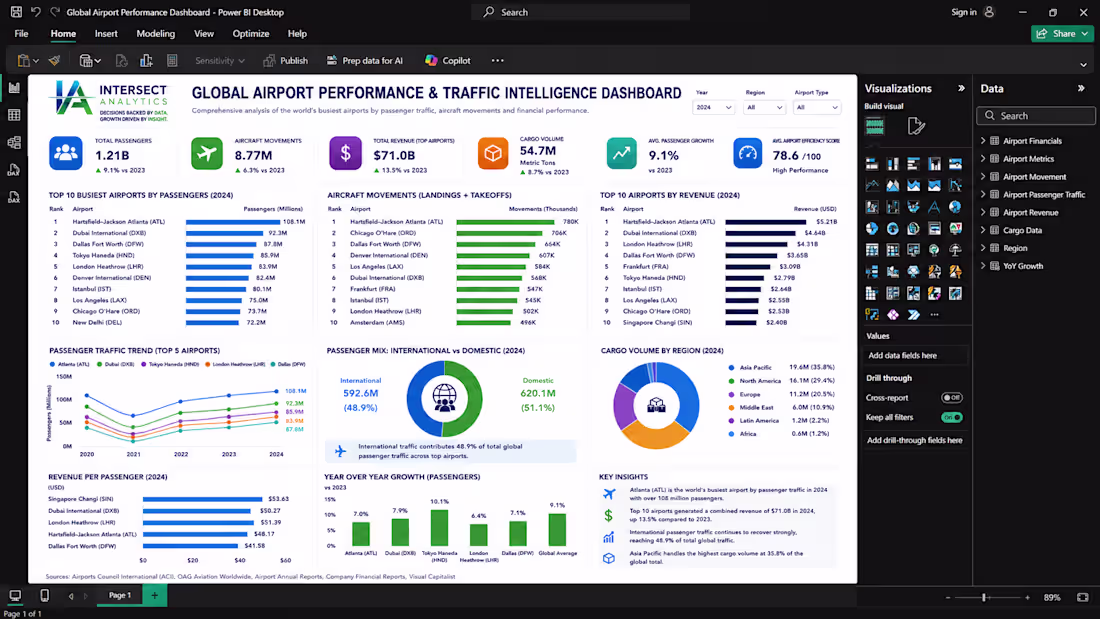
📊 What can the world’s busiest airports teach us about performance, efficiency, and growth?
We recently conducted a quick Power BI analysis of global airport performance, using aviation traffic and airport intelligence data to uncover trends shaping the future of global travel, logistics, and infrastructure.
The goal was simple:
Turn complex aviation data into actionable business insights.
Key Findings from the Dashboard:
✈️ Atlanta (ATL) remained the world’s busiest airport, handling over 108M passengers, reaffirming its dominance as a major global aviation hub.
🌍 Dubai International (DXB) continued leading international travel, highlighting the increasing importance of strategic connectivity across Europe, Asia, and Africa.
📈 Global aviation has experienced strong recovery, with passenger traffic surpassing pre-pandemic levels as tourism and business travel continue rebounding.
🛬 Airports such as Chicago O’Hare, Dallas Fort Worth, and Atlanta recorded exceptionally high aircraft movements, demonstrating strong operational efficiency and infrastructure capacity.
📦 Cargo operations continue emerging as a major revenue driver, particularly across Asia-Pacific and international logistics corridors.
💡 The biggest takeaway?
The strongest-performing airports are not succeeding because of passenger numbers alone.
They are winning through:
✅ Operational efficiency
✅ Smart infrastructure utilization
✅ Global connectivity
✅ Revenue diversification
✅ Data-driven strategic planning
This is exactly where business intelligence and analytics create value.
At Intersect Analytics, we help organizations transform raw data into executive dashboards, automation systems, KPI tracking, and actionable insights using Power BI, SQL, Python, Excel, Google Sheets, AI automation, and advanced analytics tools.
Whether it is finance, logistics, healthcare, retail, aviation, or operations, we help businesses make smarter, faster, and more informed decisions.
Because growth happens when data becomes strategy.
DECISIONS BACKED BY DATA.
GROWTH DRIVEN BY INSIGHT.
📱 WhatsApp: +254 723 632 207
#DataAnalytics #BusinessIntelligence #PowerBI #DashboardDesign #DataVisualization #Automation #AviationAnalytics #AirportAnalytics #DigitalTransformation #BusinessGrowth
0
25
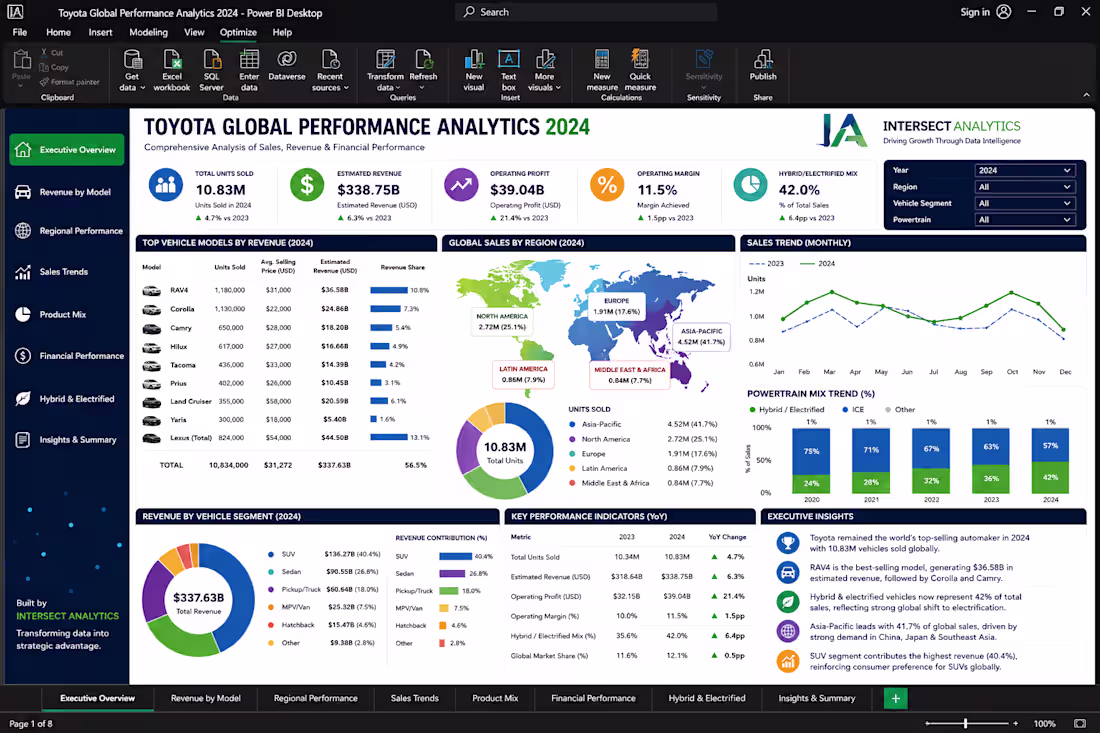
📊 Toyota Global Performance Dashboard — Quick Analysis by Intersect Analytics
We recently came across Toyota’s global automotive data and carried out a quick Power BI-driven business intelligence analysis to uncover the trends driving performance, revenue, and market dominance.
Key Findings:
🚗 RAV4 emerged as a major revenue driver, reinforcing the growing dominance of SUVs in the global automotive market.
🌍 Asia-Pacific remains Toyota’s strongest-performing region, contributing the largest share of global vehicle sales and market influence.
⚡ Hybrid & electrified vehicles continue gaining momentum, signaling a strong transition toward sustainable and future-focused mobility.
📈 Toyota maintained impressive global sales performance, with a small number of flagship models driving a significant share of total revenue.
💡 What does this tell us?
The businesses leading today are not necessarily those with the most data — but those that understand how to use it strategically.
At Intersect Analytics, we specialize in transforming raw business data into strategic insights, executive dashboards, automation systems, and business intelligence solutions that improve decision-making and unlock growth opportunities.
Our services include:
✅ Power BI Dashboard Development
✅ Business Intelligence & Data Analytics
✅ Workflow Automation Across Multiple Platforms
✅ Financial, Sales & Operational Analytics
✅ Executive Reporting & KPI Tracking
✅ SQL, Python, Excel & Cloud Analytics Solutions
✅ AI-Powered Reporting & Predictive Insights
Whether you operate in finance, logistics, healthcare, retail, manufacturing, or e-commerce, we help organizations transform complexity into clarity through data visualization, automation, and advanced analytics.
Because data alone does not create growth.
Insights do.
DECISIONS BACKED BY DATA.
GROWTH DRIVEN BY INSIGHT.
📱 WhatsApp: +254 723 632 207
#DataAnalytics #BusinessIntelligence #PowerBI #DashboardDesign #Automation #FinancialAnalytics #SQL #DataVisualization #AI #DigitalTransformation #Toyota #BusinessGrowth
0
20
Most businesses are surrounded by data.
Very few are using it strategically.
At Intersect Analytics, we help businesses transform raw data into actionable insights through advanced analytics, intelligent dashboards, automation, and AI-powered business solutions.
📊 Power BI Dashboards
📈 Business Intelligence
⚙️ Workflow Automation
🤖 AI-Powered Analytics
📉 Financial & Operational Reporting
🔍 KPI Tracking & Predictive Insights
Because better data leads to better decisions — and better decisions drive growth.
📱 WhatsApp: +254 723 632 207
#DataAnalytics #BusinessIntelligence #PowerBI #Automation #DashboardDesign #AI #DataVisualization #BusinessGrowth #SQL #DigitalTransformation
0
26
Is your data a silent asset or a missed opportunity? 📊
Most businesses are sitting on a goldmine of information but lack the shovel to dig. If you are still manually updating spreadsheets, you aren’t just losing time—you are losing the strategic edge required to scale.
At Intersect Analytics, we believe a chart without a strategy is just a picture. We don’t just "create visuals"; we engineer data-driven ecosystems that act as a roadmap for your business growth. By bridging the gap between raw numbers and executive decisions, we help you identify hidden revenue leaks and untapped market opportunities.
How We Drive Your Growth:
Strategic Automation: We replace tedious manual entry with intelligent VBA macros and Google Apps Scripts, allowing your team to focus on high-value strategy rather than data maintenance.
Actionable Business Intelligence: Our Power BI and Tableau environments are built to answer "Why?" and "What’s next?", not just "What happened?"
Clean Data Architecture: We transform fragmented, messy datasets into a single source of truth, ensuring every decision you make is backed by accurate, structured information.
Your data has a story to tell about your future growth. Are you listening? 🚀
Don't leave your business strategy to guesswork. Let's build a framework that scales with you.
📩 DM for a high-level strategic consultation or connect directly via WhatsApp: +254723632207.
#DataStrategy #BusinessGrowth #PowerBI #ExcelAutomation #KenyaTech #IntersectAnalytics #DataDrivenDecisionMaking
0
19
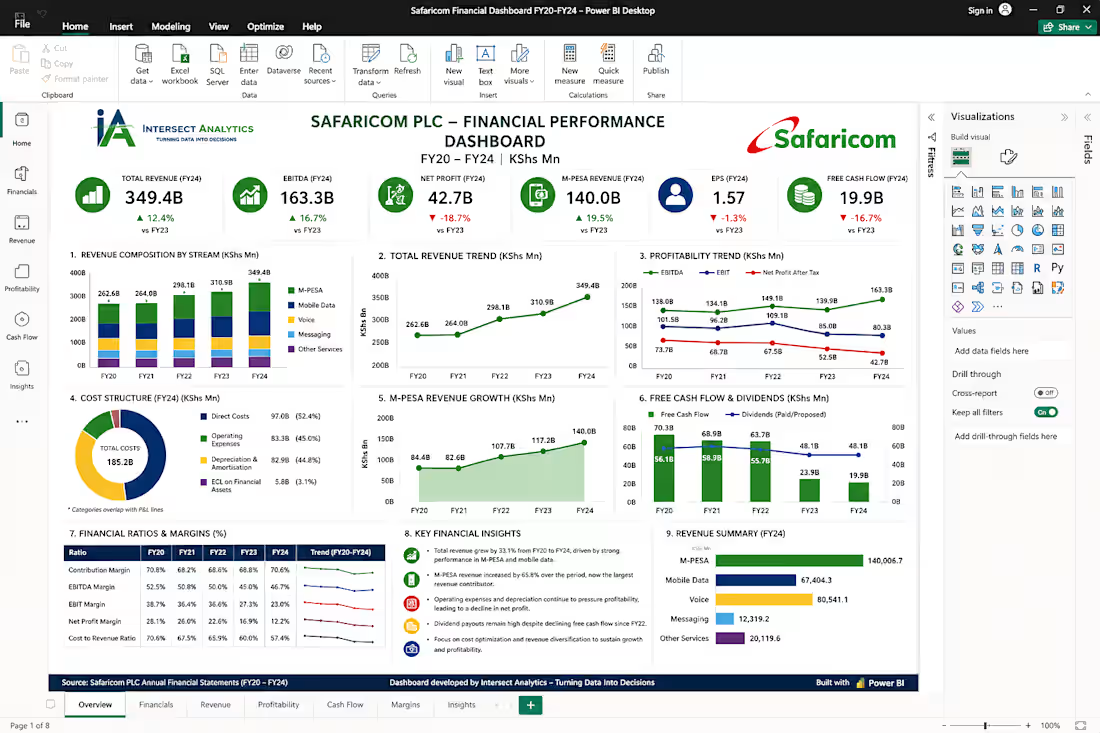
Safaricom Financial Performance Dashboard (FY20–FY24): Key Insights & Business Impact
The Safaricom Financial Dashboard provides a clear, data-driven view of performance over five years, highlighting both growth opportunities and critical financial pressures.
🔍 Key Findings
Strong Revenue Growth: Total revenue shows consistent growth, driven by digital transformation.
M-PESA Dominance: M-PESA has emerged as the largest revenue contributor, reinforcing its role as a core growth engine.
Mobile Data Expansion: Sustained growth in mobile data reflects increasing demand for digital services.
Decline in Traditional Revenue: Voice and messaging revenues continue to decline, signaling a shift in customer behavior.
Margin Pressure: Rising operating costs, direct costs, and ECL provisions are compressing profitability.
Profitability Decline: Net profit has decreased despite revenue growth—highlighting inefficiencies.
Cash Flow Concerns: Declining free cash flow indicates increasing capital demands.
High Dividend Payouts: Continued strong dividends despite cash flow pressure raise sustainability questions.
🚀 What This Means for Businesses
Growth alone is not enough — cost optimization and efficiency are critical
Businesses must track performance beyond revenue to understand true profitability
Real-time insights are essential to respond quickly to financial risks and opportunities
💼 How Intersect Analytics Adds Value
At Intersect Analytics, we go beyond dashboards — we deliver decision intelligence.
📊 Financial Analytics Expertise
Deep understanding of financial metrics, KPIs, and business drivers
⚙️ Custom Power BI Dashboards
Interactive, scalable dashboards tailored to your business needs
🔗 Data Integration & Automation
Seamless connection of multiple data sources with automated reporting
📈 Insight-Driven Decision Making
We don’t just show data — we explain the “why” behind it
🧠 Strategic Approach
Combining finance, analytics, and business strategy for real impact
✅ Why Choose Intersect Analytics
Proven experience in financial analytics & dashboard development
Solutions designed for clarity, scalability, and performance tracking
Strong focus on business impact — not just visuals
Reliable partner for end-to-end analytics and continuous support
📩 Looking to transform your financial data into actionable insights?
Let Intersect Analytics build a powerful, intelligent dashboard that drives smarter decisions and business growth.
1
1
42
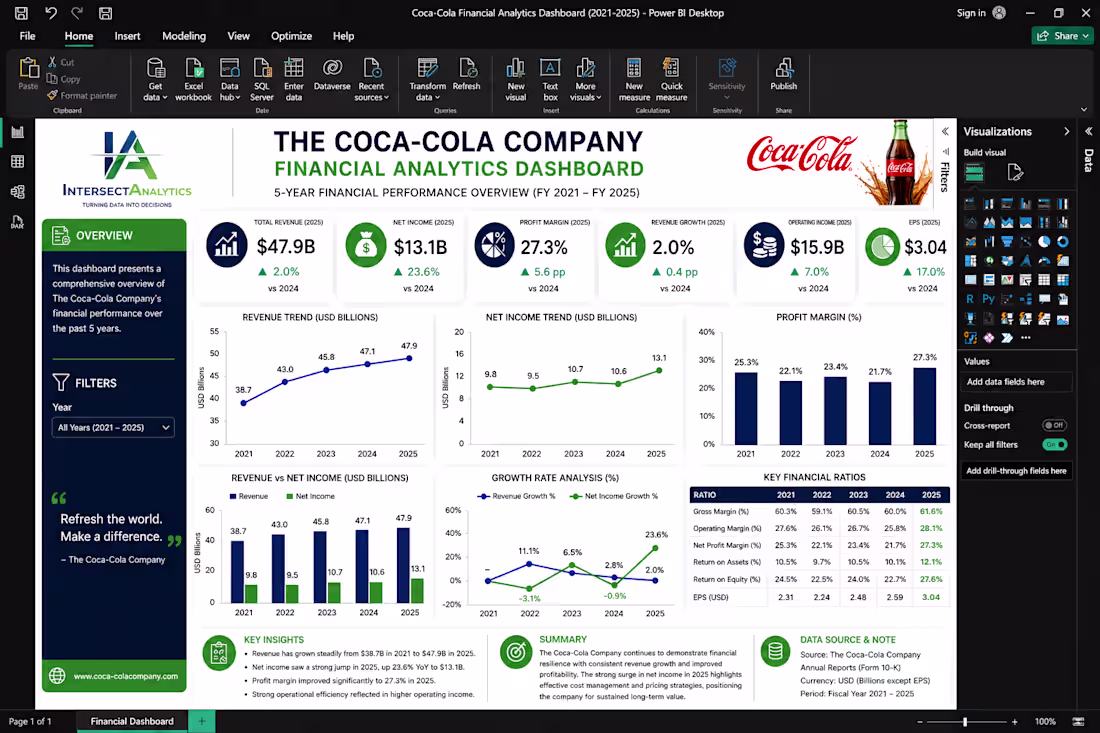
🚀 Financial Analytics Dashboard | Power BI, Excel & Data Automation Experts
Turn your business data into clear, actionable insights with a professionally built Financial Analytics Dashboard. This Coca-Cola case study demonstrates how structured data, KPI tracking, and advanced visualization can uncover trends, improve profitability, and support smarter decision-making.
📊 What This Analysis Shows
Consistent revenue growth over 5 years
Strong profit margin expansion and cost efficiency
Clear visibility into financial performance trends
Data-driven insights for strategic planning and forecasting
💼 Our Services
We help businesses unlock the full value of their data through:
✔ Power BI Dashboard Development (interactive, executive-ready)
✔ Financial Analysis & Modeling (profitability, forecasting, KPIs)
✔ Excel & Google Sheets Automation (reports, dashboards, workflows)
✔ Data Cleaning & Transformation (structured, reliable datasets)
✔ Business Intelligence Solutions (end-to-end analytics systems)
🛠️ Tools We Use
Power BI • Excel • SQL • Python • Tableau • Google Sheets
⭐ Why Work With Us
Data-driven, business-focused insights
Clean, professional, and decision-ready dashboards
Scalable solutions that grow with your business
Strong expertise in finance, analytics, and automation
🎯 Who This Is For
Businesses needing financial dashboards
Companies struggling with manual reporting
Teams looking to automate data workflows
Decision-makers who want real-time insights
📩 Let’s build your custom analytics dashboard today
📱 WhatsApp: +254 723 632 207
👉 Don’t just collect data — turn it into a competitive advantage.
0
18
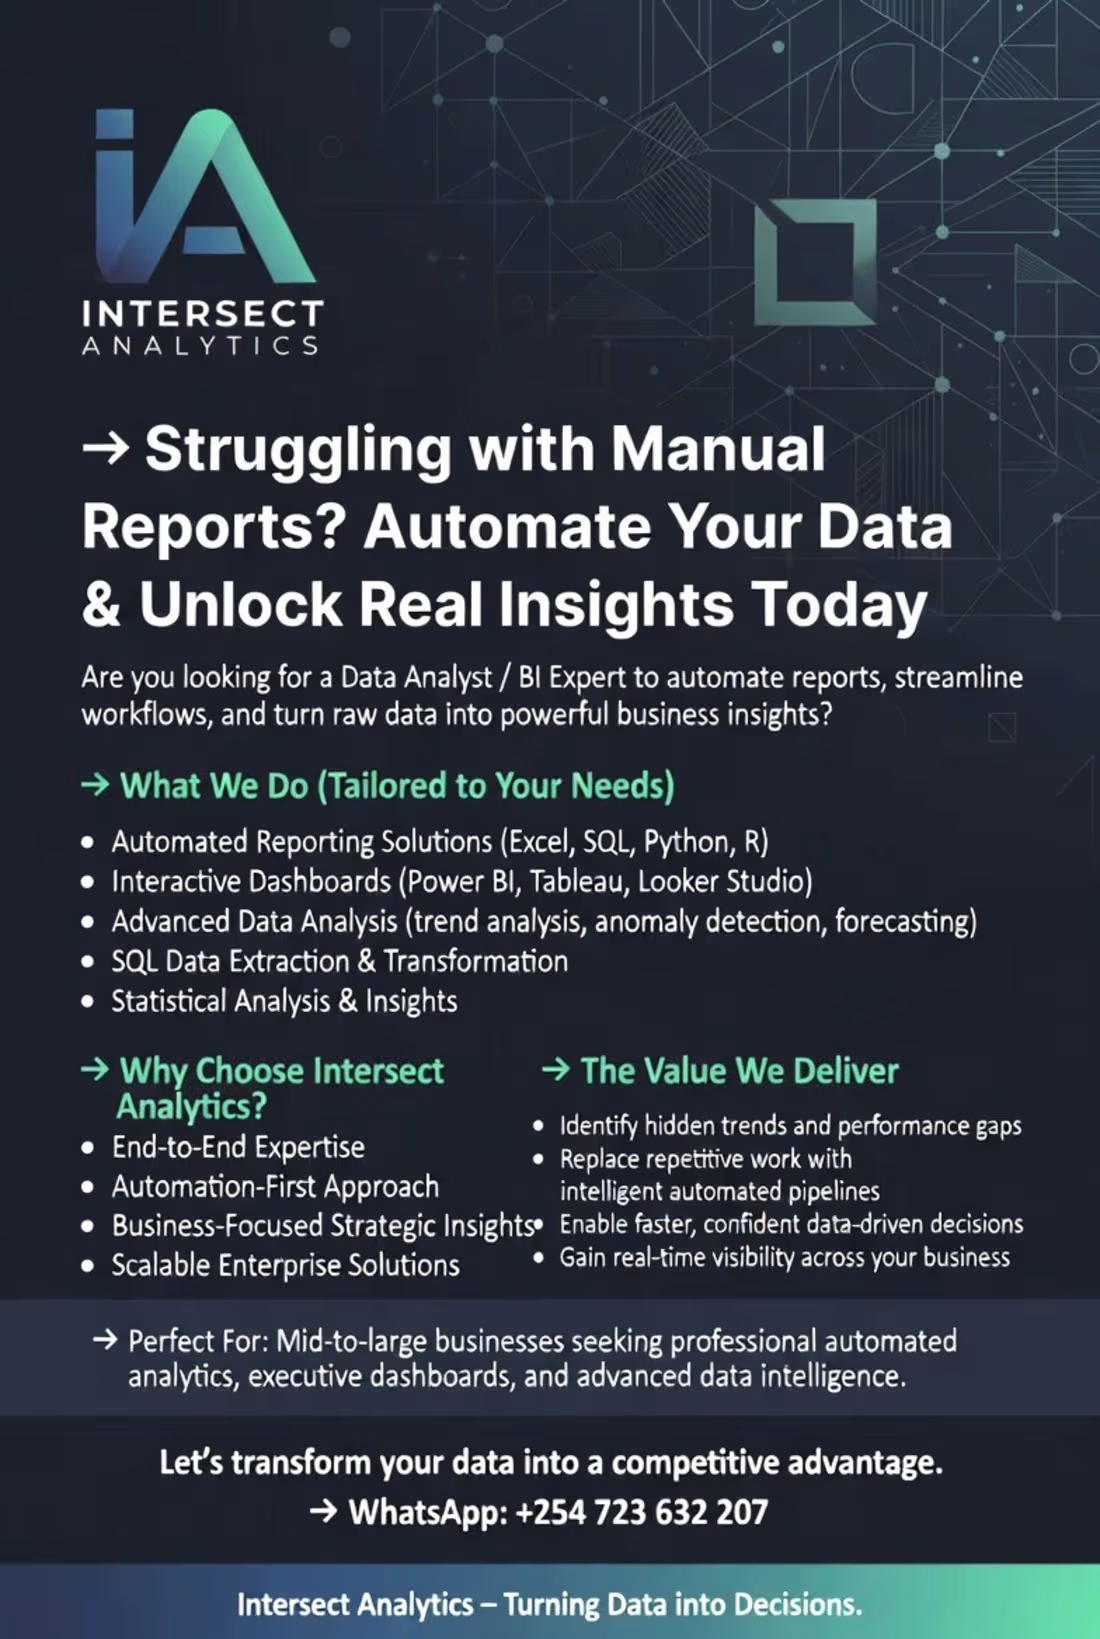
🚀 Struggling with Manual Reports? Automate Your Data & Unlock Real Insights Today
Are you looking for a Data Analyst / BI Expert to automate reports, streamline workflows, and turn raw data into powerful business insights? At Intersect Analytics, we specialize in building scalable, automated reporting systems that eliminate manual work and drive smarter decisions.
🔍 What We Do (Tailored to Your Needs)
We help businesses move from spreadsheet chaos to intelligent dashboards by delivering:
✅ Automated Reporting Solutions (Excel, SQL, Python, R)
✅ Interactive Dashboards (Power BI, Tableau, Looker Studio)
✅ Advanced Data Analysis (trend analysis, anomaly detection, forecasting)
✅ SQL Data Extraction & Transformation (large datasets, multi-source integration)
✅ Statistical Analysis (regression, A/B testing, correlation insights)
✅ Excel Optimization (Pivot Tables, VLOOKUP, dynamic dashboards)
📊 Why Choose Intersect Analytics?
✔️ End-to-End Expertise – From raw data extraction to executive dashboards
✔️ Automation First Approach – Save hours of manual reporting every week
✔️ Business-Focused Insights – We don’t just analyze data, we solve problems
✔️ Scalable Solutions – Built to grow with your business
✔️ Clear Communication – Translating complex data into simple, actionable insights
💡 The Value We Deliver
We help you:
Identify hidden trends and performance gaps
Replace repetitive reporting with automated pipelines
Make faster, data-driven decisions
Gain a clear, real-time view of your business
📈 Perfect For:
Businesses needing automated analytics reports, dashboard development, SQL data handling, and advanced data insights.
📩 Let’s transform your data into a competitive advantage.
📱 WhatsApp: +254 723 632 207
Intersect Analytics – Turning Data into Decisions.
0
21
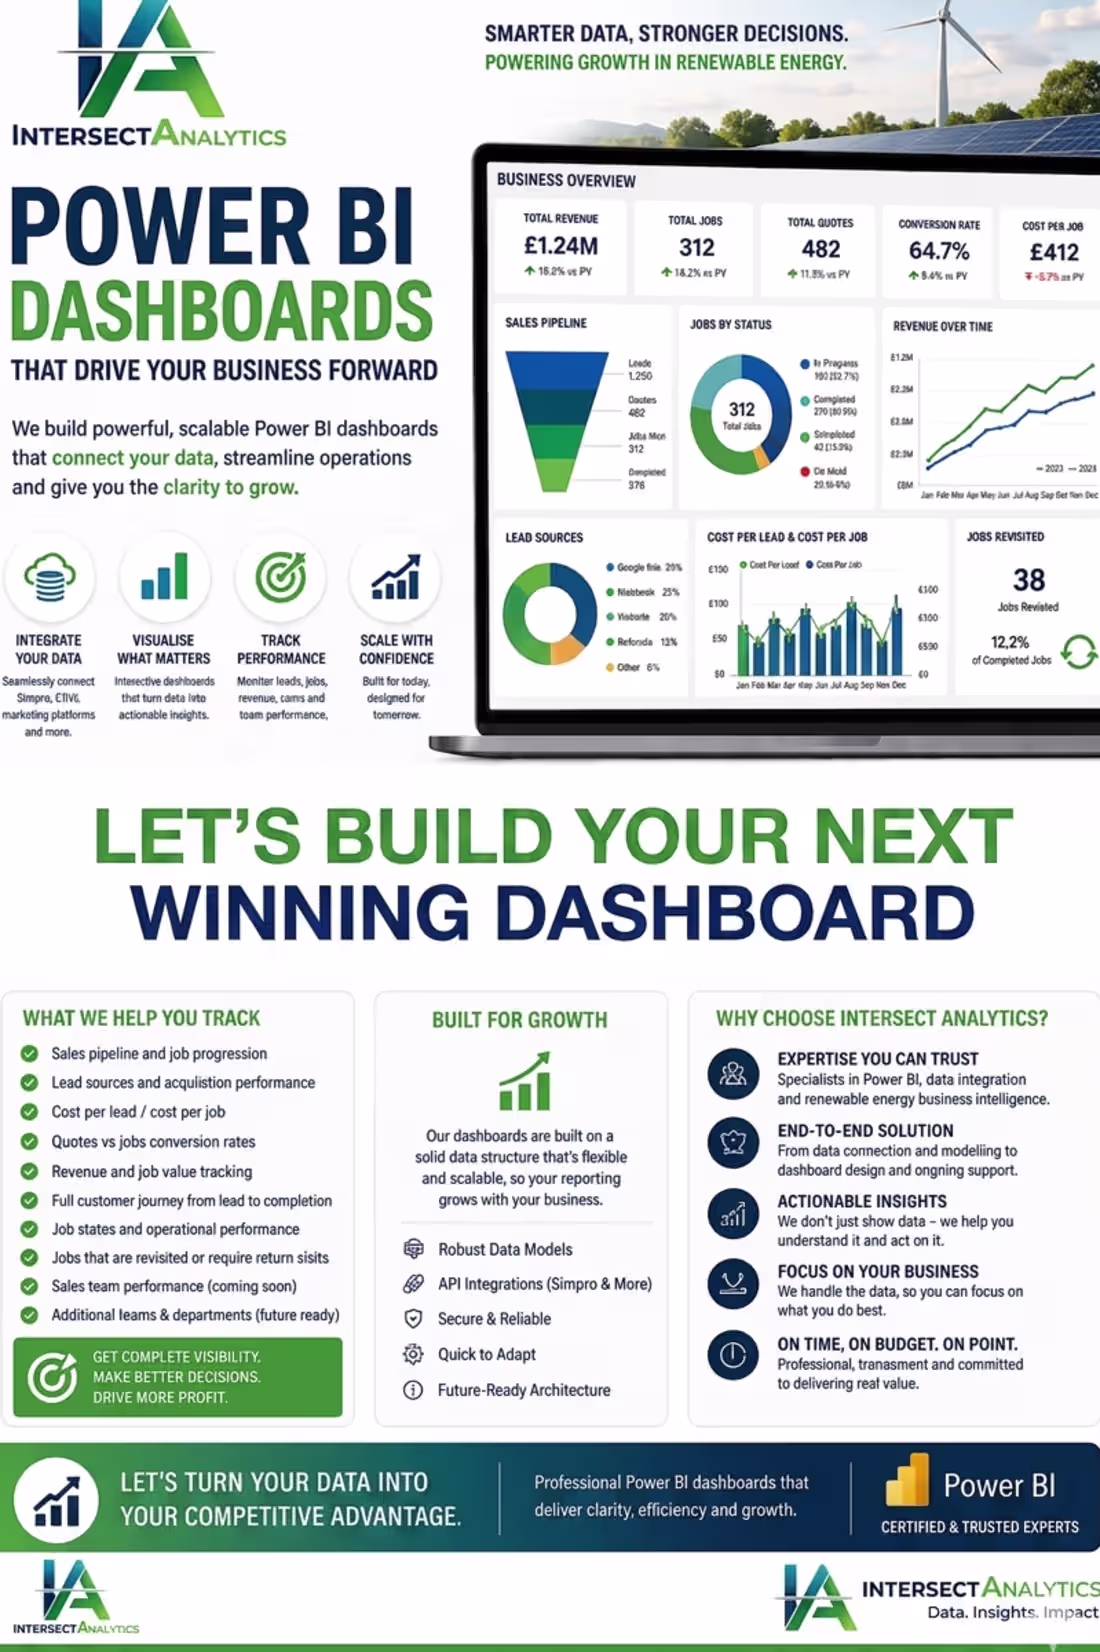
Stop Guessing. Start Growing with Data-Driven Clarity. 📈
Is your business generating a wealth of data but struggling to find the "why" behind the numbers? At Intersect Analytics, we specialize in transforming complex data streams into interactive, automated Power BI dashboards that drive real-world results.
From manufacturing OEE and HR turnover to sales pipeline performance, we build the tools you need to see your business clearly.
✅ Automated Reporting
✅ Scalable Data Architecture
✅ Actionable Business Intelligence
Let’s build your next winning dashboard. 🚀
💬 WhatsApp me today: +254 723 632 207
0
15
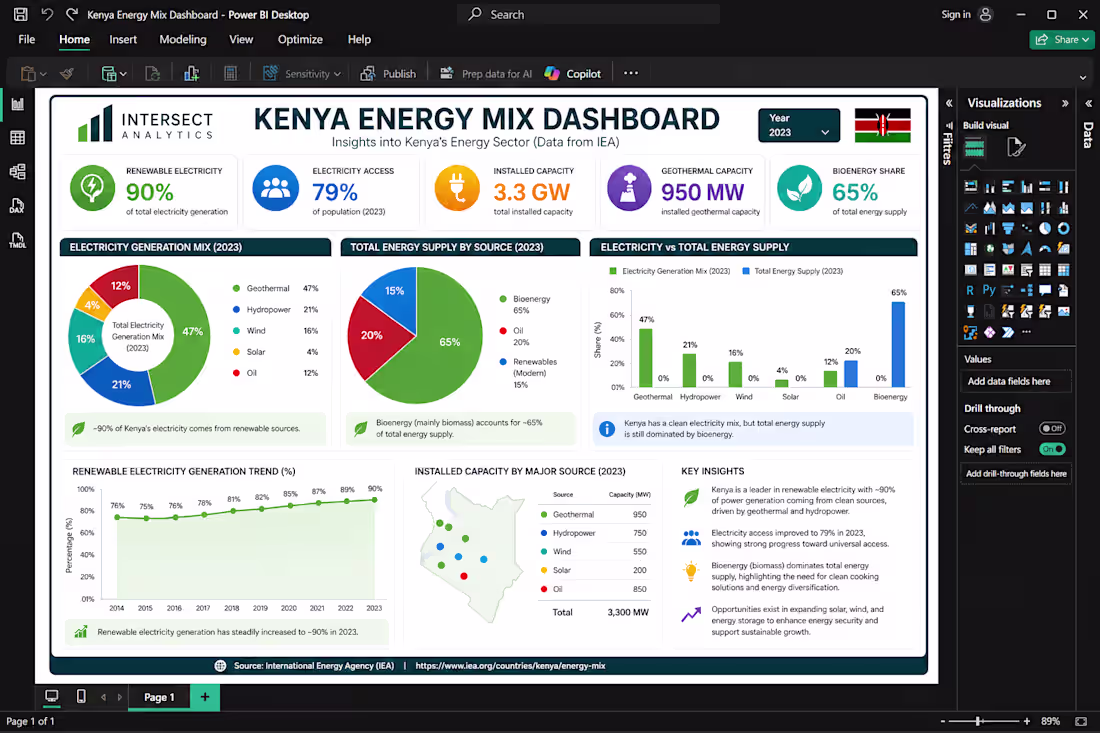
Decoding Kenya’s Energy Future: Where Data Meets Strategy
Kenya has solidified its status as a global powerhouse in renewable energy, yet the raw figures only tell a fraction of the story. My recent comprehensive analysis of the national energy mix reveals a sophisticated narrative of leadership and untapped potential:
⚡ The Green Benchmark: Approximately 90% of Kenya’s electricity is generated from renewable sources, cementing our position as a global leader in geothermal and hydropower integration.
🌍 Closing the Access Gap: National electricity access has surged to approximately 79%, reflecting a resilient and rapidly expanding grid infrastructure.
🔥 The "Hidden" Transition: Despite a green grid, ~65% of total energy consumption remains tied to bioenergy. This highlights a critical gap—and a massive investment opportunity—within the clean cooking and industrial heat sectors.
Our Core Competencies: Strategic Intelligence & Solution Architecture
Visualizing trends is merely the baseline. At Intersect Analytics, we specialize in converting multi-layered datasets into executive-level intelligence. We empower organizations to transcend traditional "reporting" in favor of predictive, data-driven strategy.
Our specialized services include:
✔ End-to-End Business Intelligence: Advanced dashboard development utilizing Power BI and Tableau.
✔ Financial & Market Modeling: Bespoke analytics for startups and established enterprises.
✔ Automated Reporting Systems: Eliminating operational bottlenecks through streamlined data pipelines.
Why Partner with a Data Expert?
Data is a liability if it cannot be interpreted. Partnering with a professional analyst ensures your information becomes a strategic asset:
Objective Clarity: We remove the "noise" from your data, allowing you to identify the core drivers of your business growth without bias.
Risk Mitigation: Professional modeling identifies outliers and potential failures before they impact your bottom line, moving your team from a reactive to a proactive stance.
Operational Efficiency: By automating complex reporting tasks, we return valuable time to your leadership team, allowing them to focus on high-level execution rather than spreadsheet management.
Scalability: We build data architectures that grow with you, ensuring your insights remain robust as your data volume increases.
The Bottom Line: In a data-driven economy, clarity is your greatest competitive advantage.
🚀 Ready to uncover the narrative hidden within your data? Let’s connect and engineer the tools your business needs to scale.
#DataAnalytics #EnergyTransition #Kenya #BusinessIntelligence #PowerBI #IntersectAnalytics #CleanEnergy
0
12
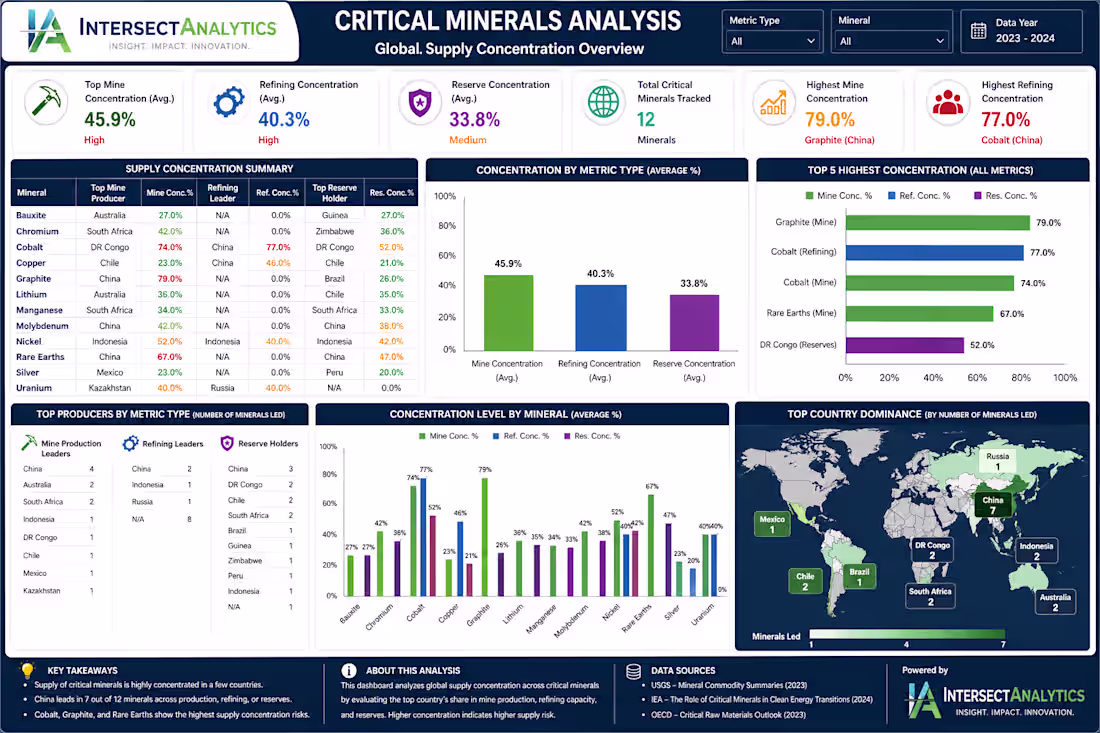
Executive Summary – Critical Minerals Supply Concentration Analysis
This dashboard provides a comprehensive global analysis of critical minerals, highlighting the growing risks associated with supply concentration across mining, refining, and reserves. As demand accelerates due to the global energy transition, the data reveals a heavy reliance on a small number of countries, creating significant geopolitical and supply chain vulnerabilities.
The analysis shows that average mine concentration stands at ~45.9%, with refining concentration even higher at ~40.3%, indicating that production and processing are highly centralized. Minerals such as graphite (79%), cobalt (74%), and rare earths (67%) exhibit particularly high concentration levels, signaling elevated supply risk.
A key insight is the dominance of China, which leads in multiple areas including refining and reserves, making it the most influential player in the global minerals supply chain. Other critical contributors include DR Congo (cobalt) and Indonesia (nickel), further emphasizing the limited geographic diversification of supply.
📊 Key Insights
High Supply Risk Minerals: Cobalt, Graphite, and Rare Earths show the highest concentration levels
Refining Bottleneck: China dominates global refining capacity, especially for cobalt and copper
Geographic Dependence: A few countries control the majority of global supply chains
Moderate Risk Minerals: Nickel, Lithium, and Chromium show growing but manageable concentration levels
Lower Risk Minerals: Bauxite, Silver, and Manganese exhibit relatively lower concentration risk
🎯 Strategic Implications
This analysis highlights a critical challenge in the global transition to clean energy:
👉 Supply security is as important as resource availability.
Without diversification of supply chains and investment in alternative sources, industries remain exposed to price volatility, geopolitical risks, and supply disruptions.
💼 Powered by Intersect Analytics
At Intersect Analytics, we transform complex global datasets into clear, decision-ready insights. This dashboard reflects our expertise in combining data analytics, visualization, and strategic thinking to help organizations understand risks and act with confidence.
⭐ The Bottom Line
This is more than just a dashboard—it’s a strategic lens into the future of global resource security.
👉 With Intersect Analytics, you gain the clarity needed to navigate risk, identify opportunities, and stay ahead in a rapidly evolving global economy.
0
19
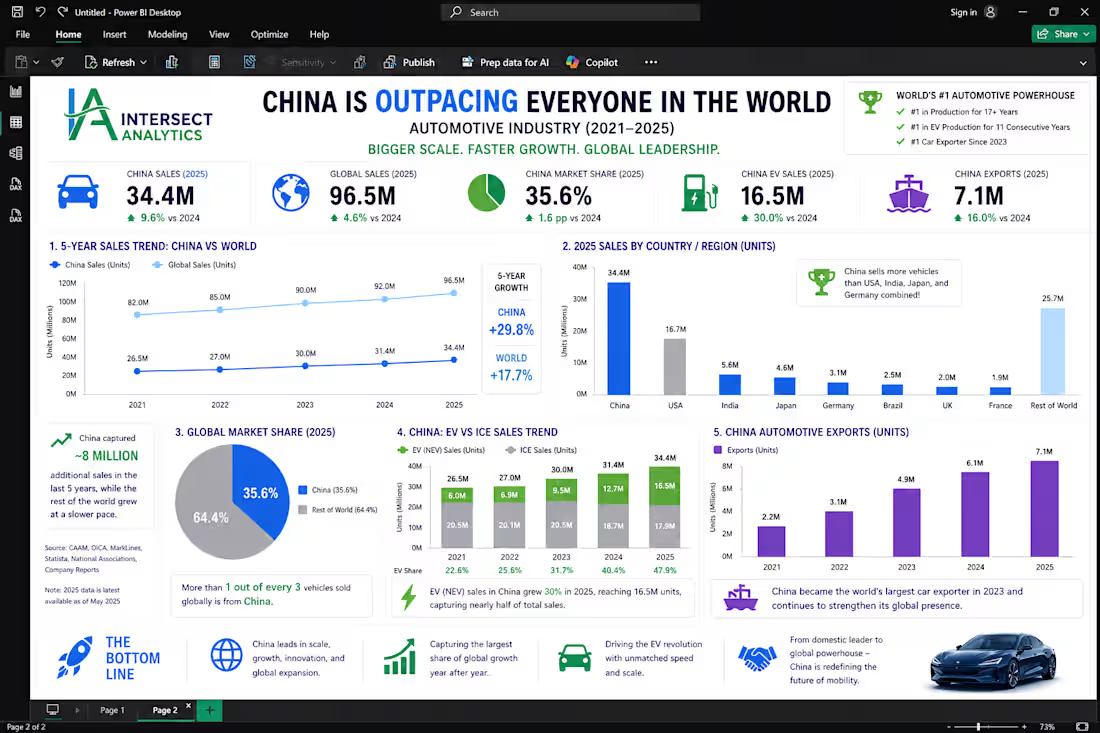
This dashboard delivers a comprehensive 5-year analysis (2021–2025) of the global automotive industry, clearly highlighting how China has emerged as the undisputed market leader.
The data reveals that China is not only the largest automotive market globally, but also the fastest-growing, now accounting for over 35% of global vehicle sales. With strong growth in electric vehicles (EVs), exports, and total production, China is capturing the majority of global industry expansion while other major economies grow at a slower pace.
Key insights from the dashboard include:
China’s sales growth significantly outpaces global averages
Rapid acceleration in EV adoption, nearing half of total sales
Strong export growth positioning China as a global automotive powerhouse
A widening gap between China and other major markets like the USA, Japan, and Germany
💼 About Our Services – Intersect Analytics
At Intersect Analytics, we specialize in transforming complex data into clear, actionable insights that drive strategic decision-making.
Our core services include:
📊 Interactive Dashboard Development (Power BI, Tableau)
📈 Data Analysis & Business Intelligence
🔍 Market Research & Industry Insights
🤖 Data Automation & Reporting Solutions
📉 Financial & Operational Analytics
⭐ Why Choose Intersect Analytics?
Data-Driven Precision – We go beyond visuals to deliver insights that matter
Business-Focused Approach – Every dashboard is tailored to support real decisions
Advanced Technical Expertise – Skilled in Power BI, SQL, Python, and financial modeling
Clean, Executive-Ready Designs – Dashboards that are both insightful and visually compelling
Fast Turnaround, High Impact – We deliver quality solutions efficiently
🎯 The Bottom Line
This dashboard is more than just a visual—it’s a strategic tool that clearly shows how global dynamics are shifting, with China leading the future of the automotive industry.
👉 With Intersect Analytics, you don’t just get data—you get clarity, direction, and a competitive edge.
1
3
79
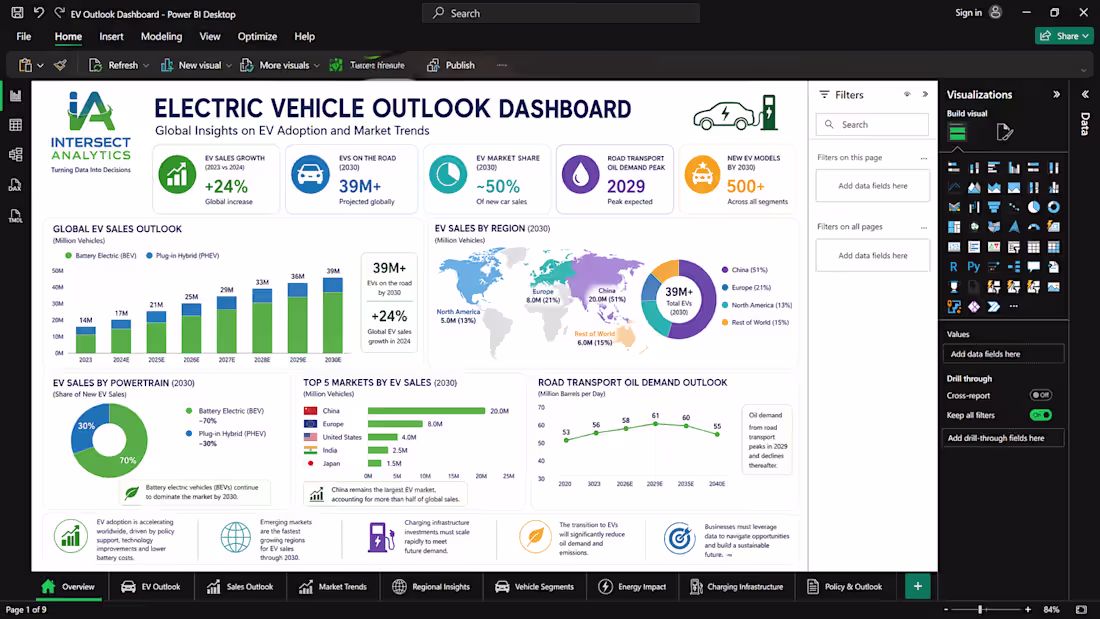
🌍 Electric Vehicle Market Overview & Key Findings
This dashboard presents a comprehensive analysis of the global shift toward electric mobility, highlighting trends in EV adoption, sales growth, and market dynamics across key regions.
📊 Key Findings:
The global EV market is experiencing rapid acceleration, driven by policy support, technological advancements, and increasing environmental awareness.
Asia, particularly China, continues to dominate EV adoption, while Europe and North America show strong and consistent growth.
EV sales are steadily outpacing traditional internal combustion engine (ICE) vehicles, signaling a structural shift in the automotive industry.
Market expansion is supported by improvements in battery technology, cost reductions, and increased investment in charging infrastructure.
🔮 Market Outlook
EV adoption is projected to continue growing significantly over the next decade, with millions of new electric vehicles entering the market annually.
Emerging markets present untapped growth opportunities, although infrastructure and affordability remain key challenges.
The transition to electric mobility is expected to reshape global energy demand, reducing reliance on fossil fuels and accelerating sustainability goals.
Companies that leverage data-driven insights will be better positioned to navigate this evolving landscape and capture market share.
🚀 Powered by Intersect Analytics
At Intersect Analytics, we go beyond dashboards—we deliver actionable intelligence.
We help businesses:
✅ Transform raw data into strategic insights
✅ Build interactive Power BI dashboards
✅ Perform advanced Python data analysis
✅ Develop predictive models & forecasts
✅ Optimize operations through data-driven decision-making
📩 Whether you're in automotive, energy, finance, or consulting, we help you turn complex data into clear, actionable strategies that drive growth.
Let’s unlock the power of your data.
2
3
91
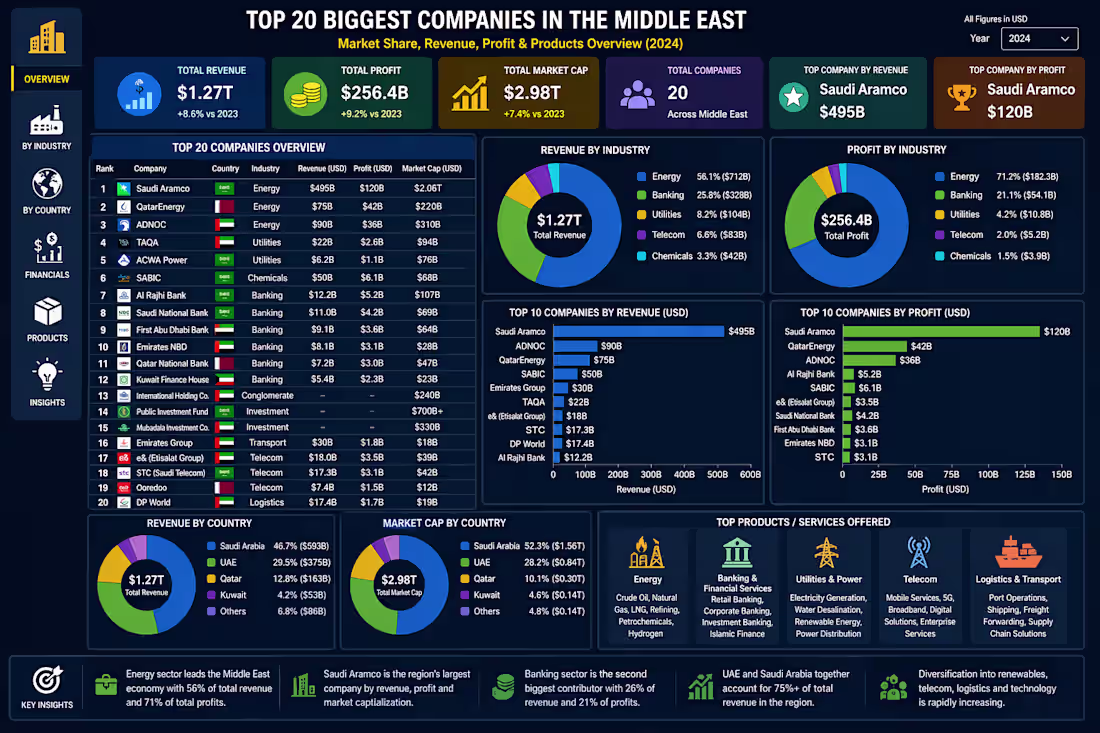
🌍 Middle East Market Insights: Top 20 Leading Companies (2024)
What drives growth and profitability in the Middle East?
Using advanced data analytics, Python, and Power BI dashboards, we analyzed the region’s top companies across energy, banking, telecom, and logistics—uncovering where the biggest opportunities lie.
📊 Key insights:
✔ Energy dominates revenue and profit across the region
✔ Banking and telecom sectors show strong, stable growth
✔ Rapid diversification into technology, renewables, and infrastructure
At Intersect Analytics, we help businesses across the Middle East unlock the full potential of their data through:
✅ Power BI Dashboard Development
✅ Advanced Python Data Analysis
✅ Financial & Business Intelligence Solutions
✅ Predictive Analytics & Reporting Automation
🚀 Whether you're in UAE, Saudi Arabia, Qatar, or beyond, we deliver data-driven insights that drive smarter decisions and measurable growth.
📩 Let’s work together to turn your data into a competitive advantage.
#DataAnalytics #MiddleEastBusiness #PowerBI #BusinessIntelligence #DataVisualization #Python #FinancialAnalysis #DashboardDesign #UAE #SaudiArabia #AnalyticsServices
1
2
62
At Intersect Analytics, we help businesses turn complex data into clear, actionable insights that drive smarter decisions and growth.
🚀 Looking to build dashboards, automate reporting, or unlock insights from your data? Let’s connect.
#DataAnalytics #PowerBI #BusinessIntelligence #DataVisualization #Python #FinancialAnalysis #DashboardDesign #DataDriven #AnalyticsServices
0
24
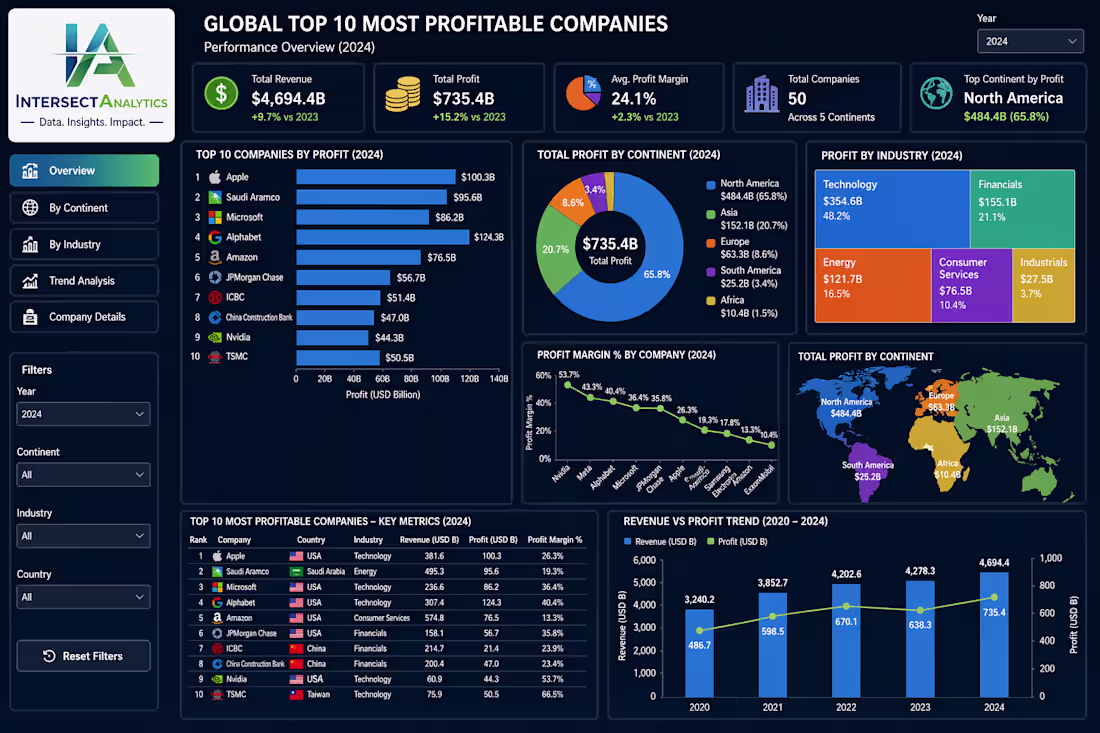
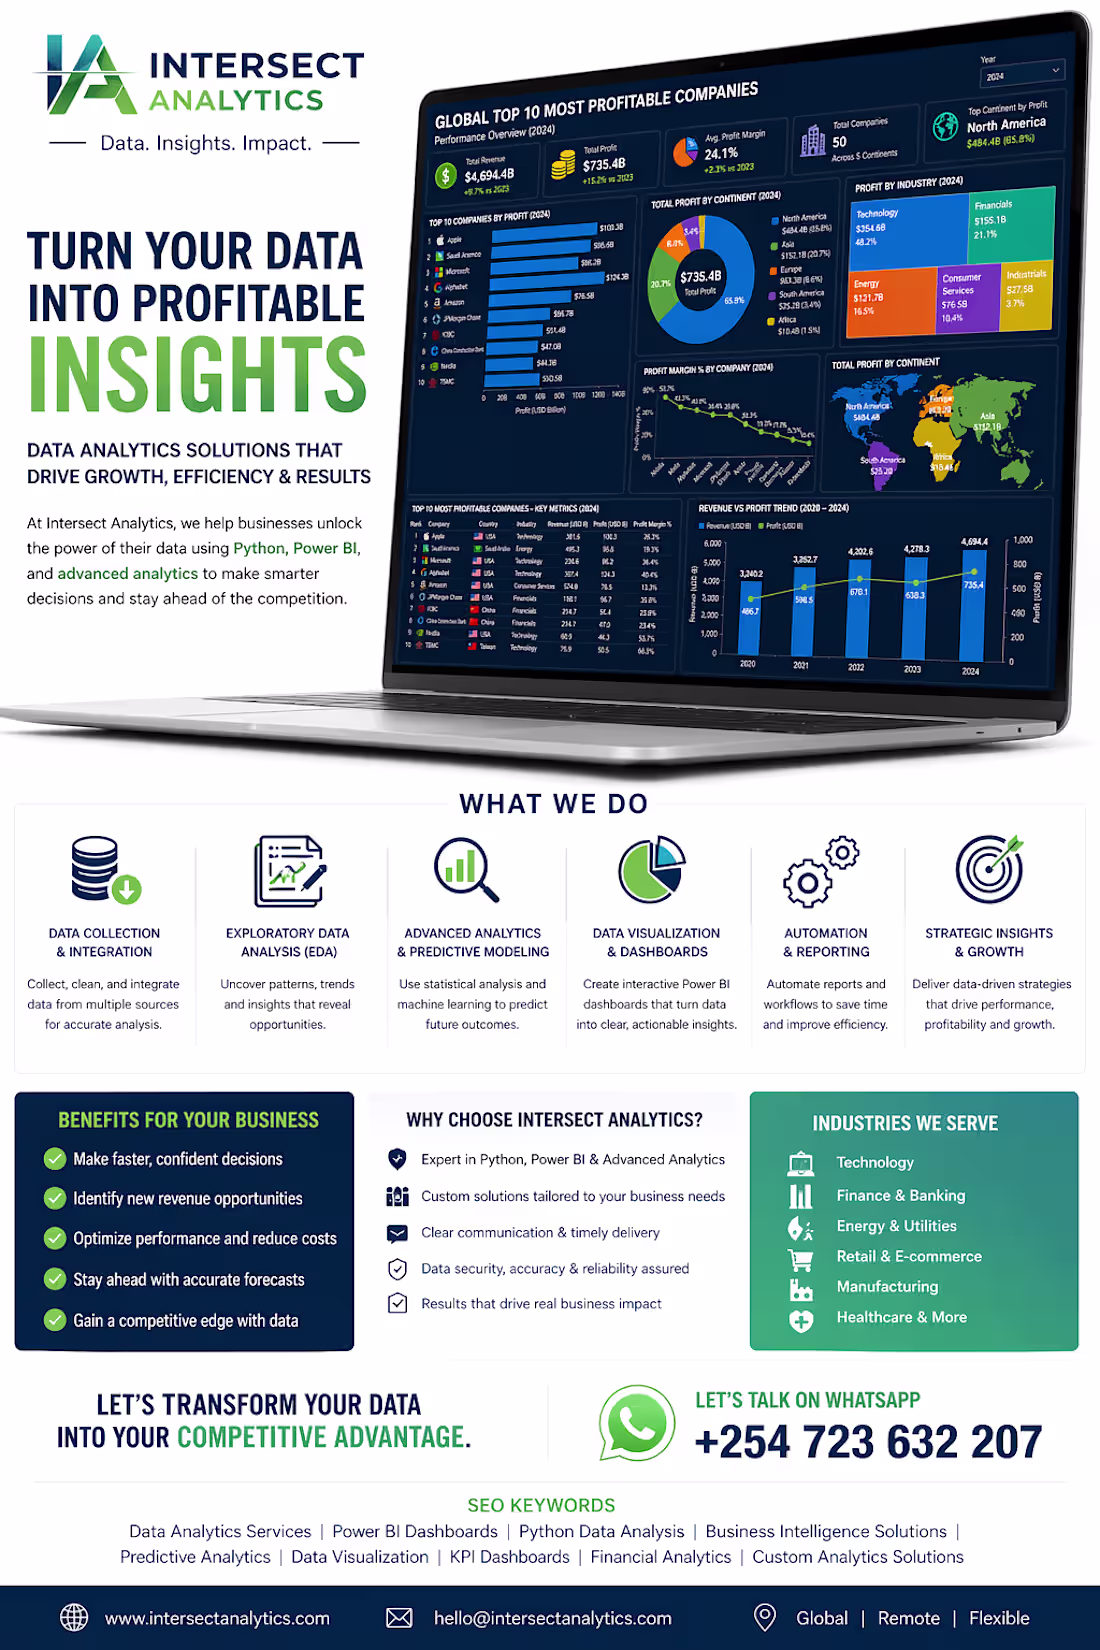
🌍 Global Data Insights: Top 10 Most Profitable Companies (2024)
What drives profitability at the world’s biggest companies?
Using advanced data analytics, Python, and Power BI, I analyzed global financial data to uncover key trends across industries and continents. From tech giants like Apple & Microsoft to energy leaders like Saudi Aramco, the insights reveal where real value is created.
📊 Key highlights:
✔ Tech dominates profitability with high margins
✔ Energy shows strong but volatile returns
✔ Financial services remain consistently profitable
At Intersect Analytics, we help businesses turn complex data into clear, actionable insights that drive smarter decisions and growth.
🚀 Looking to build dashboards, automate reporting, or unlock insights from your data? Let’s connect.
#DataAnalytics #PowerBI #BusinessIntelligence #DataVisualization #Python #FinancialAnalysis #DashboardDesign #DataDriven #AnalyticsServices
0
17
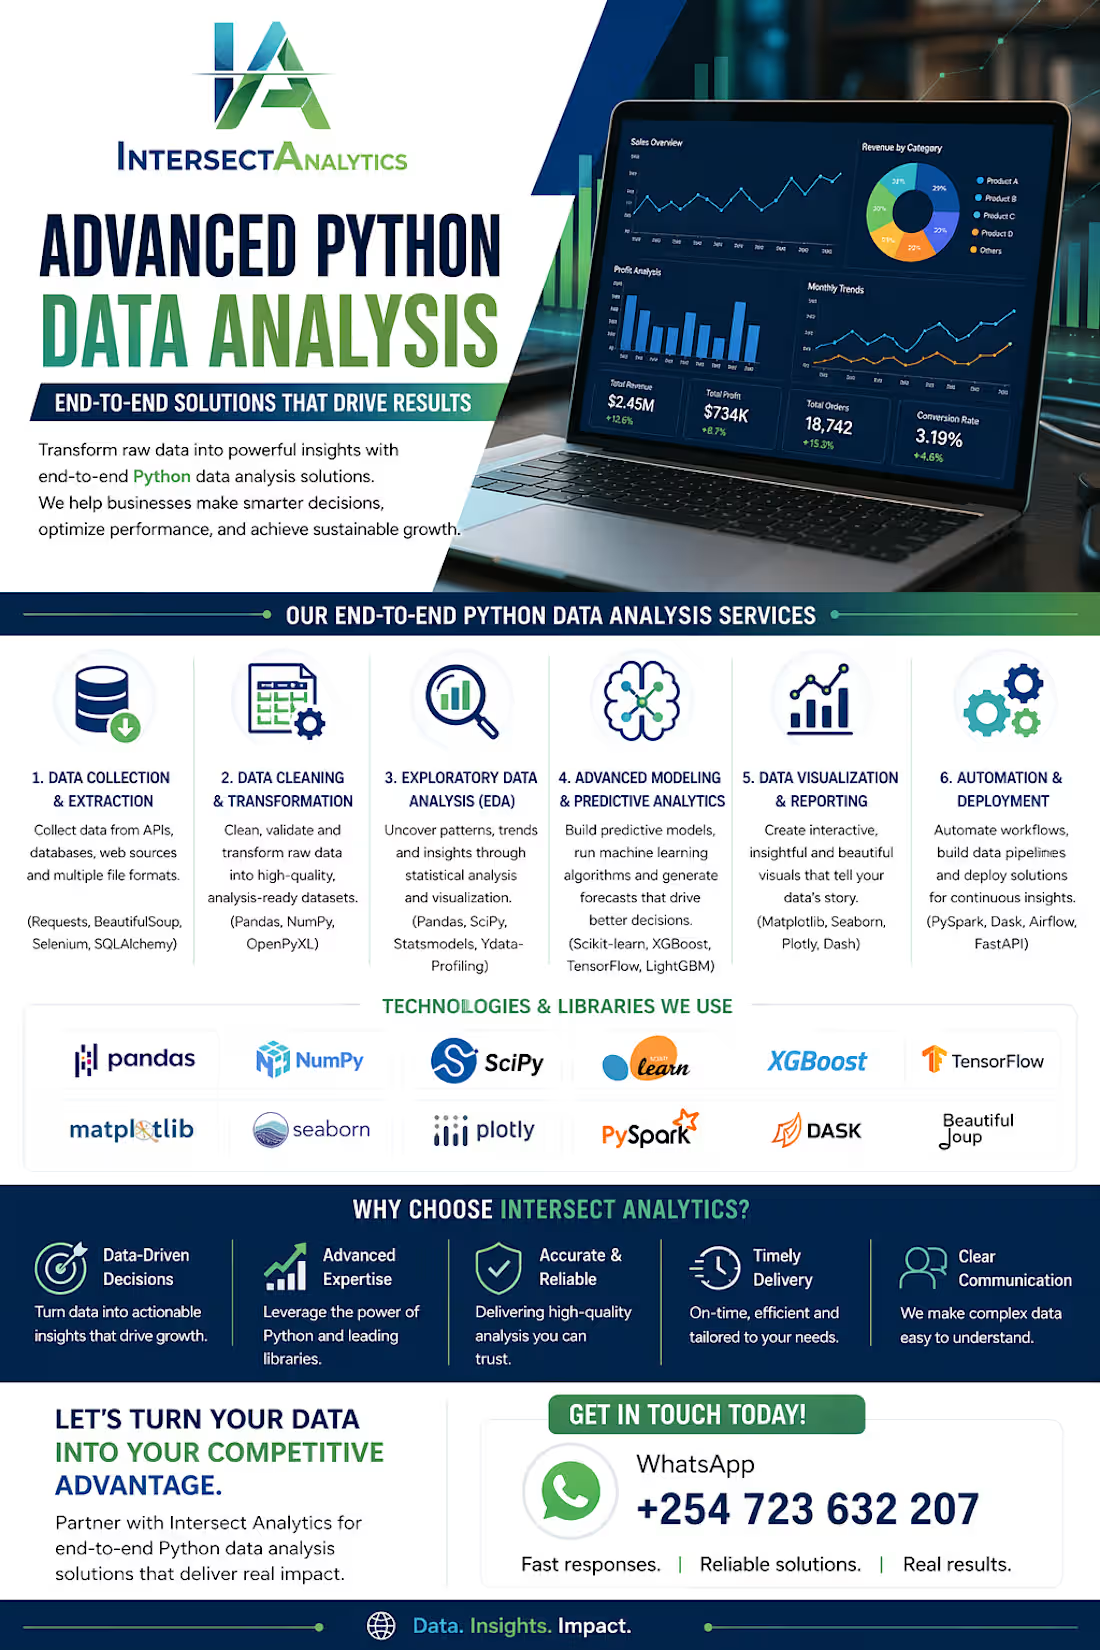
🚀 Advanced Python Data Analysis Services | End-to-End Solutions for Business Growth
At Intersect Analytics, we deliver end-to-end Python data analysis solutions designed to turn raw data into powerful, actionable insights. From data collection to advanced modeling and visualization, we help businesses make smarter, data-driven decisions.
🔍 Our Expertise Includes:
Data Cleaning & Transformation (Pandas, NumPy)
Exploratory Data Analysis (EDA) & Statistical Modeling (SciPy, Statsmodels)
Machine Learning & Predictive Analytics (Scikit-learn, XGBoost, TensorFlow)
Data Visualization & Storytelling (Matplotlib, Seaborn, Plotly)
Big Data Processing & Automation (PySpark, Dask)
API Integration & Data Extraction (Requests, BeautifulSoup)
📊 What We Deliver:
Scalable, production-ready data solutions
Predictive models that uncover trends and opportunities
Interactive dashboards and clear reporting
Automated workflows to save time and improve accuracy
💡 Whether you're looking to optimize operations, forecast performance, or unlock hidden insights, we provide tailored Python solutions that drive real business impact.
0
18
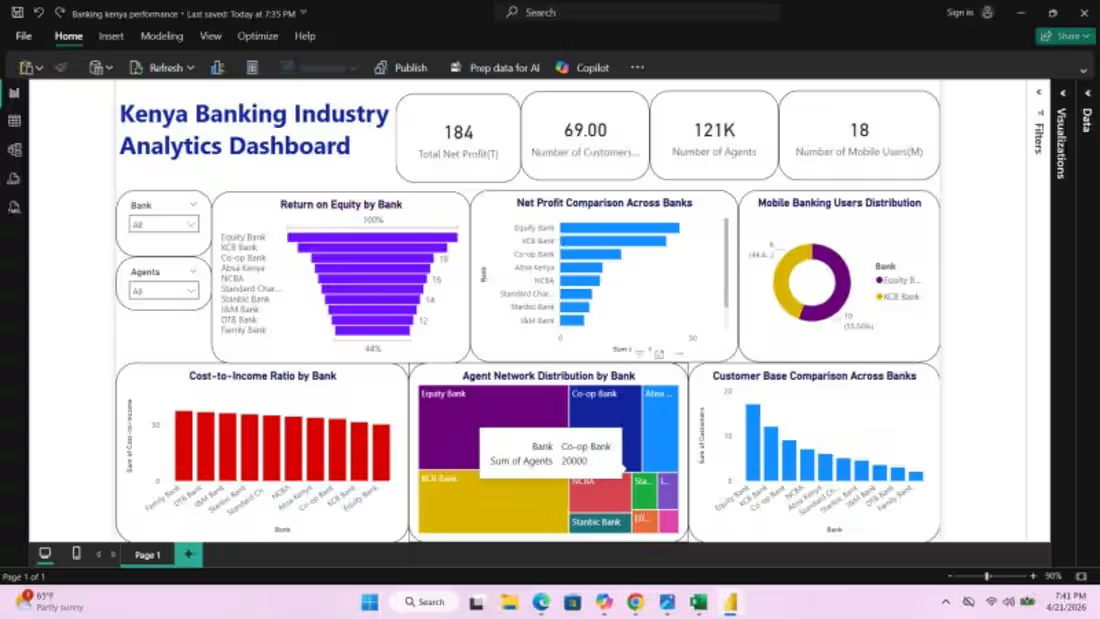
Came across this 2025 dataset on the Kenyan banking sector and ran a quick analysis through our Power BI framework at Intersect Analytics—here’s what we uncovered:
📊 Key Findings
• Equity Bank dominates the market, leading in net profit, customer base, and agent network—a clear indication of its strength in both digital and physical banking
• KCB Bank and Co-operative Bank of Kenya remain strong competitors, with solid profitability and a wide customer reach
• Return on Equity (ROE) highlights a clear divide—top-tier banks are significantly more efficient in generating returns, pointing to strong capital management
• Cost-to-Income ratios reveal operational gaps—some banks are highly optimized, while others face cost inefficiencies that impact profitability
• Digital banking is the game changer—banks with larger mobile user bases and agent networks are outperforming others
• The customer base distribution shows clear market concentration, with tier-1 banks leveraging scale and accessibility to maintain dominance
💡 Intersect Analytics Perspective
Even from this quick analysis, it’s clear that:
✔ Data-driven banks outperform competitors
✔ Digital transformation is driving market leadership
✔ Operational efficiency is key to profitability
🛠️ Our Services at Intersect Analytics
We don’t just analyze data—we build systems that help businesses act on it:
• Power BI Dashboard Development
• Data Cleaning, Transformation & Modeling
• Automation (Excel, Python, SQL, Google Apps Script)
• Custom Script Development for Reporting & Operations
• Business Intelligence & Advanced Analytics
🎯 Why Intersect Analytics
✔ Clean data = reliable insights
✔ End-to-end analytics solutions
✔ Business-focused dashboards (not just visuals)
✔ Automation that saves time and reduces errors
✔ Insights that drive real decision-making
📩 Looking to build something like this for your business?
📞 +254 723 632207 (WhatsApp Available)
💡 Intersect Analytics — Powering insights. Driving decisions.
1
2
49
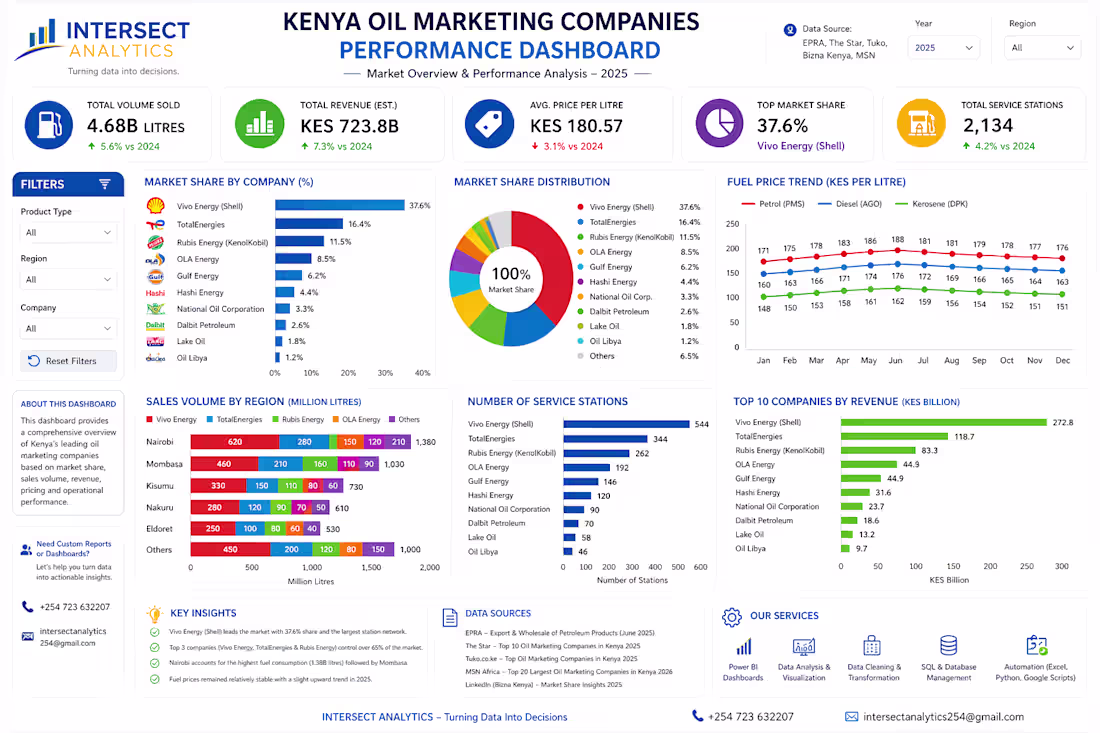
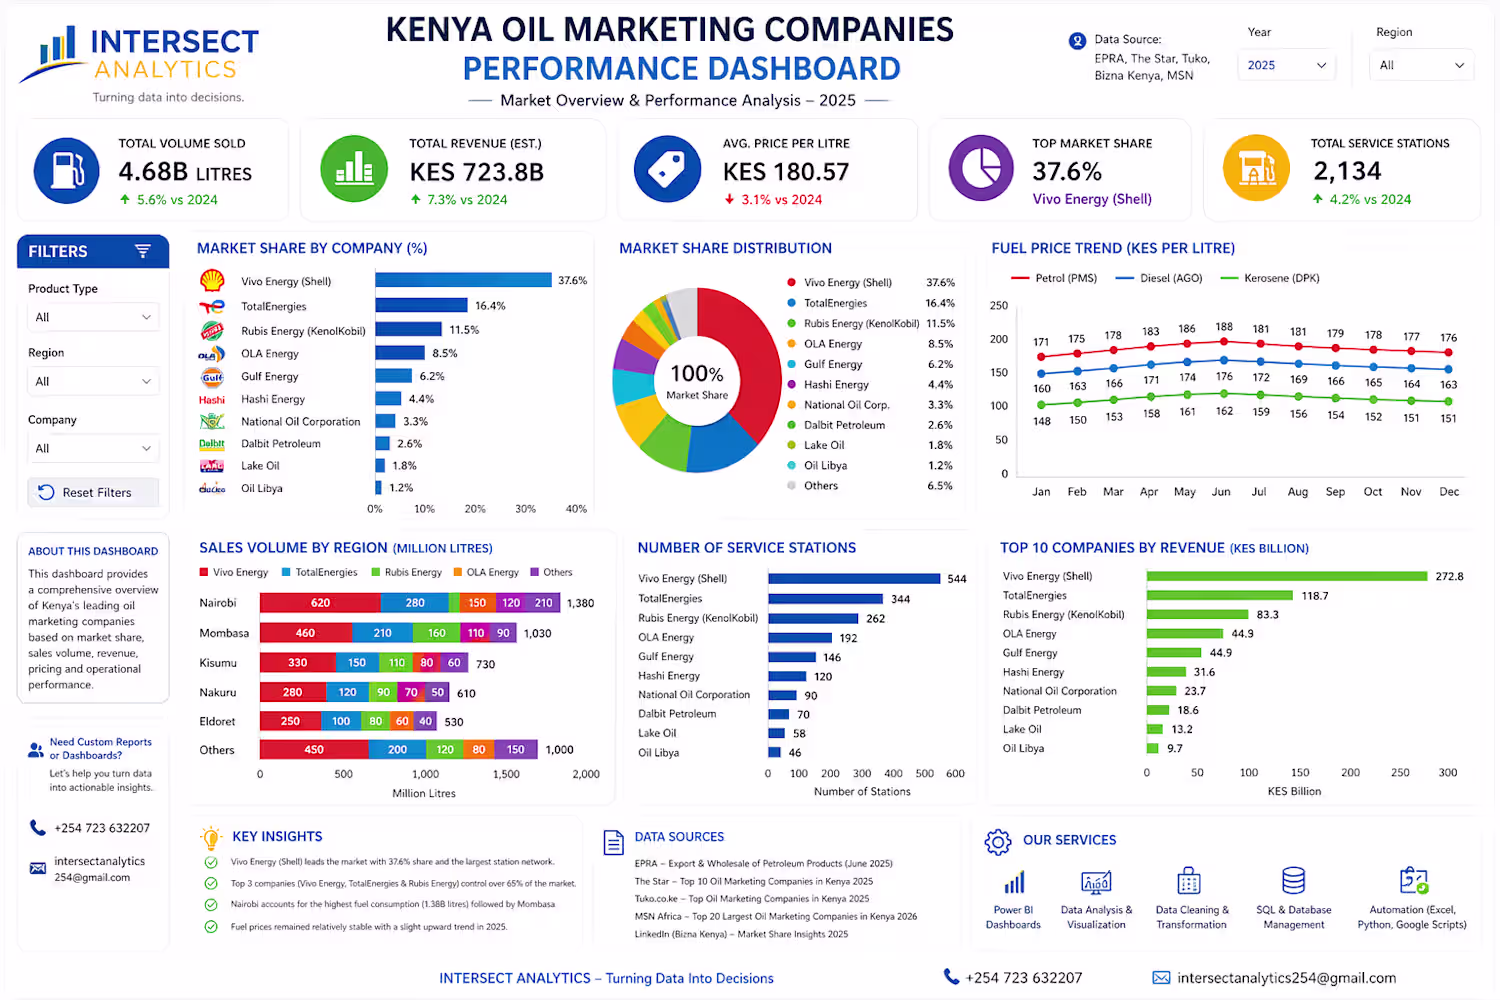
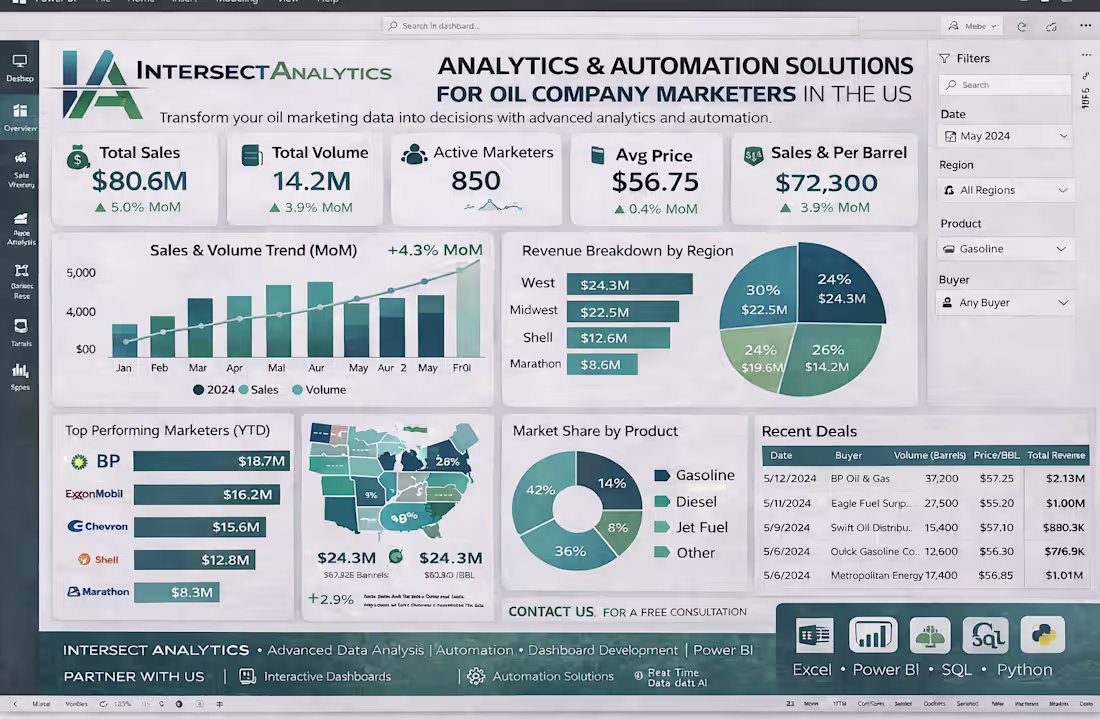
🚀 Kenya Oil Marketing Performance Dashboard | Powered by Intersect Analytics
What if you could monitor the entire oil and fuel market in Kenya—from market leaders to pricing trends—in one powerful, interactive dashboard?
Our latest Kenya Oil Marketing Companies Performance Dashboard delivers exactly that.
📊 What This Dashboard Reveals
This professional Power BI dashboard provides a 360° view of the oil industry in Kenya, combining market share, pricing, operations, and regional performance into one seamless experience.
🔍 Key Highlights:
• Vivo Energy (Shell) leads the market with over 37% market share
• Top 3 companies dominate the industry, controlling a significant portion of total sales
• Fuel prices remain relatively stable, with slight fluctuations across months
• Nairobi and Mombasa drive the highest fuel consumption
• Larger companies benefit from wider station networks and operational efficiency
📈 From sales volumes to service station coverage, this dashboard transforms complex industry data into clear, actionable insights.
💡 Why This Matters for Your Business
✔ Identify market leaders and competitive positioning
✔ Understand regional demand and expansion opportunities
✔ Monitor pricing trends and cost drivers
✔ Make faster, data-driven decisions
🛠️ Our Services at Intersect Analytics
We don’t just build dashboards—we build complete data solutions:
• Power BI Dashboard Development
• Data Analysis & Visualization
• Data Cleaning, Transformation & Modeling
• Automation Solutions (Excel, Python, Google Apps Script)
• SQL Database Design & Optimization
• Custom Script Writing for Business Processes
• Financial & Operational Reporting
🎯 Why Choose Intersect Analytics?
✔ We start with clean, reliable data—no misleading insights
✔ We deliver end-to-end analytics solutions (data → insights → action)
✔ We combine technical expertise with business understanding
✔ We automate your workflows to save time and reduce errors
✔ We design dashboards that are clear, professional, and decision-focused
🚀 Turn Data Into a Competitive Advantage
This dashboard is just one example of how we help businesses unlock the power of their data.
📩 Let’s help you make smarter business decisions
📞 +254 723 632207 (WhatsApp Available)
💡 Intersect Analytics — Turning data into decisions, and insights into growth.
2
39
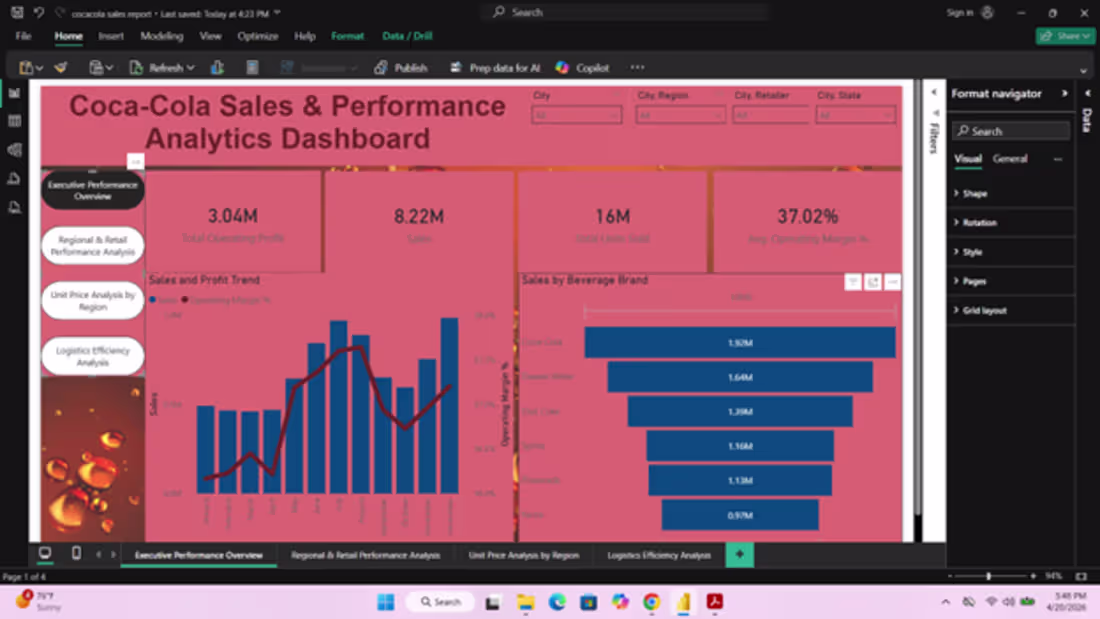
🚀 Preliminary Data Analytics Report | Unlock Powerful Business Insights with Intersect Analytics
What if you could clearly see where your revenue comes from, which products drive profit, and how to scale your business efficiently?
Our preliminary Coca-Cola Sales & Performance analysis demonstrates the kind of powerful insights we deliver through advanced data analytics and business intelligence solutions.
📊 Preliminary Insights That Drive Smarter Decisions
From this initial dashboard review, we identified:
• $8.22M Total Sales with consistent growth trends
• $3.04M Operating Profit highlighting strong financial performance
• 37.02% Average Operating Margin – a sign of efficient cost control
• 16 Million Units Sold – indicating strong product demand and market reach
🥤 Brand Performance Snapshot:
• Coca-Cola leads with $1.92M in sales
• Dasani Water and Diet Coke are key revenue drivers
• Opportunity exists to improve performance of lower-tier brands
📈 Key Insight:
This preliminary analysis shows profitable and scalable growth, supported by strong margins and high-volume sales.
💡 What This Means for Your Business
✔ Identify high-performing products and revenue drivers
✔ Optimize pricing and cost structures
✔ Improve forecasting using real data trends
✔ Make faster, data-driven strategic decisions
🛠️ Our Services at Intersect Analytics
We help businesses achieve results like this through:
• Power BI Dashboard Development (Sales, Finance, Operations, HR)
• Data Cleaning, Transformation & Modeling
• Automation (Excel, Python, Google Apps Script)
• SQL Database Management & Optimization
• Advanced Data Analysis & Business Intelligence
• Financial & Performance Reporting
🎯 Why Choose Intersect Analytics?
✔ We start with clean, reliable data (no misleading insights)
✔ We deliver end-to-end analytics solutions
✔ We combine business understanding with technical expertise
✔ We build interactive dashboards that drive real decisions
✔ We focus on results, not just visuals
📈 Turn Your Data Into a Competitive Advantage
This is just a preliminary report—imagine what deeper analysis and a fully optimized system can reveal for your business.
📩 Ready to unlock the full value of your data?
📞 +254 723 632207 (WhatsApp Available)
💡 Intersect Analytics — Turning raw data into actionable business intelligence.
1
36
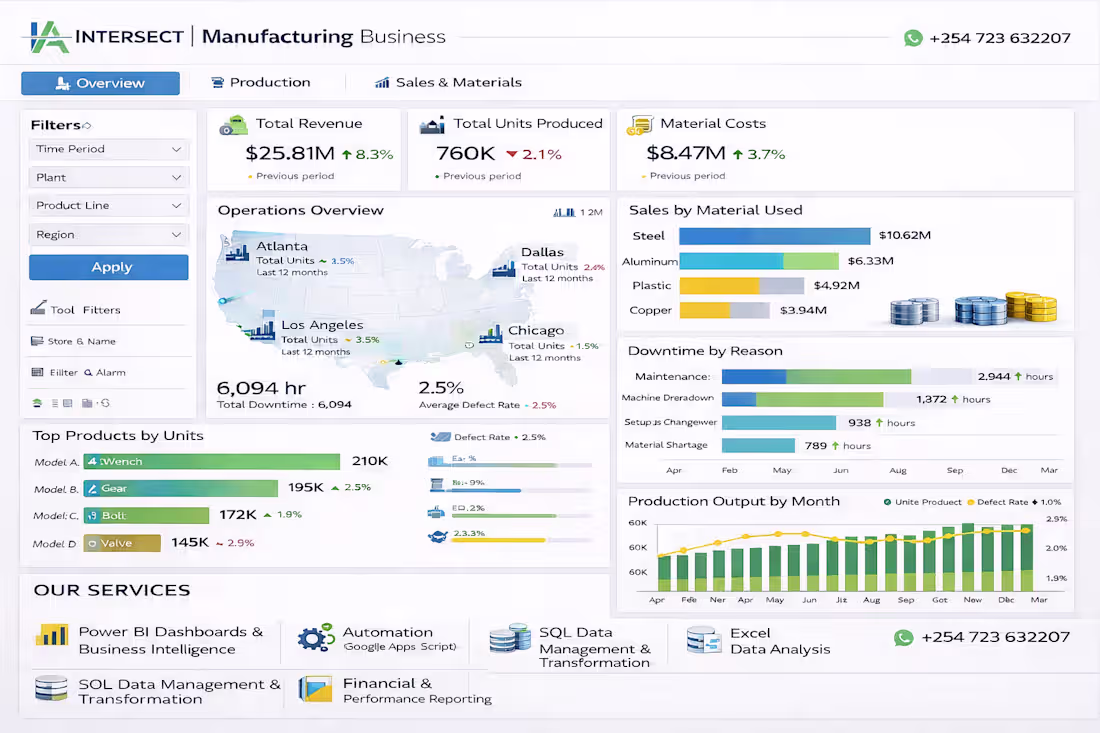
🚀 Manufacturing Intelligence Dashboard | Powered by Intersect Analytics
What if you could track your entire manufacturing operation—from production to material usage—in one powerful, real-time dashboard?
We recently developed this advanced Power BI Manufacturing Dashboard designed to give businesses full visibility into operations, costs, and performance.
📊 Key Insights from the Dashboard
🔹 Revenue Growth: Total revenue reached $25.81M, showing a strong upward trend
🔹 Production Performance: Over 760K units produced, highlighting operational scale
🔹 Material Cost Optimization: Steel and Aluminum drive the highest costs—key areas for cost control
🔹 Top Products: Wrench and Gear lead in production volume, indicating high demand
🔹 Operational Efficiency:
• On-time delivery rate at 94.5%
• Downtime largely driven by maintenance and machine breakdowns
🔹 Production Trends: Consistent monthly growth with opportunities to reduce defect rates
🛠️ Our Core Services
At Intersect Analytics, we deliver more than dashboards:
• Power BI Dashboards & Business Intelligence
• Data Cleaning, Transformation & Modeling
• Automation (Excel, Python, Google Apps Script)
• SQL Data Management & Optimization
• Financial & Operational Reporting
• Advanced Data Analysis & Forecasting
🎯 Why Choose Intersect Analytics?
✔ We fix your data first—no garbage insights
✔ We build end-to-end solutions (data → insights → action)
✔ We combine business + technical expertise
✔ We design dashboards that are clear, interactive, and decision-focused
✔ We help you reduce costs, improve efficiency, and grow revenue
📈 Business Impact
🚀 Improve production efficiency
📉 Reduce downtime and operational losses
💰 Optimize material costs
📊 Make faster, data-driven decisions
📩 Ready to transform your manufacturing data?
📞 +254 723 632207 (WhatsApp Available)
💡 Intersect Analytics — Turning operational data into business performance.
0
16
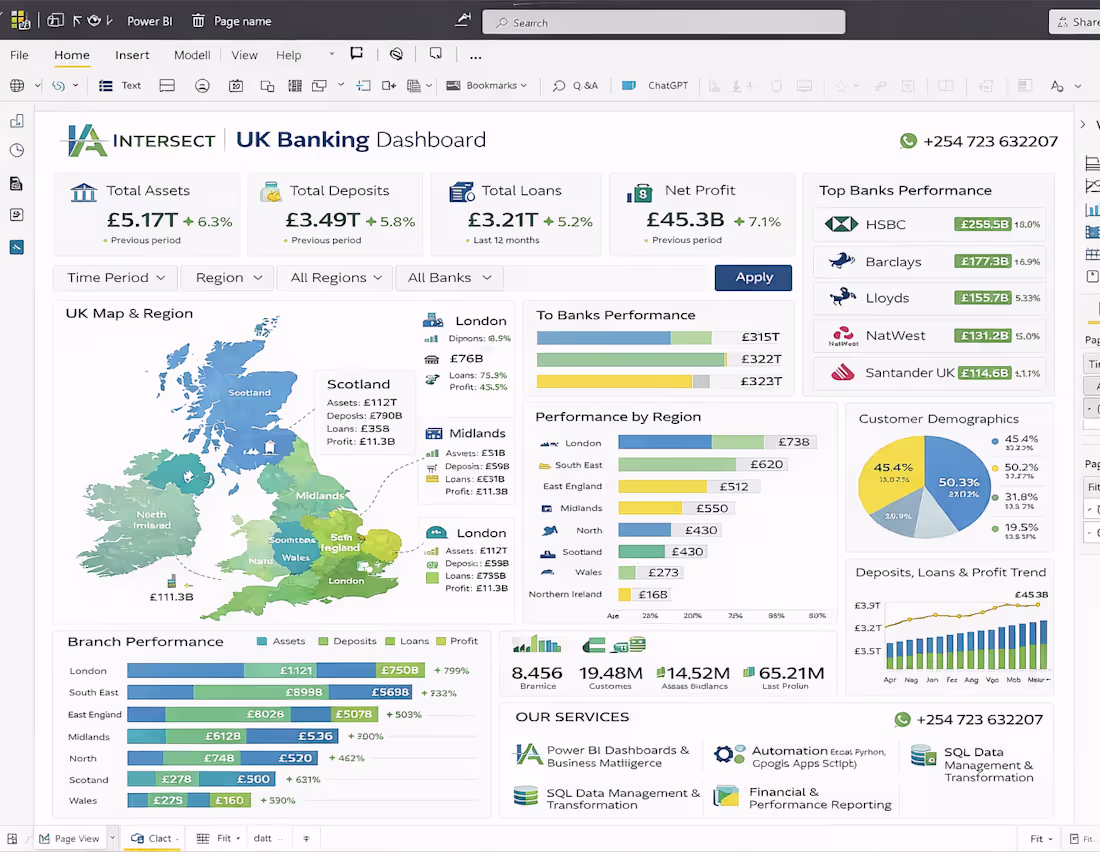
🚀 UK Banking Dashboard | Advanced Financial Analytics by Intersect Analytics
Unlock the full potential of your financial data with our Power BI–driven UK Banking Dashboard, designed to deliver real-time insights, performance tracking, and data-driven decision-making for financial institutions and analysts.
📊 Comprehensive Banking Performance Insights
Our dashboard provides a 360° view of the UK financial sector, covering:
✔ Total Assets, Deposits, Loans & Profitability
✔ Top Bank Performance (HSBC, Barclays, Lloyds, NatWest, Santander)
✔ Regional Performance Analysis (London, Midlands, Scotland & more)
✔ Customer Demographics & Behavior Insights
✔ Branch-Level Performance Tracking
✔ Trends in Deposits, Loans & Profit Growth
With interactive filters (Time Period, Region, Bank), users can drill down into specific insights instantly.
⚙️ Built with Industry-Leading Tools
This solution is powered by:
📊 Power BI – Interactive dashboards & advanced visual analytics
🗄️ SQL – Data extraction, transformation & modeling
🐍 Python – Automation & advanced data processing
📈 Excel – Financial modeling & reporting
💼 Our Core Services
At Intersect Analytics, we deliver end-to-end data solutions:
🔹 Business Intelligence Dashboards (Power BI & Tableau)
🔹 Data Cleaning, Transformation & Modeling
🔹 Automation (Excel, Python, Google Apps Script)
🔹 SQL Database Management & Optimization
🔹 Financial & Operational Reporting
🎯 Why Choose Intersect Analytics?
✔ Data-first approach – Clean, structured, and reliable data foundation
✔ Custom-built solutions – Tailored to your business needs
✔ Advanced analytics expertise – Finance + Data combined
✔ Actionable insights – Not just dashboards, but real business value
✔ Professional, scalable delivery
📈 Business Impact
🚀 Improve financial visibility and reporting accuracy
📊 Make faster, data-driven decisions
💰 Identify growth opportunities and optimize profitability
🔍 Gain deeper insights into customers and regional performance
📩 Get Started Today
Ready to transform your financial data into powerful insights?
📞 +254 723 632207 (WhatsApp Available)
📍 Intersect Analytics
💡 Intersect Analytics — Turning complex data into clear financial intelligence.
0
17
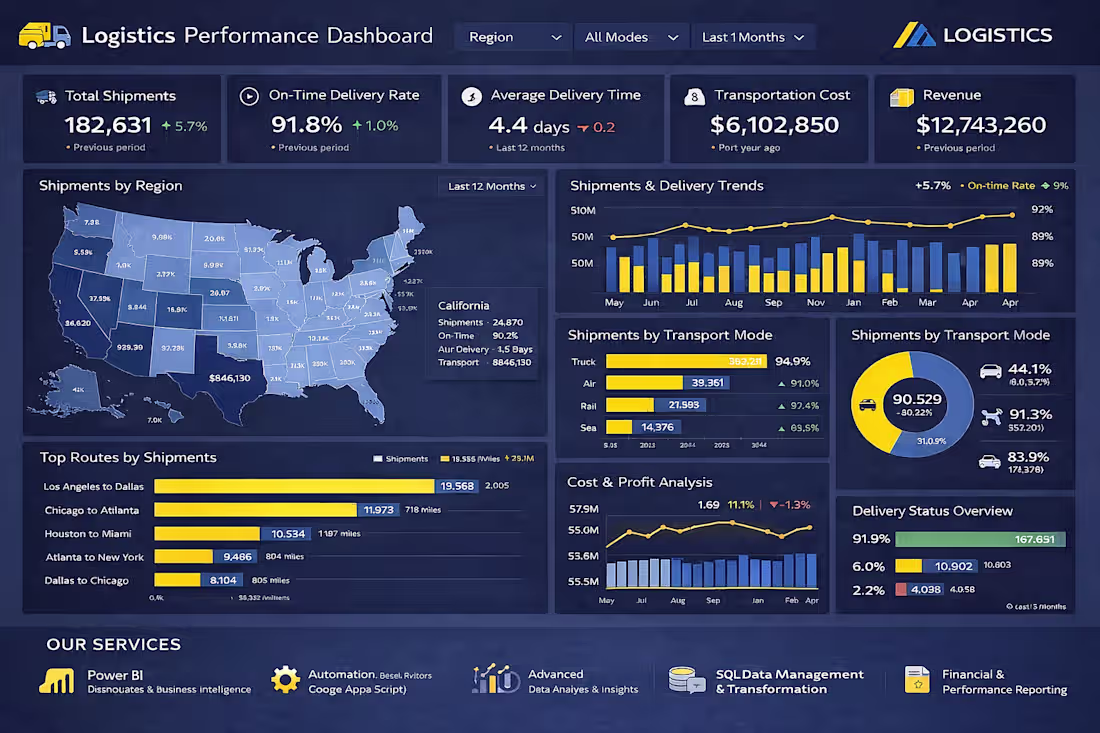
🚛 Transform Your Logistics Data into Actionable Insights
Still relying on spreadsheets and manual reports to track your operations?
It’s time to upgrade to smart, real-time analytics.
At Intersect Analytics, we help logistics and operations teams gain full visibility into their performance with powerful, interactive dashboards.
📊 What You Get
✔ Real-time tracking of shipments, delivery performance & costs
✔ Clear insights on top routes, regions & transport modes
✔ Monitoring of on-time delivery and operational efficiency
✔ Data-driven decisions that improve profitability & performance
🛠️ Our Core Services
📊 Power BI Dashboards & Business Intelligence
⚙️ Automation (Excel, Python, Google Apps Script)
🗄️ SQL Data Management & Transformation
🧠 Advanced Data Analysis & Insights
📈 Financial & Operational Reporting
🎯 Why Choose Intersect Analytics?
✔ We clean and structure your data first (no “garbage in, garbage out”)
✔ We deliver end-to-end solutions—from raw data to insights
✔ We build custom dashboards tailored to your business
✔ We focus on results, not just visuals
💡 The Result
🚀 Faster decision-making
📉 Reduced operational inefficiencies
📈 Improved delivery performance
💰 Better cost control and profitability
📩 Ready to take control of your logistics performance?
📞 +254 723 632207 (WhatsApp Available)
💡 Intersect Analytics — Turning data into decisions.
0
21
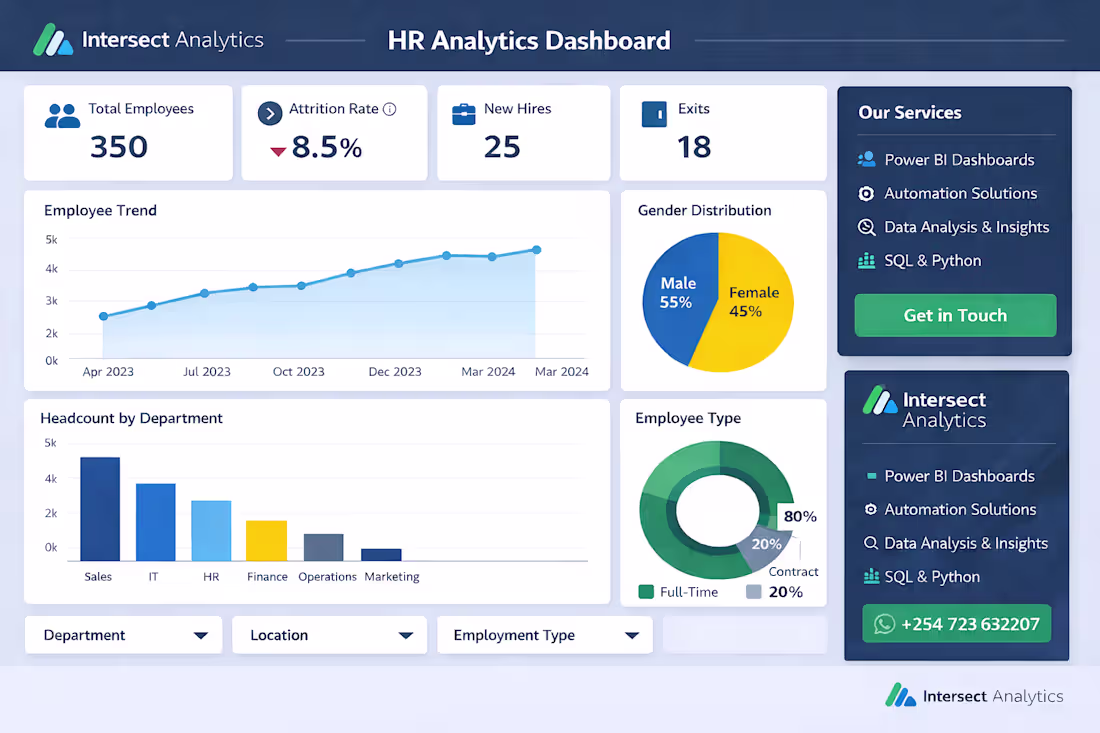
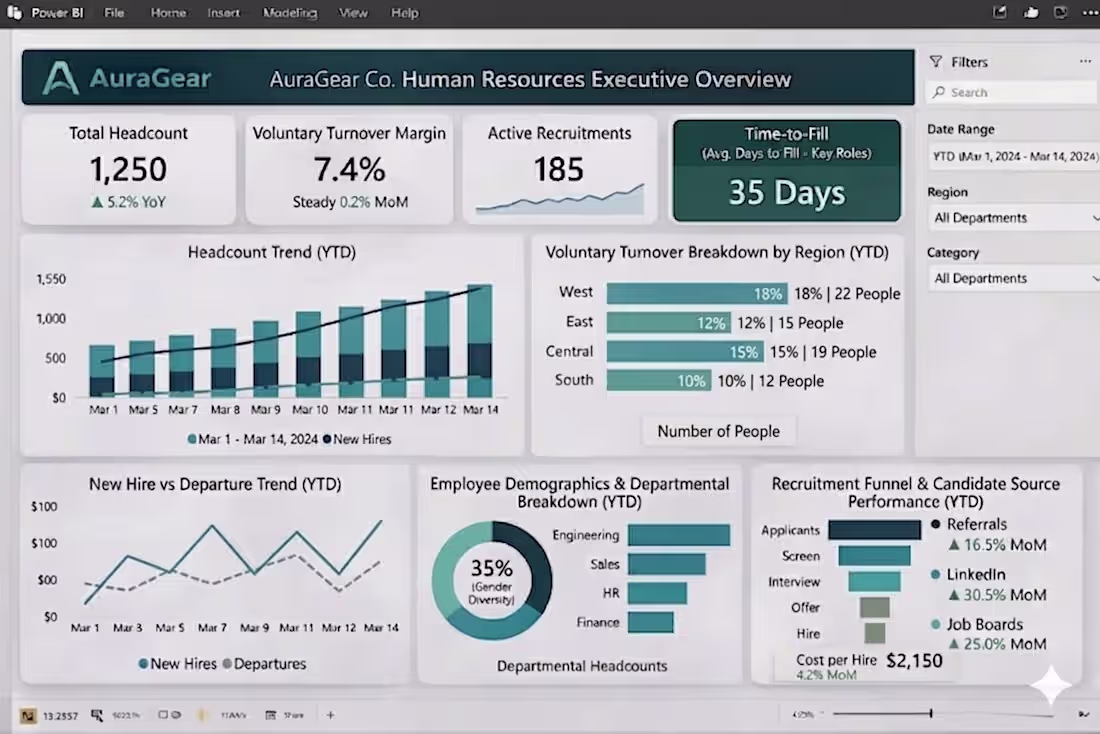
🚀 HR Analytics Dashboard – Case Study by Intersect Analytics
We recently developed a professional HR Analytics Dashboard designed to help organizations gain full visibility into their workforce and make smarter, data-driven HR decisions.
🔍 The Challenge
Many organizations struggle with scattered HR data, manual reporting, and limited insights into employee performance, attrition, and hiring trends.
💡 Our Solution
At Intersect Analytics, we built a centralized Power BI dashboard that delivers:
• Real-time visibility into employee headcount, attrition, and hiring
• Clear insights on department performance and workforce distribution
• Actionable analytics on salary, gender balance, and employee types
• Interactive filters for deeper, customized analysis
🛠️ Our Core Services
📊 Power BI Dashboards & Business Intelligence
⚙️ Automation (Excel, Python, Google Apps Script)
🧠 Data Analysis & Business Insights
🗄️ SQL Data Management & Transformation
📈 Financial & Operational Reporting
🎯 Impact Delivered
✔ Reduced manual HR reporting time
✔ Improved visibility into workforce trends
✔ Enabled faster, data-driven HR decisions
✔ Identified key areas for retention and optimization
🌟 Why Choose Intersect Analytics?
✔ We focus on data quality first (clean, structured, reliable data)
✔ We deliver end-to-end solutions (from data cleaning to dashboards)
✔ We combine business understanding with technical expertise
✔ We build solutions tailored to your organization—not templates
📩 Let’s transform your HR data into actionable insights
📞 +254 723 632207 (WhatsApp Available)
💡 Intersect Analytics — Turning data into decisions.
0
15
🚀 Turn Your Data Into Profit with Intersect Analytics
Are you sitting on data but struggling to turn it into real business value?
At Intersect Analytics, we help you unlock insights, automate workflows, and make smarter decisions—faster.
💼 What We Do
We provide end-to-end data and automation solutions tailored to your business:
📊 Power BI Dashboards – Interactive, real-time dashboards for sales, finance & operations
⚙️ Automation Solutions – Using Google Apps Script, Python & Excel to eliminate repetitive work
🧠 Data Analysis & Insights – Turn raw data into clear, actionable strategies
🗄️ SQL & Data Management – Clean, structure, and optimize your data systems
📈 Financial Modeling & Reporting – Forecasting, budgeting, and performance tracking
🎯 Problems We Solve
❌ Manual reporting taking hours (or days)
❌ Scattered, unstructured data
❌ Lack of clear business insights
❌ Poor decision-making due to limited visibility
✅ We replace all that with automated, intelligent systems
🔍 Our Approach
At Intersect Analytics, we don’t just build dashboards—we solve problems:
Understand your business goals
Clean and structure your data
Build powerful, automated systems
Deliver clear dashboards & insights
Support data-driven decision making
🌟 Why Choose Us?
✔ Save 10+ hours weekly through automation
✔ Reduce errors and improve accuracy
✔ Get real-time visibility into your business
✔ Tailored solutions—not one-size-fits-all
✔ Strong expertise in finance, analytics & business strategy
📣 Who We Work With
Businesses • Startups • Accountants • Analysts • Retailers • SMEs
📩 Let’s Work Together
Ready to transform your data into a competitive advantage?
📞 +254 723 632207
📍 Intersect Analytics
💡 Work smarter. Automate faster. Grow stronger.
0
13
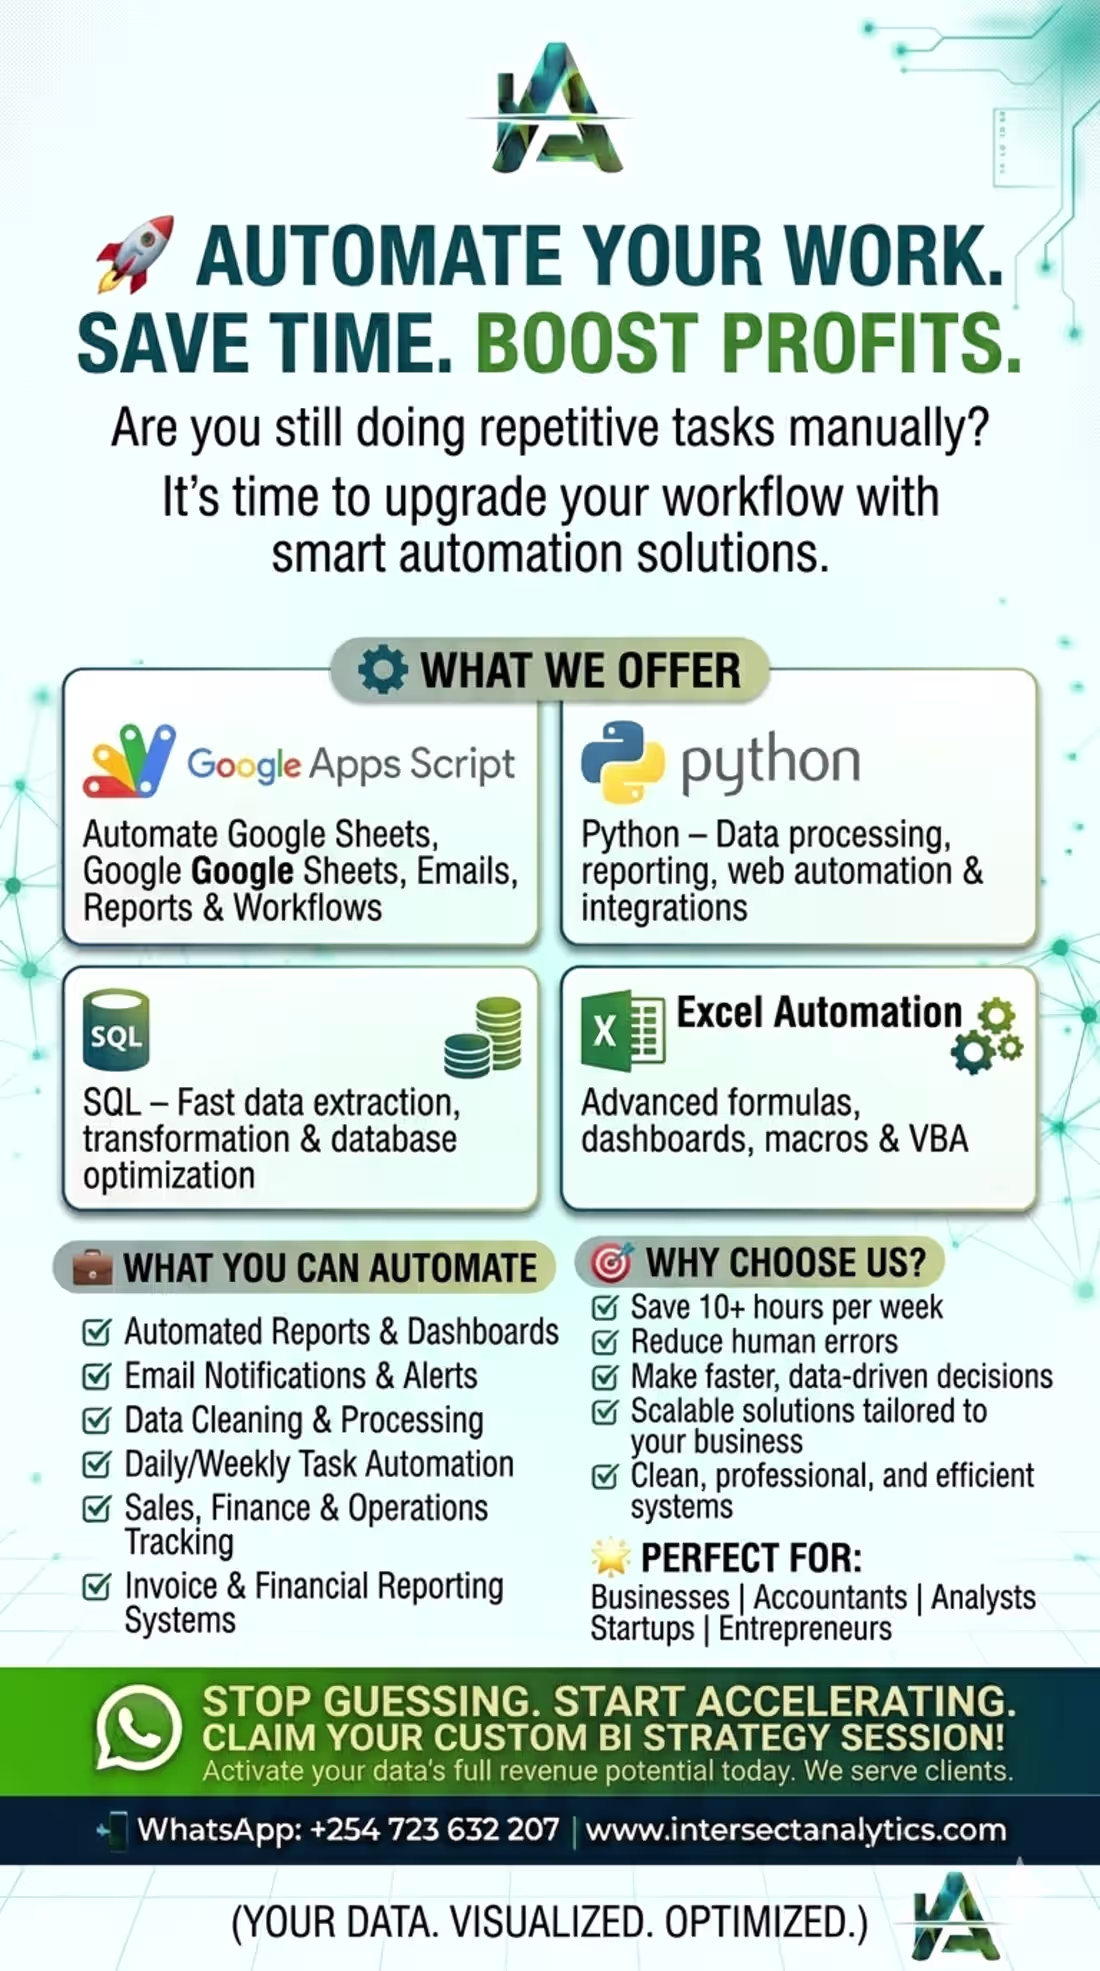
🚀 AUTOMATE YOUR WORK. SAVE TIME. BOOST PROFITS.
Are you still doing repetitive tasks manually?
It’s time to upgrade your workflow with smart automation solutions.
⚙️ WHAT WE OFFER
We help businesses and professionals automate processes using:
✅ Google Apps Script – Automate Google Sheets, Emails, Reports & Workflows
✅ Python – Data processing, reporting, web automation & integrations
✅ SQL – Fast data extraction, transformation & database optimization
✅ Excel Automation – Advanced formulas, dashboards, macros & VBA
💼 WHAT YOU CAN AUTOMATE
📊 Automated Reports & Dashboards
📧 Email Notifications & Alerts
📂 Data Cleaning & Processing
🔄 Daily/Weekly Task Automation
📈 Sales, Finance & Operations Tracking
🧾 Invoice & Financial Reporting Systems
🎯 WHY CHOOSE US?
✔ Save 10+ hours per week
✔ Reduce human errors
✔ Make faster, data-driven decisions
✔ Scalable solutions tailored to your business
✔ Clean, professional, and efficient systems
🌟 PERFECT FOR:
Businesses | Accountants | Analysts | Startups | Entrepreneurs
📩 LET’S AUTOMATE YOUR WORK TODAY!
Transform your operations with smart, reliable automation.
Contact us now to get started!
👉 Intersect Analytics
📞 +254 723 632207
0
27
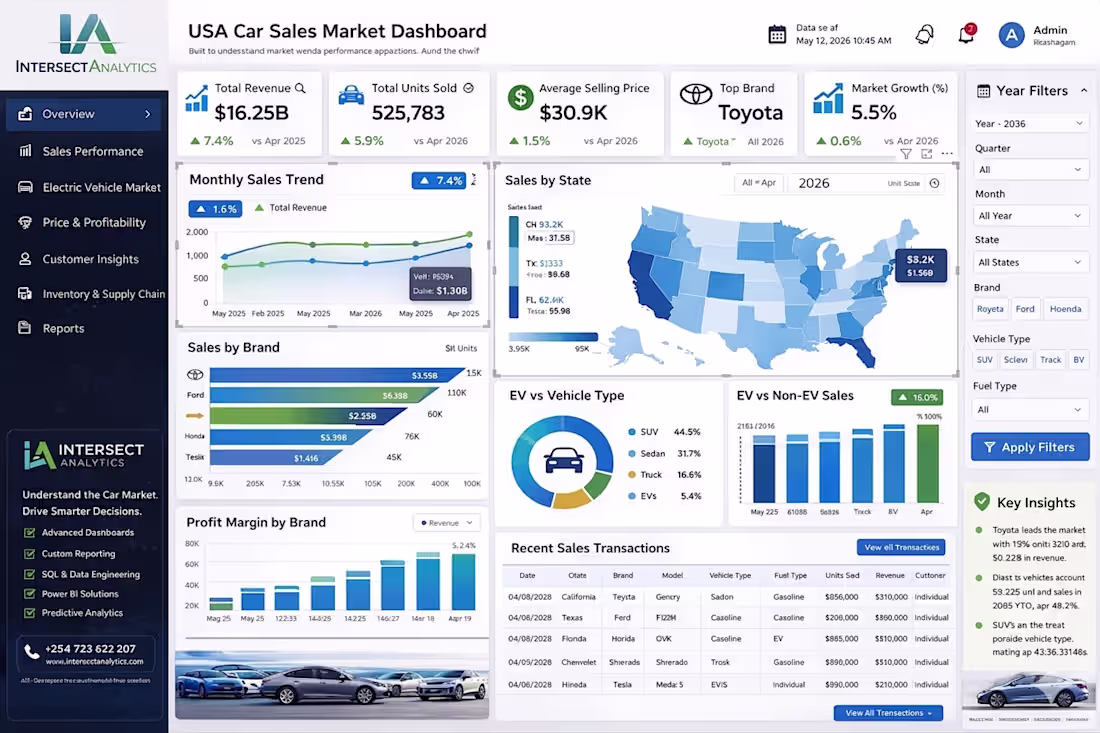
Drive Smarter Decisions with Automotive Analytics
Understanding the car market requires more than just numbers—it demands clear, actionable insights. At Intersect Analytics, we design Power BI car sales dashboards that provide a complete view of performance across regions, models, and customer segments.
Our solutions help you:
✔ Track sales trends and revenue performance
✔ Analyze top-performing vehicle models and brands
✔ Understand customer buying behavior
✔ Monitor profitability and pricing strategies
✔ Identify growth opportunities across markets
💡 From dealerships to large-scale distributors, we turn automotive data into strategic insights that drive sales and profitability.
🚀 Intersect Analytics – Accelerating decisions with data.
1
26
📊 Transform Your Data into Real Business Value.
At Intersect Analytics, we help businesses move beyond spreadsheets and static reports to powerful, decision-driven insights.
We specialize in:
✔ Interactive dashboards (Power BI, Excel)
✔ Data analysis & visualization
✔ Financial and operational analytics
✔ Automation using SQL & Python
✔ Predictive and performance insights
💡 Our focus is simple—turn complex data into clear, actionable intelligence that drives growth and efficiency.
🚀 Intersect Analytics – Where Data Meets Decisions.
2
55
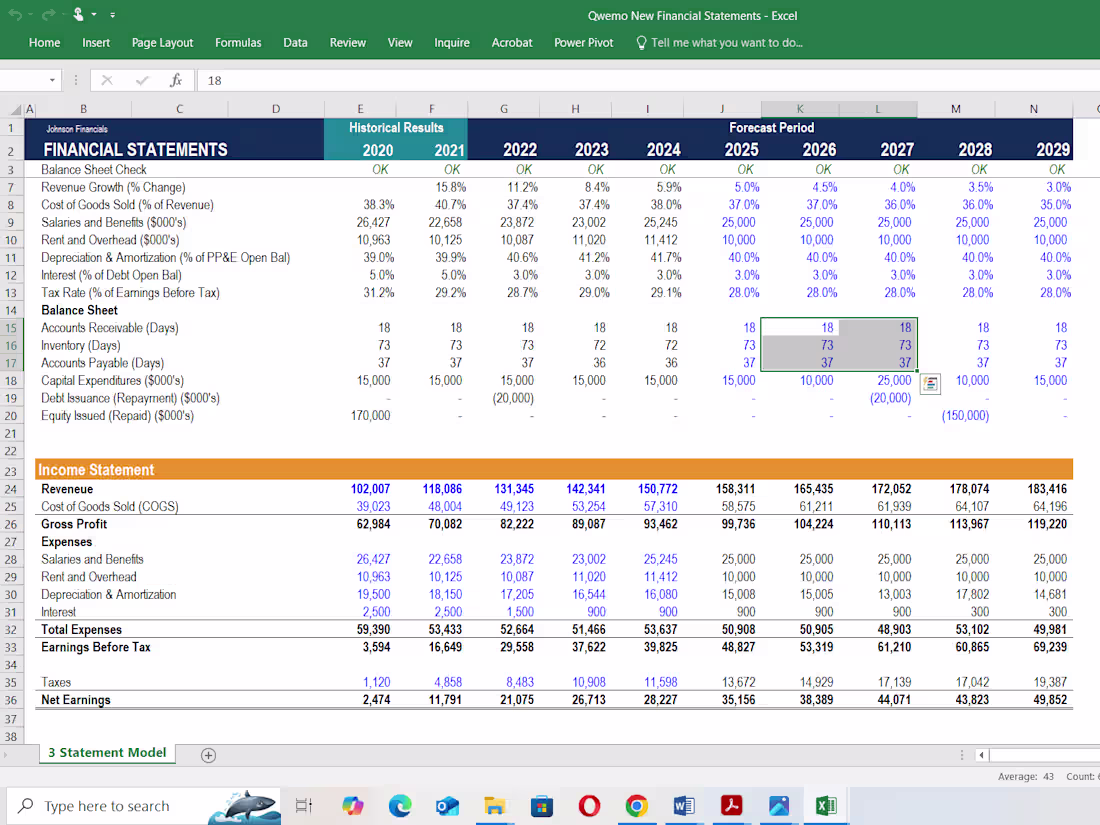
Comprehensive Financial Model for Strategic Decision-Making
0
6
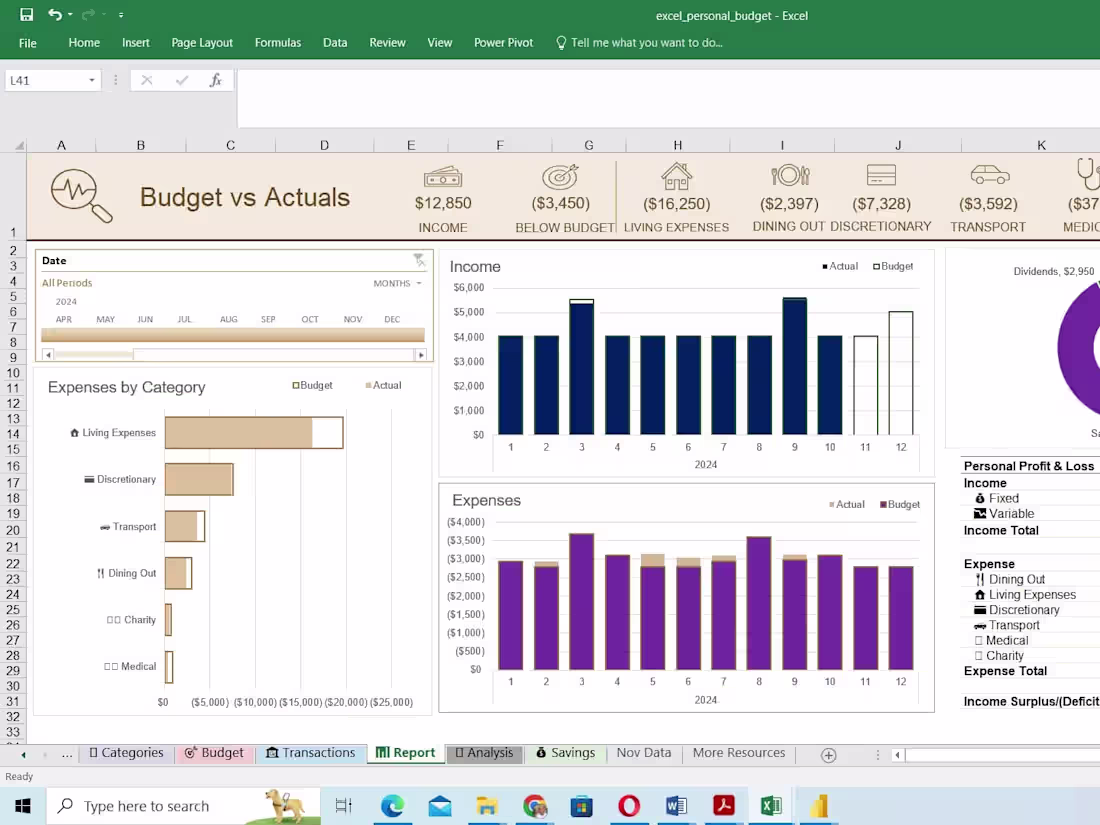
Budget vs. Actual Analysis: Tracking Financial Performance & Var
0
7
Sales Dashboard
0
3