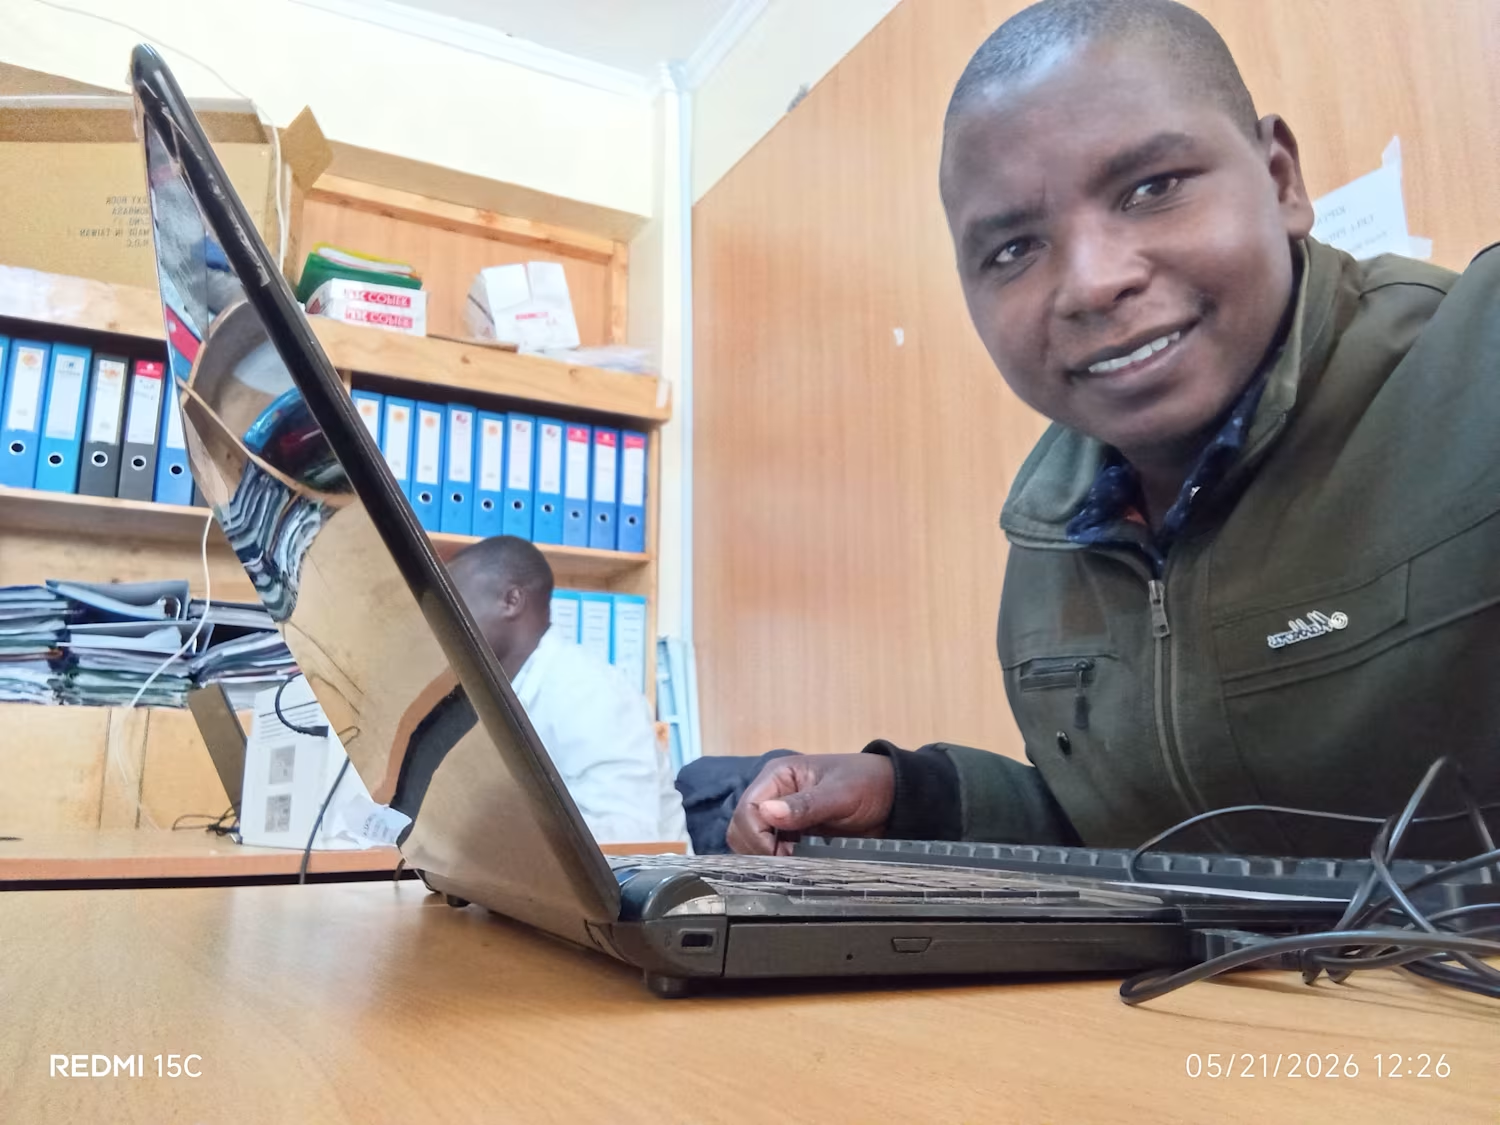
Rotich Peter
Excel & Access Specialist | Data Entry Expert
Profile in progress
Rotich is building their profile!

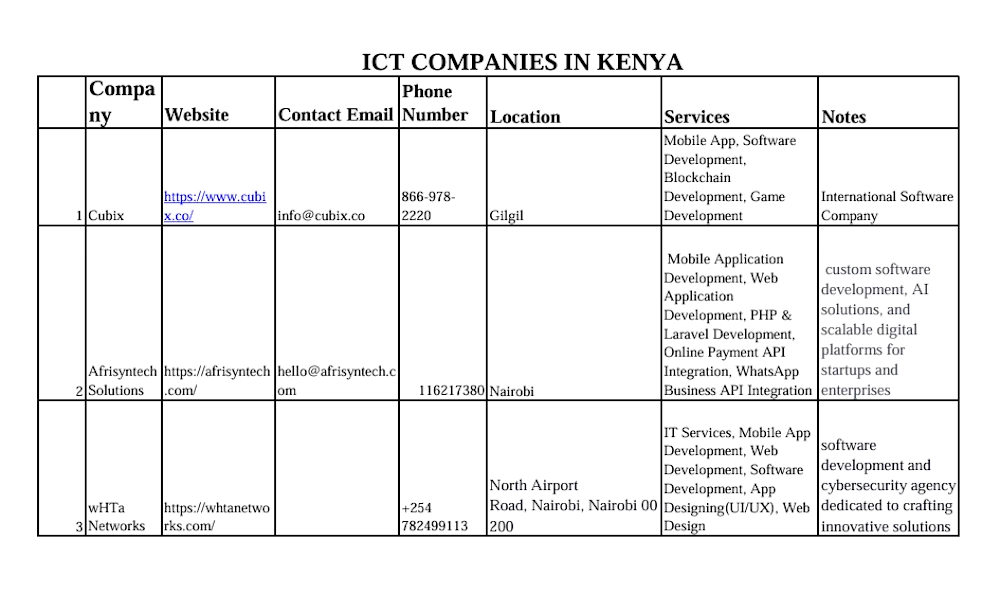
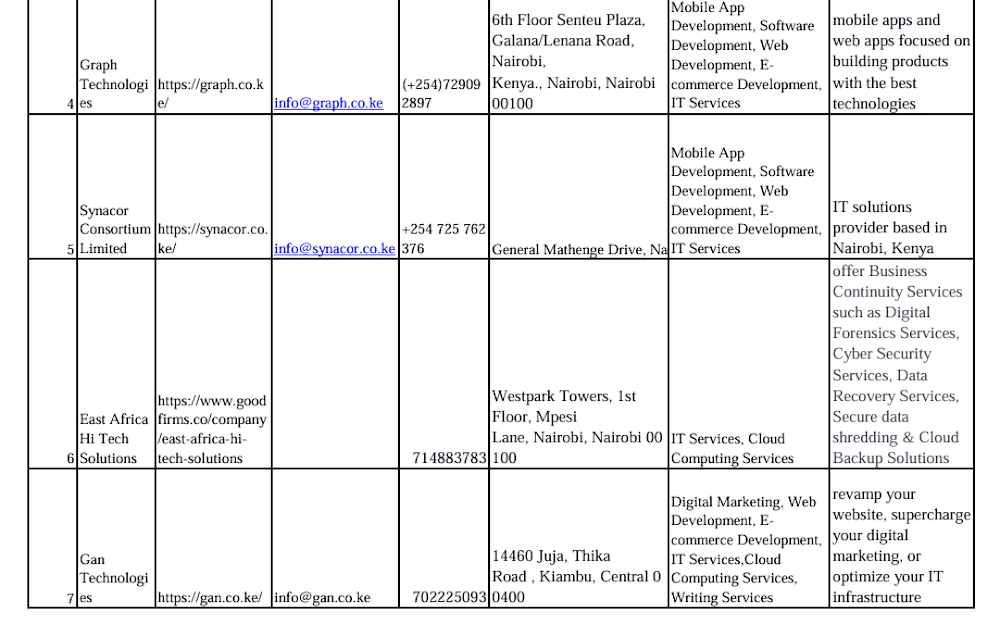
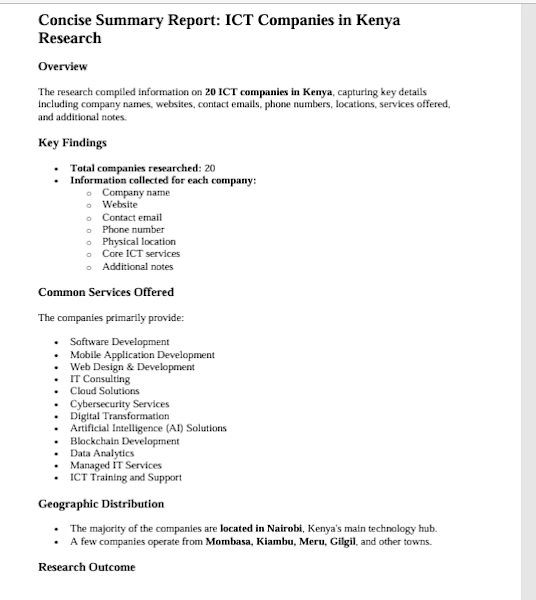
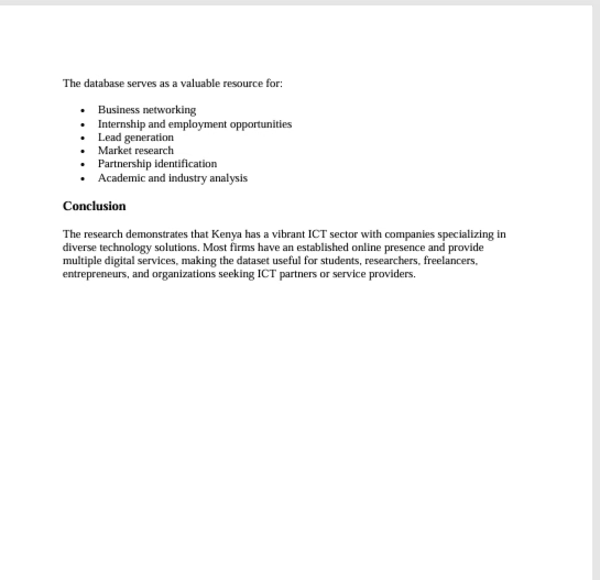
The research compiled information on
20 ICT companies in Kenya, capturing key details including company
names, websites, contact emails, phone numbers, locations, services offered,
and additional notes.


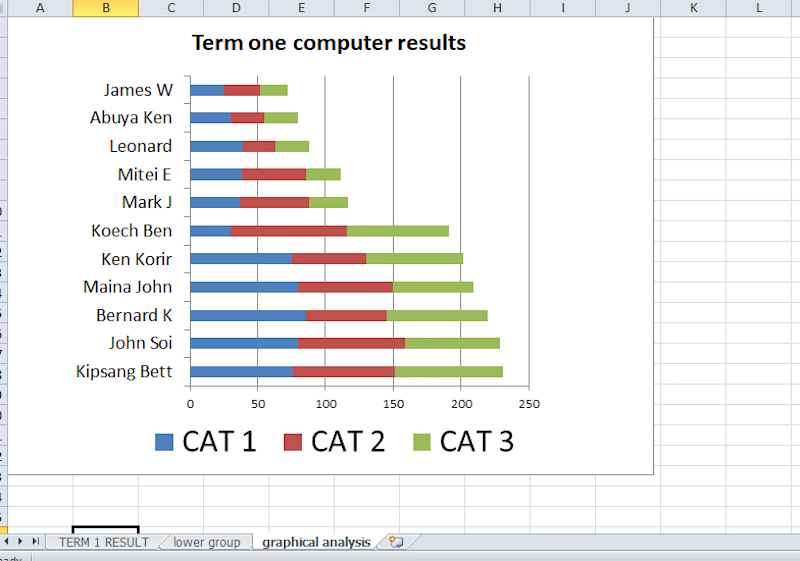
Designed a Microsoft Excel dashboard to analyze and visualize student performance using stacked bar charts. The project involved organizing assessment data, creating professional charts, and presenting results in a clear, easy-to-understand format. This showcases my Excel skills in data analysis, visualization, and reporting.