
Ricardo Gawlinski
Data Analyst & BI Developer
New to Contra
Ricardo is ready for their next project!
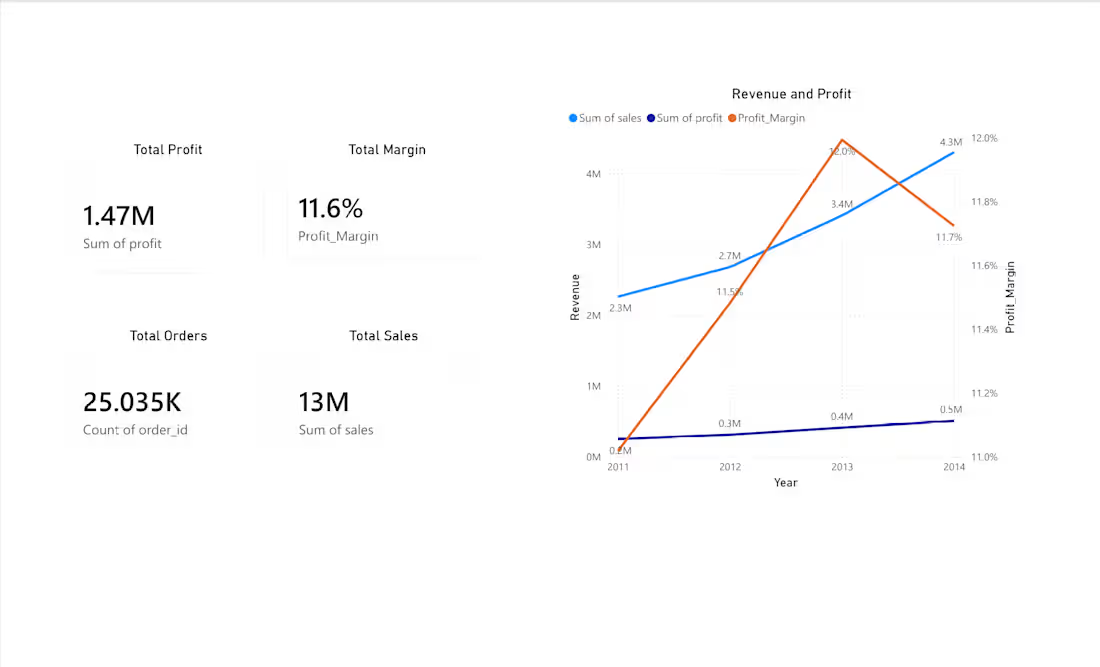
Superstore Sales & Profitability Dashboard
Interactive Power BI dashboard analyzing 4 years of retail sales data. Includes revenue and profit tracking by region, category, and product, profit margin analysis to identify high-revenue vs high-margin segments, and top/bottom performing product breakdowns. Built to help retail businesses spot where they're making money — not just where they're generating sales.
Tools: Power BI, DAX
1
80
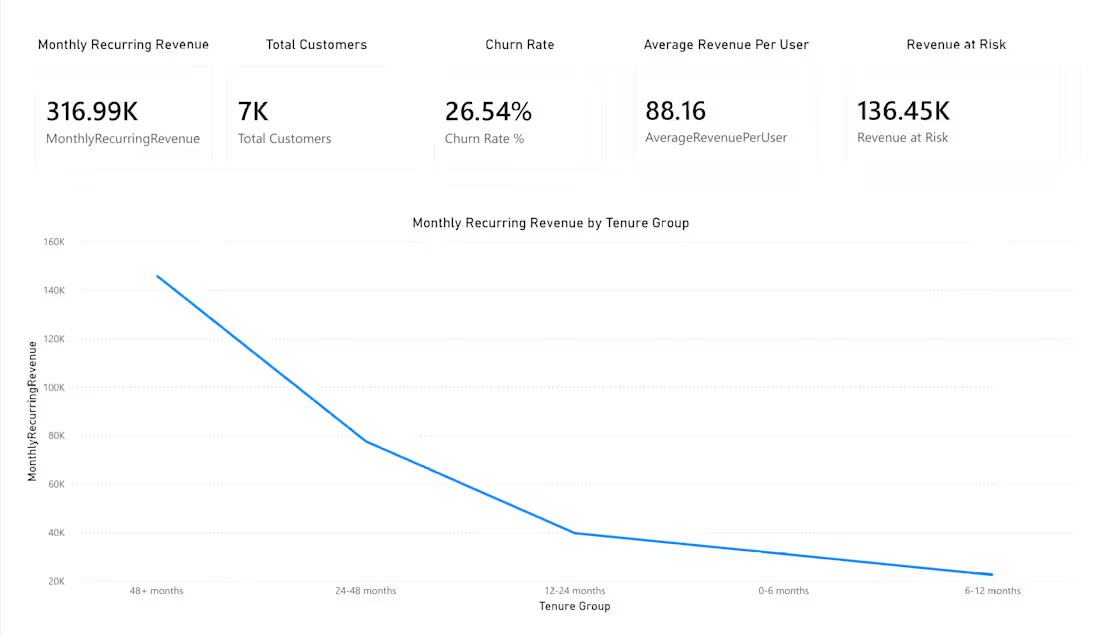
Telco Customer Churn & Revenue Dashboard
Interactive Power BI dashboard analyzing subscription customer data to identify churn drivers and revenue risk. Includes Monthly Recurring Revenue (MRR), Customer Lifetime Value (LTV), and churn rate broken down by contract type, tenure, payment method, and service usage — plus a "Revenue at Risk" metric flagging MRR from high-risk, still-active customers. Built to help subscription businesses understand not just who's leaving, but why.
Tools: Power BI, DAX
1
82
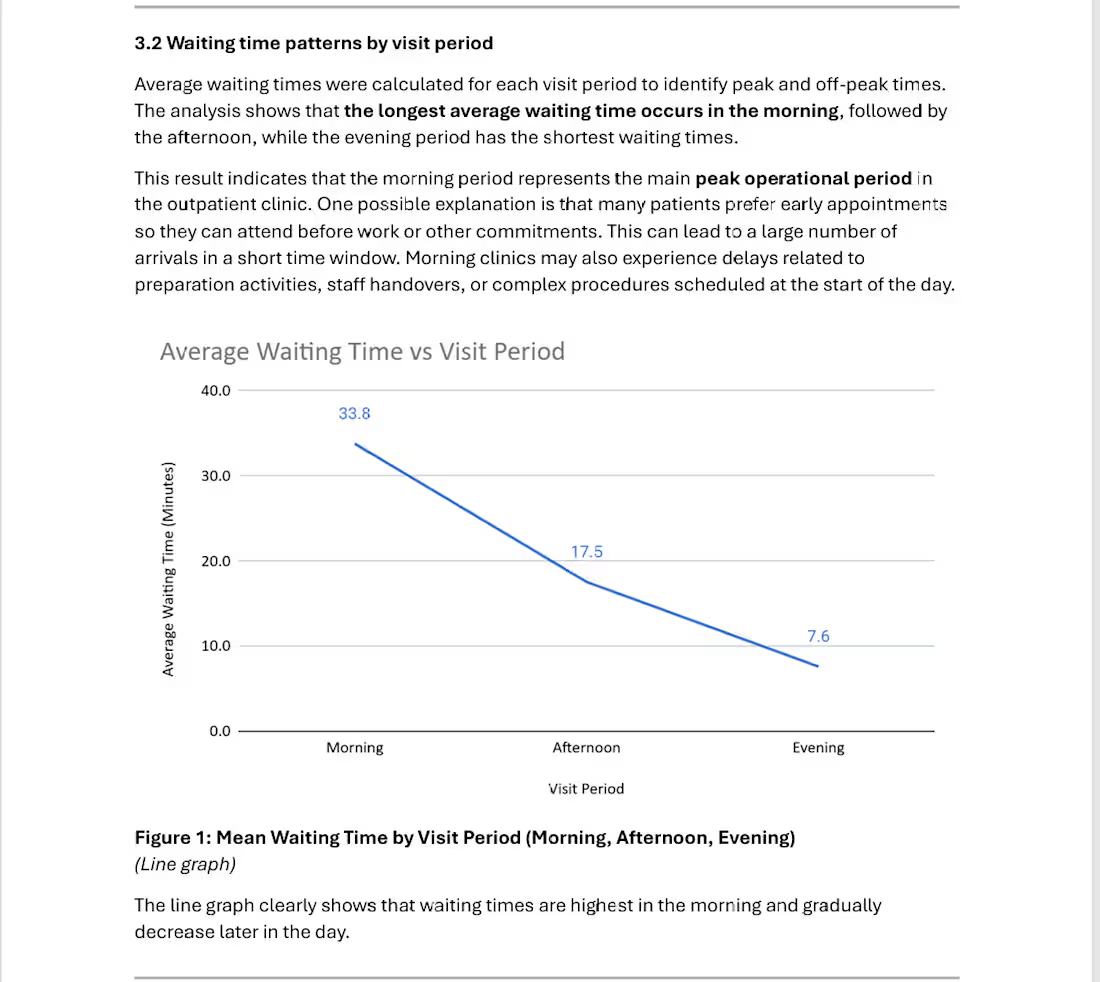
Data Exploration for Hospital Outpatient Wait Time Optimisation
0
85
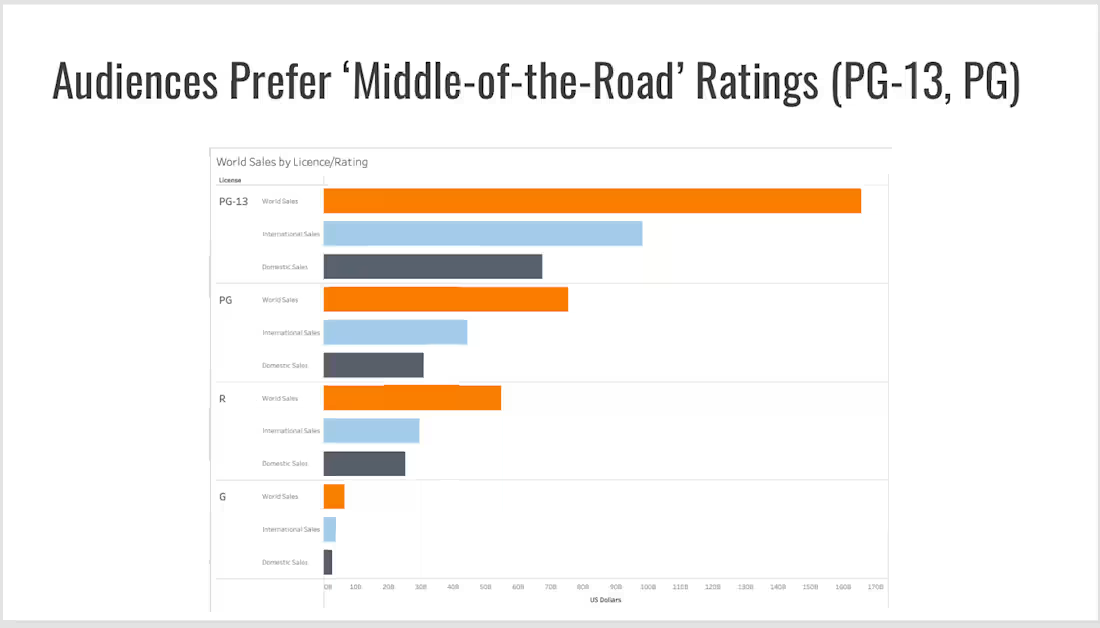
Conducted a deep-dive market analysis using Kaggle’s Hollywood movie database to identify the underlying patterns behind high-grossing box office hits
1
112