
RAJAOUL HAQUE Mahi
Power BI & Excel Data Analyst | Dashboard & Insights
New to Contra
RAJAOUL HAQUE is ready for their next project!

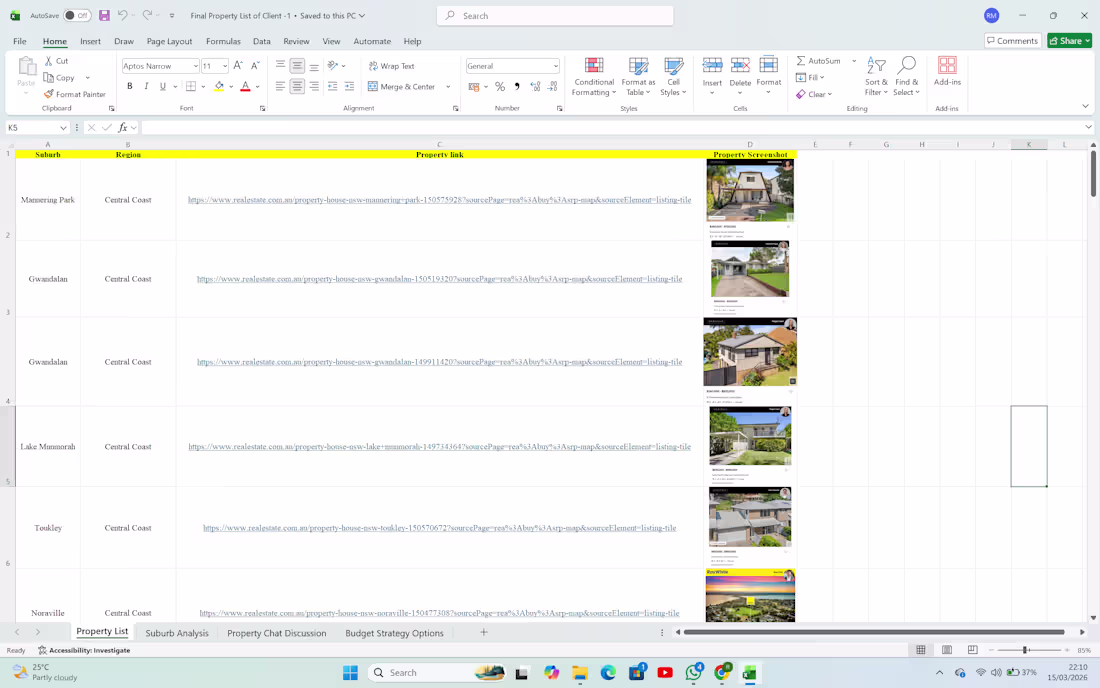
Property Research in Excel
0
12
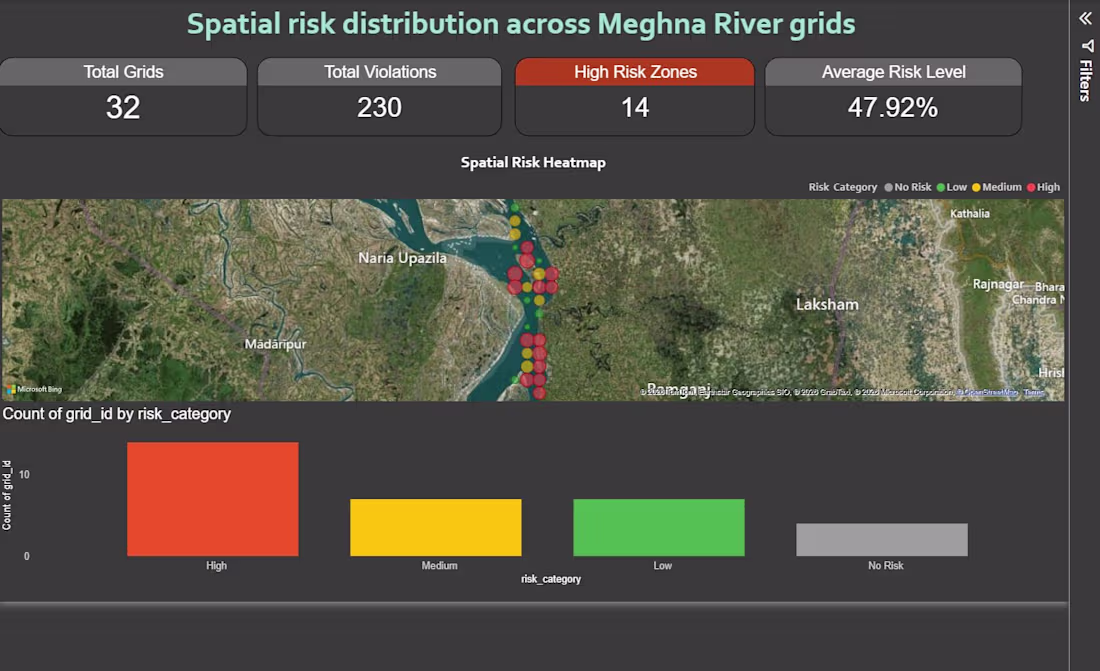
Spatial Risk Distribution across Meghna River
0
12
Full Project Video
0
16
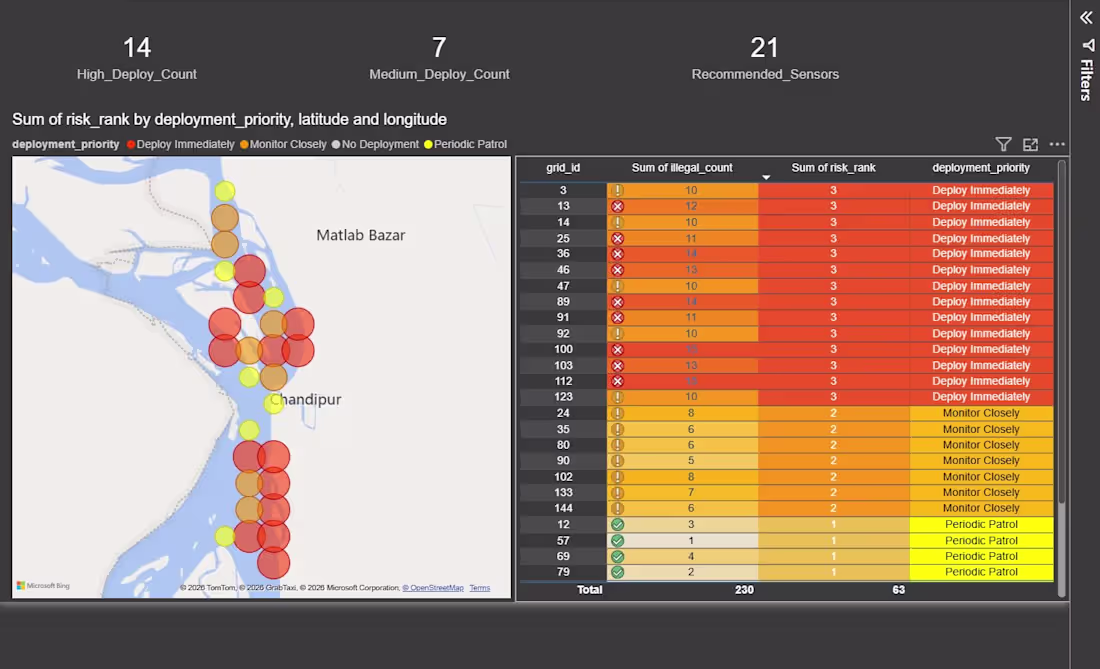
This Power BI dashboard analyzes risk levels in the Meghna River related to Hilsa fish conservation. It visualizes locations with high illegal fishing activity using geospatial mapping and risk ranking. The dashboard helps identify priority areas where monitoring sensors or patrol deployment is needed to protect Hilsa breeding zones and reduce illegal fishing. Key insights include high, medium, and low deployment priorities based on risk score and incident counts.
0
22