
Qadir bux
Junior Data Analyst |Python · SQL · Excel | Google Certified
New to Contra
Qadir is building their profile!
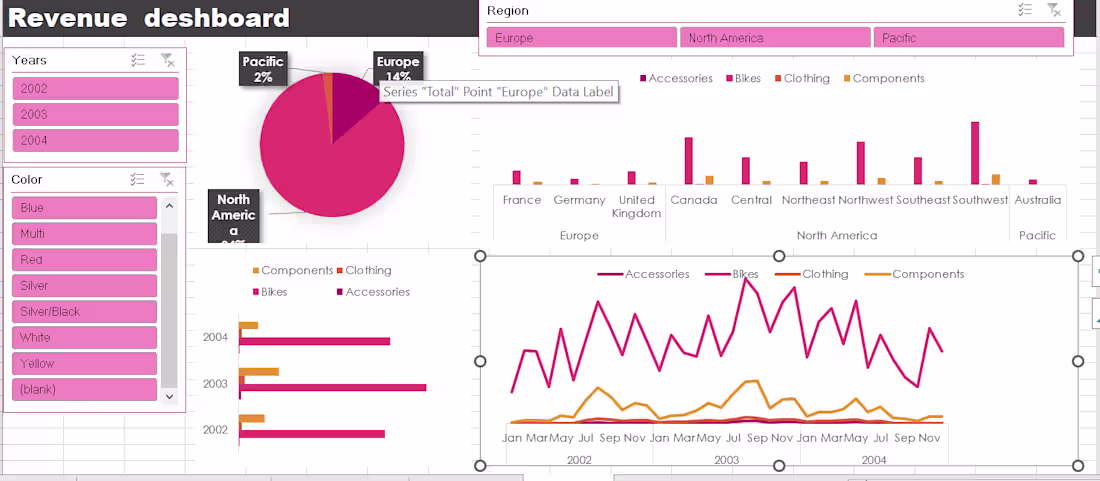
Revenue Dashboard | Power BI
A retail business was sitting on 3 years of sales data across multiple regions but had zero visibility into what was actually performing.
I built an interactive Power BI Revenue Dashboard covering Europe, North America & Pacific markets, breaking down sales by Bikes, Accessories, Clothing & Components across 2002–2004.
The dashboard features dynamic slicers for year and color filters, a regional pie breakdown, bar comparisons, and a trend line — giving decision-makers instant answers without touching a single spreadsheet.
Result: Clean, clickable insights from messy multi-region data ready for boardroom or client presentation
0
6