
Princess Kpoanee
Data Analyst building interactive dashboards with Excel, BI
New to Contra
Princess is building their profile!

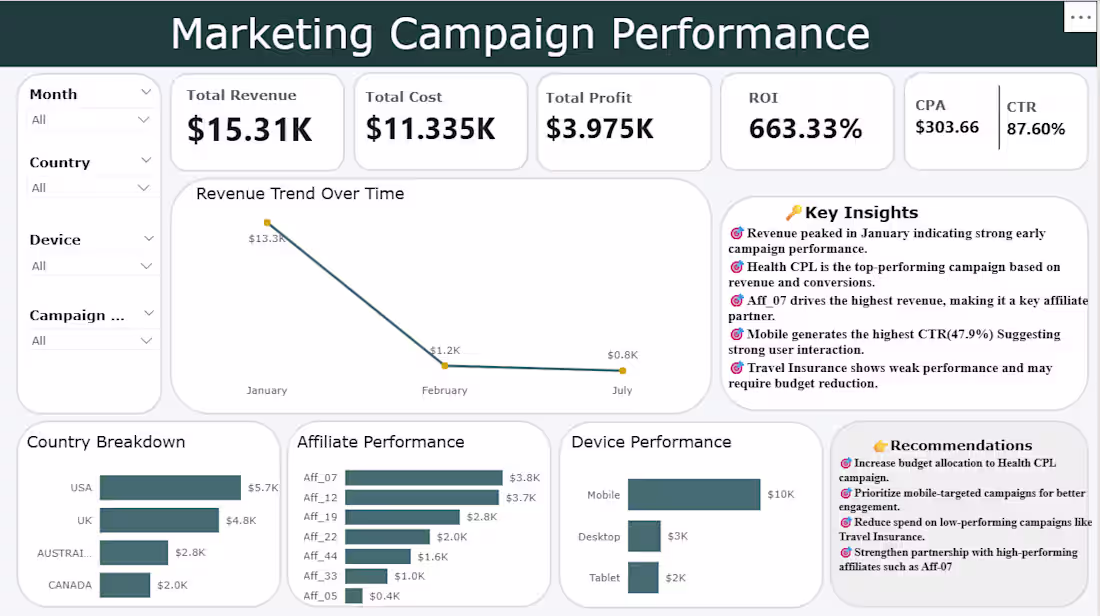
Marketing Campaign Performance Dashboard (Power BI)I built a marketing analytics dashboard in Power BI to track campaign performance across revenue, cost, and engagement.
Key KPIs:
Total Revenue: $15.31K
Total Cost: $11.34K
Total Profit: $3.98K
ROI: 663.33%
CPA: $303.66
CTR: 87.60%
Dashboard features:
Revenue trend analysis (Jan–Jul)
Country performance breakdown (USA leading at $5.7K)
Affiliate performance tracking (top: Aff_07 at $3.8K)
Device analysis (Mobile dominates at $10K)
Interactive slicers (Month, Country, Device, Campaign)
Insights + recommendations panel for decision-making
This project helped me understand how raw marketing data can be transformed into actionable business insights using Power BI.
Open to feedback and improvements.
0
4
Hi, I'm Princess
📊 What I can help you with:
Interactive Power BI dashboards
Sales and business performance analysis
Data cleaning and transformation (Excel / Power Query)
KPI tracking and reporting
Visual insights for better decision-making
0
22
Hi, my name is Princess, and I am a freelance Data Analyst specializing in turning raw data into clear, actionable insights that help businesses make smarter decisions.
I work with Power BI and Excel to build interactive dashboards, clean and organize data, and create visual reports that make performance tracking simple and effective.
🎯 My goal:
To help businesses understand their data clearly, identify trends, and improve performance through simple, powerful visuals and insights.
🛠️ Tools I use:
Power BI • Microsoft Excel • Power Query • Basic DAX • Data Visualization
I am passionate about using data to solve real business problems and deliver insights that drive growth and efficiency.
0
18
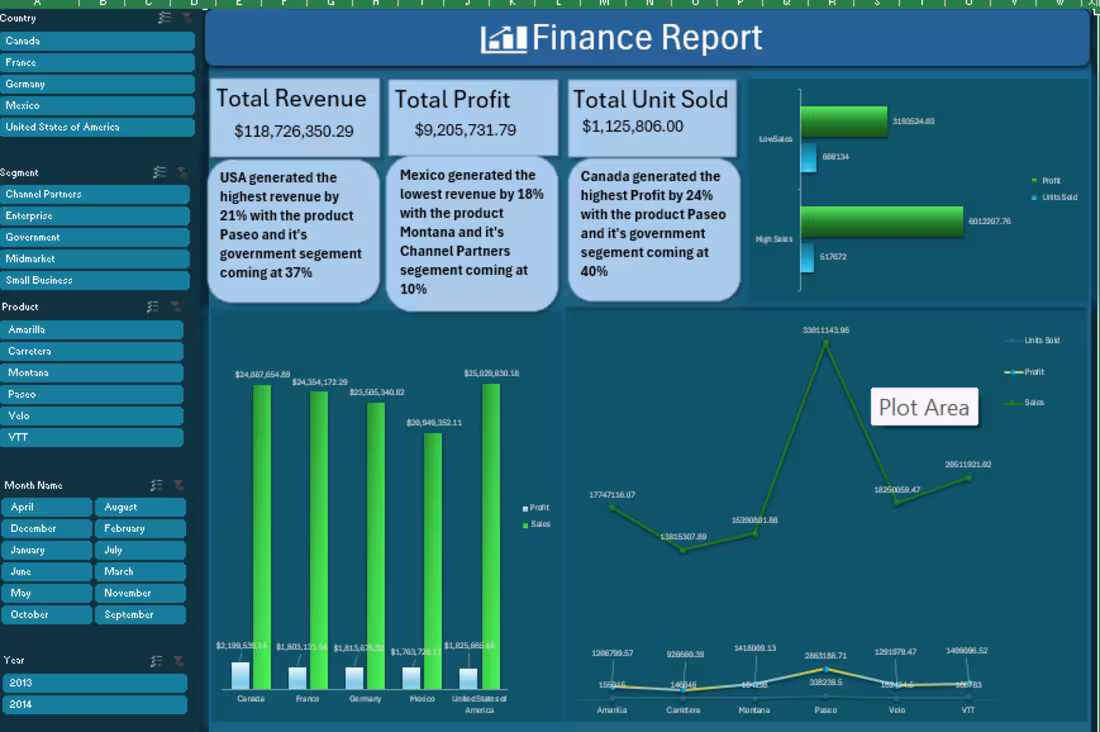
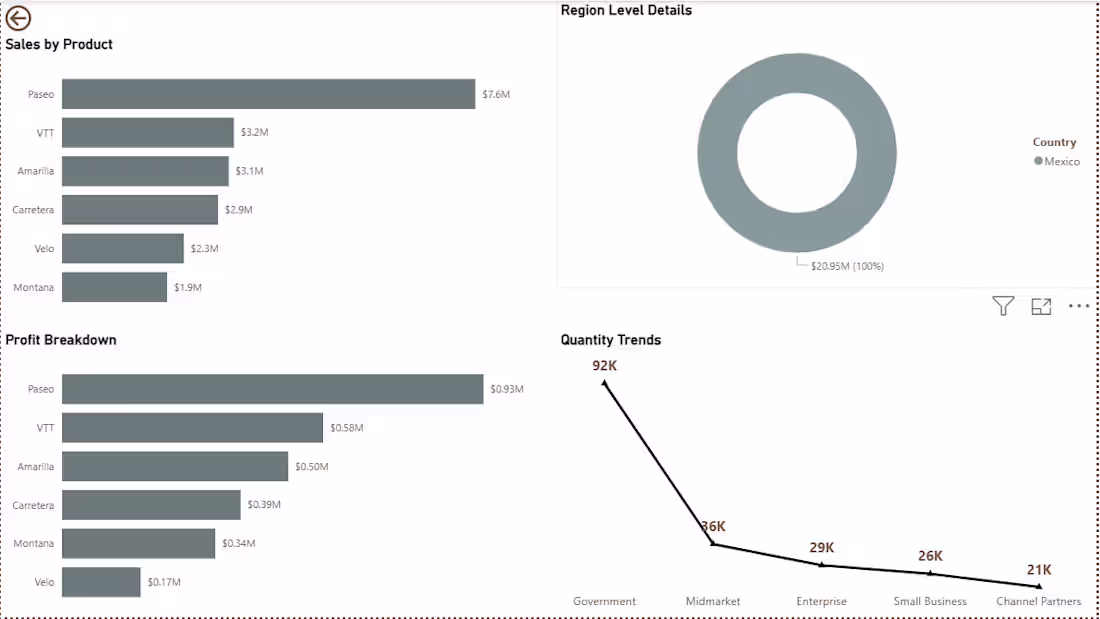
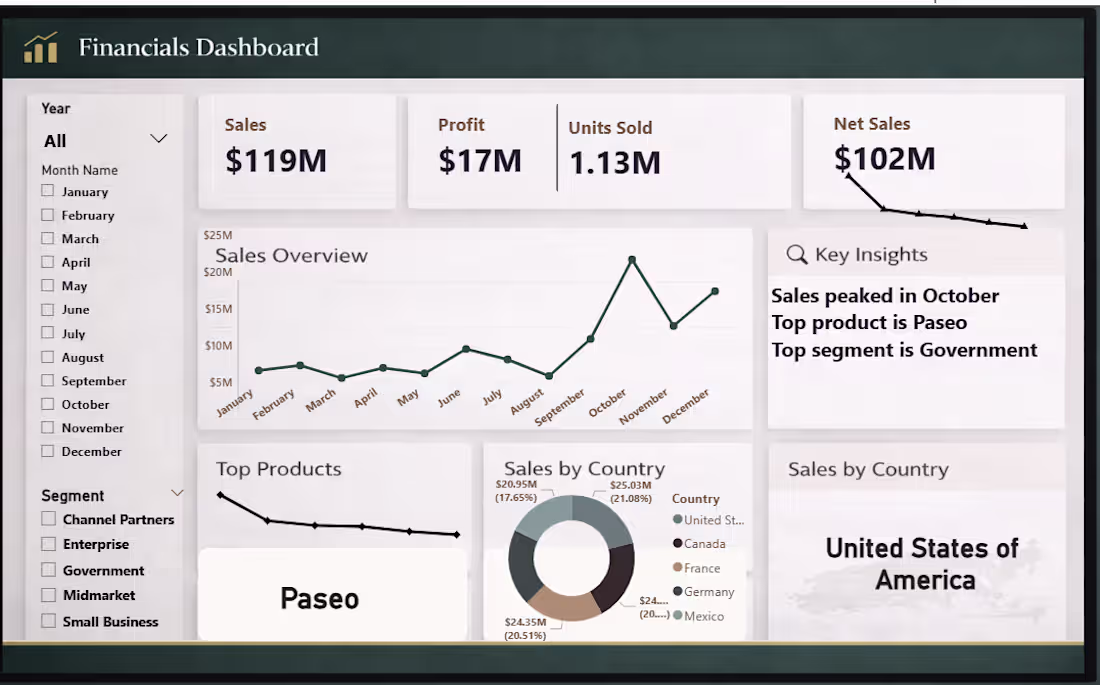
Power BI Finance dashboard analyzing $118M+ revenue across 5 countries, 6 products and multiple segments. Features KPI cards for Total Revenue, Total Profit and Units Sold with detailed country and product performance insights.
1
21
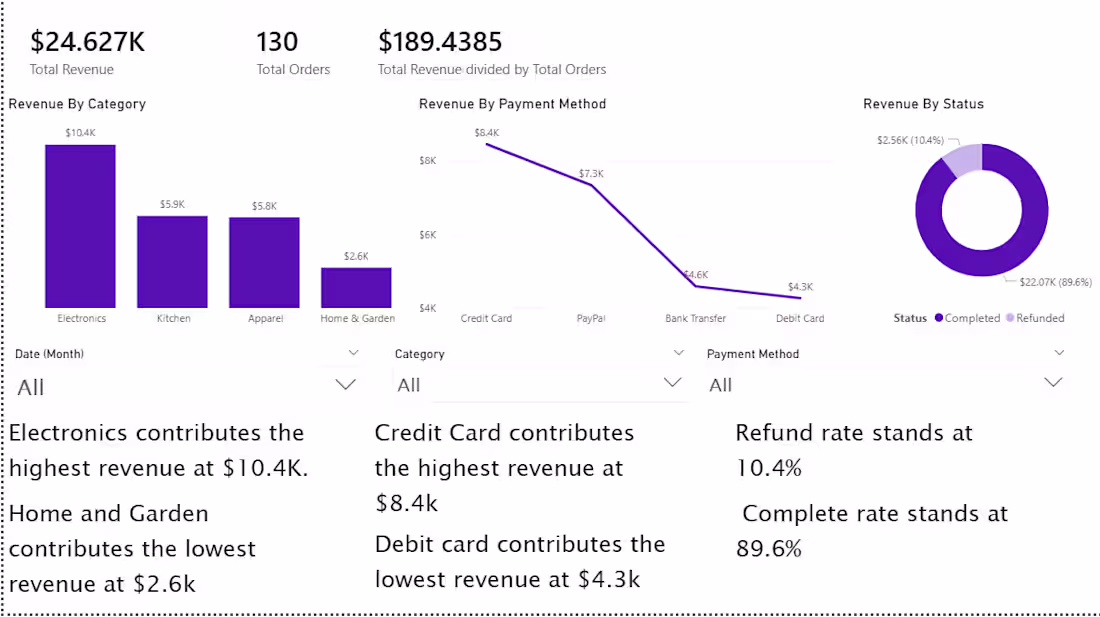
Power BI Sales Dashboard analyzing revenue by category, payment method and order status. Features KPI cards showing $24.6K total revenue, 130 orders and insight cards highlighting Electronics as top performer at $10.4K.
0
18
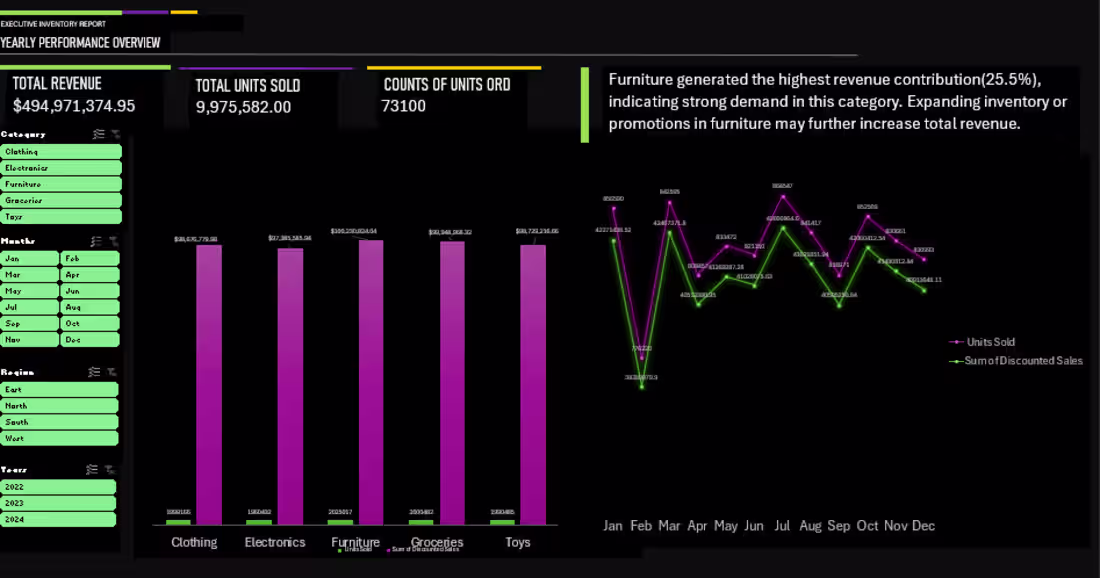
An interactive Excel dashboard analyzing 70,000+ rows of retail sales data across 5 categories, 4 regions and 3 years. Features KPI cards, dynamic slicers and business insight cards showing Furniture generated the highest revenue at 25.5%.
1
31
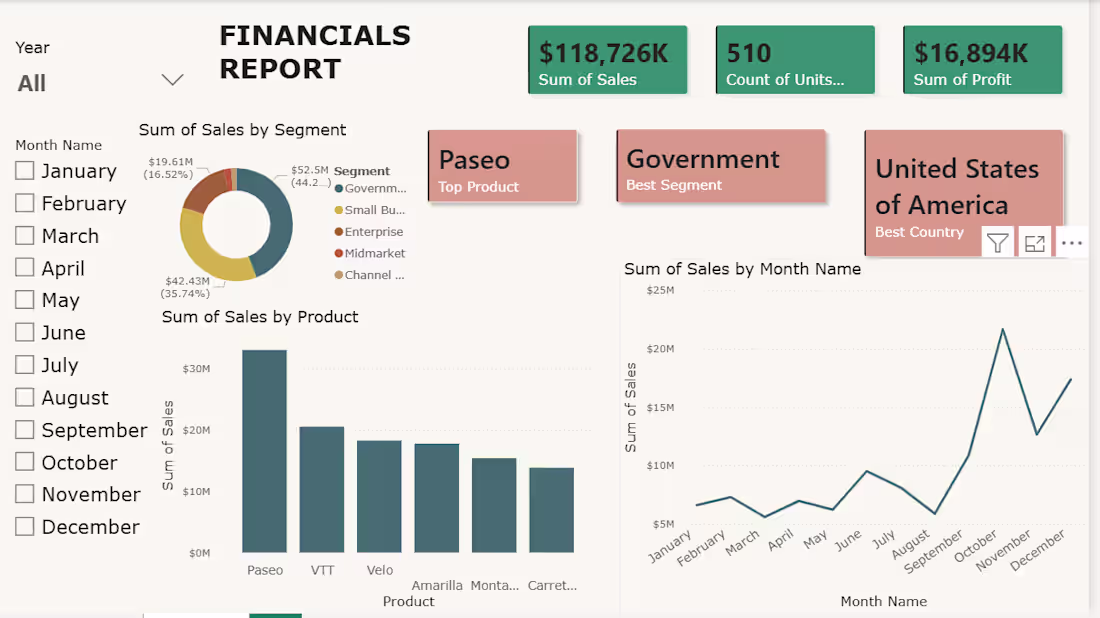
An interactive Power BI dashboard analyzing financial performance across segments, products and countries. Features KPI cards showing $118,726K total sales, $16,894K profit and 510 units with dynamic filters.
1
38