
Piyush Yadav
Data Analyst | Power BI | Excel | SQL | Python
- 1
- Followers


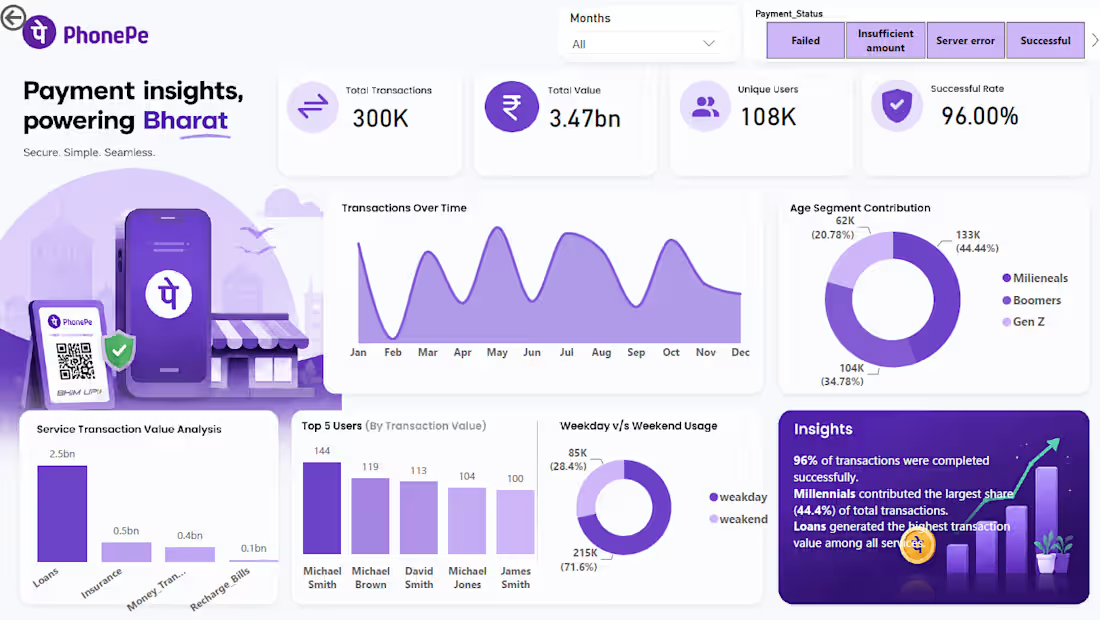
Built an interactive Power BI dashboard to analyze PhonePe transaction data and identify important business trends.
Key features:
• Transaction KPIs
• State-wise analysis
• Transaction trends
• User analysis
• Interactive filters and slicers
• DAX measures
• Power Query transformations
• Data visualization
The dashboard converts raw transaction data into an interactive business intelligence report for identifying trends and performance patterns.
Tools: Power BI, Power Query, DAX
0
26
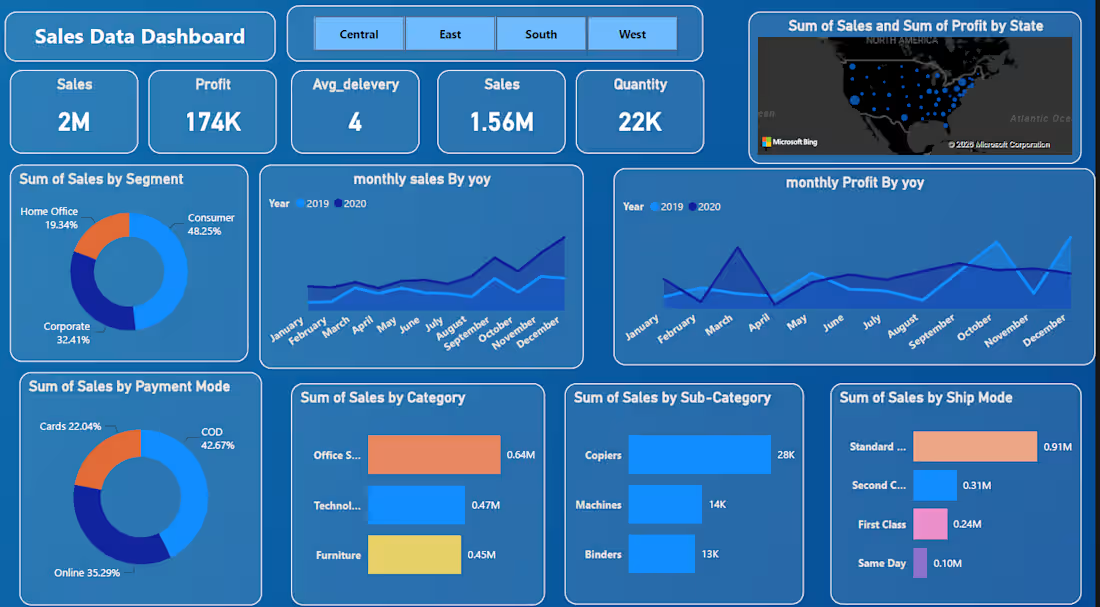
Sales & Profit Performance Dashboard
Developed an interactive Power BI dashboard to analyze sales, profit, quantity, customer segments, products, and regional performance.
The dashboard transforms raw sales data into actionable business insights through interactive KPIs, charts, filters, and trend analysis.
Key Features:
Total sales and total profit KPIs
Quantity and average delivery analysis
Region-wise performance
Category and sub-category analysis
Customer segment analysis
Payment method analysis
Shipping mode performance
Monthly sales and profit trends
Interactive filters for regions and time periods
DAX-based KPI calculations
Tools: Power BI • Power Query • DAX • Data Visualization
This dashboard helps businesses understand sales performance, identify profitable categories, analyze customer segments, and track trends for better decision-making.
0
22
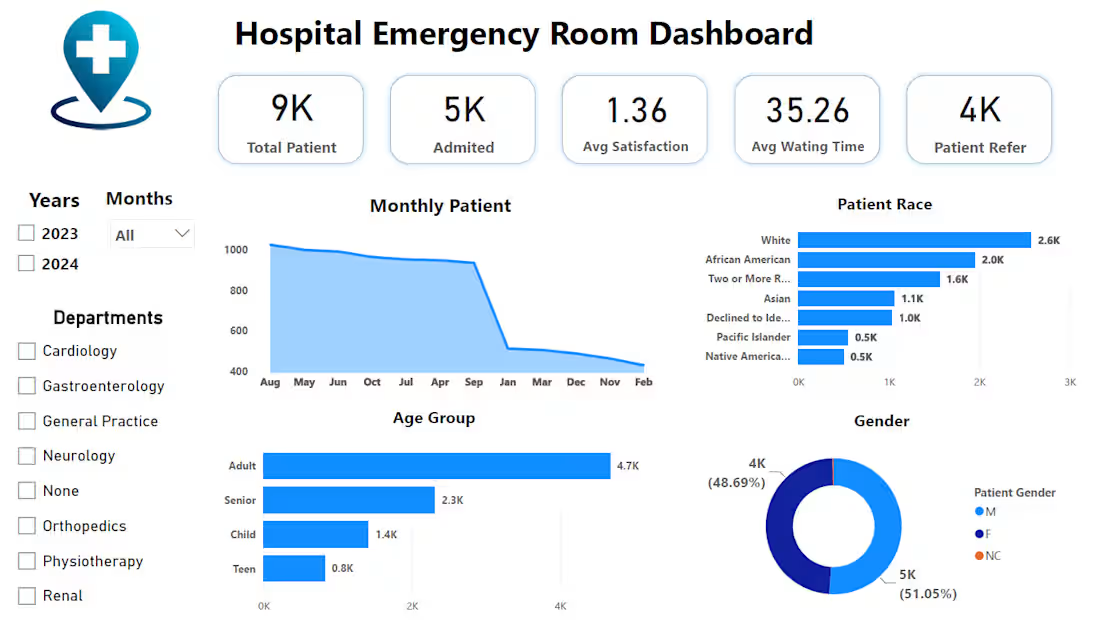
Hospital Emergency Room Analytics Dashboard
Developed an interactive Power BI dashboard to analyze hospital emergency room performance and patient experience.
The dashboard provides a clear view of patient volume, admissions, satisfaction, waiting time, demographics, and department-level trends.
Key Features:
Patient volume and monthly trends
Average waiting time analysis
Patient satisfaction tracking
Age group analysis
Patient race and gender analysis
Department and referral analysis
Admission analysis
Interactive year, month, and department filters
KPI cards for key performance indicators
Tools: Power BI • Power Query • DAX • Data Visualization
The dashboard helps healthcare teams identify patient trends, monitor service performance, and make data-driven decisions.
🥉 Sales & Profit Performance Dashboard
Description:
Developed an interactive Power BI dashboard to analyze sales, profit, quantity, customer segments, products, and regional performance.
The dashboard transforms raw sales data into actionable business insights through interactive KPIs, charts, filters, and trend analysis.
Key Features:
Total sales and total profit KPIs
Quantity and average delivery analysis
Region-wise performance
Category and sub-category analysis
Customer segment analysis
Payment method analysis
Shipping mode performance
Monthly sales and profit trends
Interactive filters for regions and time periods
DAX-based KPI calculations
Tools: Power BI • Power Query • DAX • Data Visualization
This dashboard helps businesses understand sales performance, identify profitable categories, analyze customer segments, and track trends for better decision-making.
0
36

i am recently build ML project in this i am completed three project in this we can do data preprocessing data cleaning feature engineering and then model training and evaluating after this i was deployed it into google so anyone can use this
0
69