The network for creativity
Join 1.25M professional creatives like you
Connect with clients, get discovered, and run your business 100% commission-free
Creatives on Contra have earned over $150M and we are just getting started
Back to feedPost

Sales & Profit Performance Dashboard
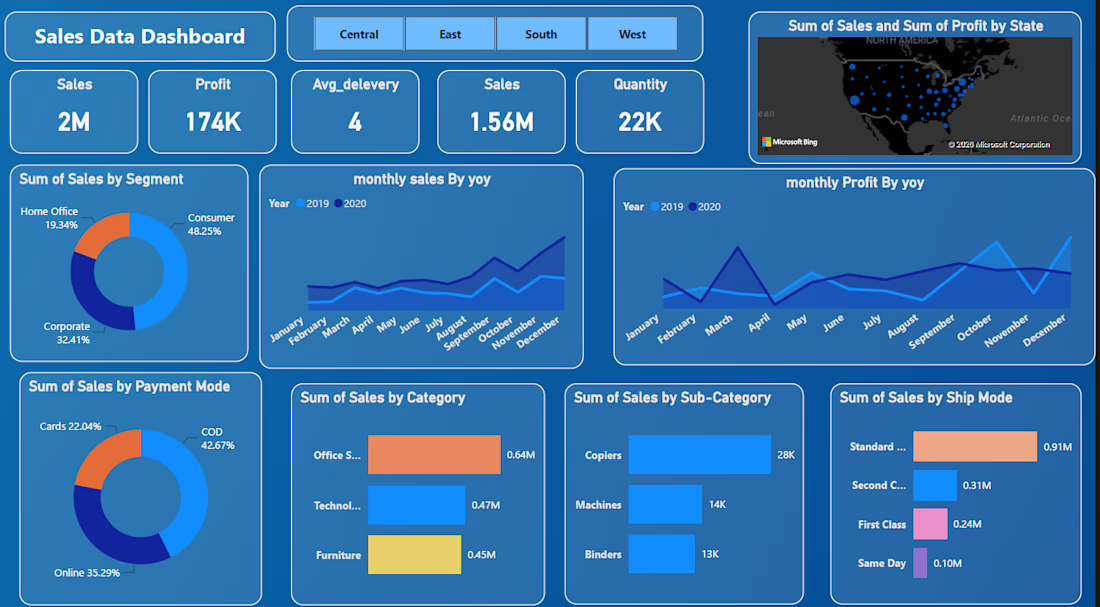
Developed an interactive Power BI dashboard to analyze sales, profit, quantity, customer segments, products, and regional performance.
The dashboard transforms raw sales data into actionable business insights through interactive KPIs, charts, filters, and trend analysis.
Key Features:
Total sales and total profit KPIs
Quantity and average delivery analysis
Region-wise performance
Category and sub-category analysis
Customer segment analysis
Payment method analysis
Shipping mode performance
Monthly sales and profit trends
Interactive filters for regions and time periods
DAX-based KPI calculations
Tools: Power BI • Power Query • DAX • Data Visualization
This dashboard helps businesses understand sales performance, identify profitable categories, analyze customer segments, and track trends for better decision-making.


The network for creativity
Join 1.25M professional creatives like you
Connect with clients, get discovered, and run your business 100% commission-free
Creatives on Contra have earned over $150M and we are just getting started
Related posts




Awesome dude

Blog Listening Web Application With Admin Dashboard.
webdesignappdesignadmindesignBackend DevelopmentFrontend DevelopmentFull Stack DevelopmentExpressJSNext.jsTailwind CSS


Cargora - Cargo Fleet Management Dashboard
A maritime dashboard UI brought to life through motion.
Cargora brings vessel tracking, voyage progress, cargo manifests, fuel metrics, and port scheduling into one operational interface.
This project explores dashboard UI/UX, data visualization, and purposeful micro-interactions for complex logistics workflows.


The motion keeps dense fleet metrics operationally readable.