
Paul Iheabunike
Data Analyst & Backend Developer | Python, Django
New to Contra
Paul is ready for their next project!

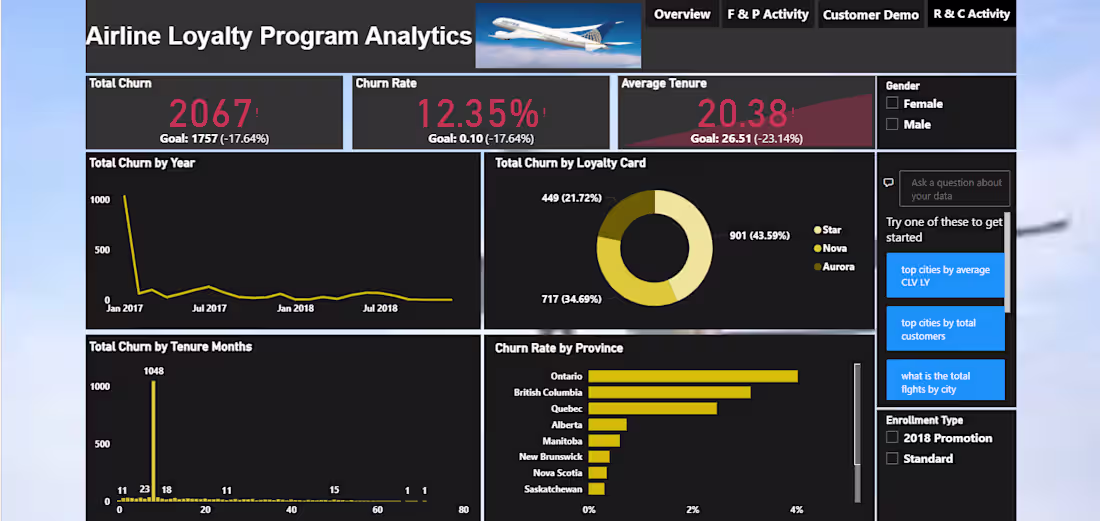
Airline Loyalty Program Analytics. A Power Bl case study analysing 17,000 customer profiles and 87,000 flight records to identify cancellation drivers and retention risks. Key findings included a concentrated churn spike at month 8, mid-to-top tier members accounting for 78% of all exits, and 5.7 million unredeemed loyalty points representing a significant financial liability. Delivered 4 interactive dashboards covering program overview, customer demographics, flight activity, and retention trends, each with actionable recommendations for the retention team.
0
13
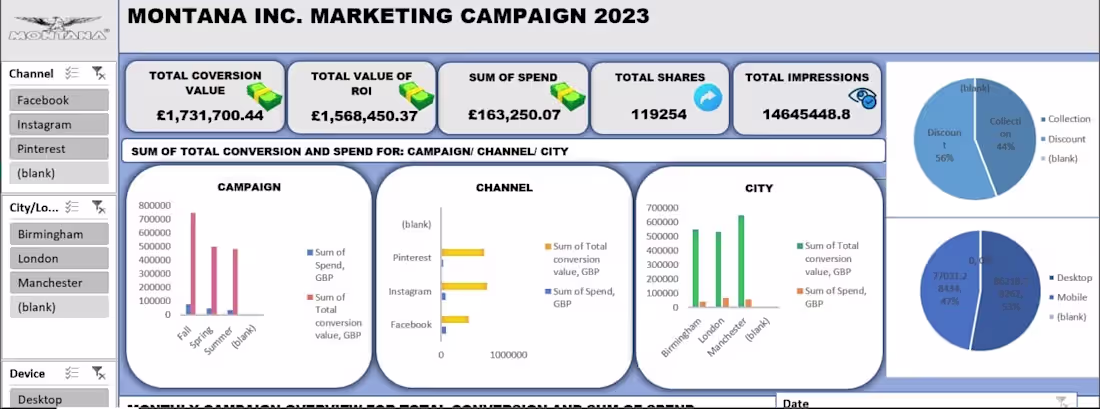
Montana Inc. Marketing Campaign Analytics 2023. An Excel dashboard analysing marketing performance across Facebook, Instagram, and Pinterest channels for campaigns run across Birmingham, London, and Manchester. The report tracked total conversion value of £1.73M against a total spend of £163,250, delivering a return on investment of £1.57M. Key insights included Facebook driving the lowest conversion despite highest spend, summer campaigns outperforming fall and spring, and mobile devices accounting for 53% of total conversions. Delivered an interactive dashboard with cross-filtering by channel, city, device, ad type, and campaign season.
2
44
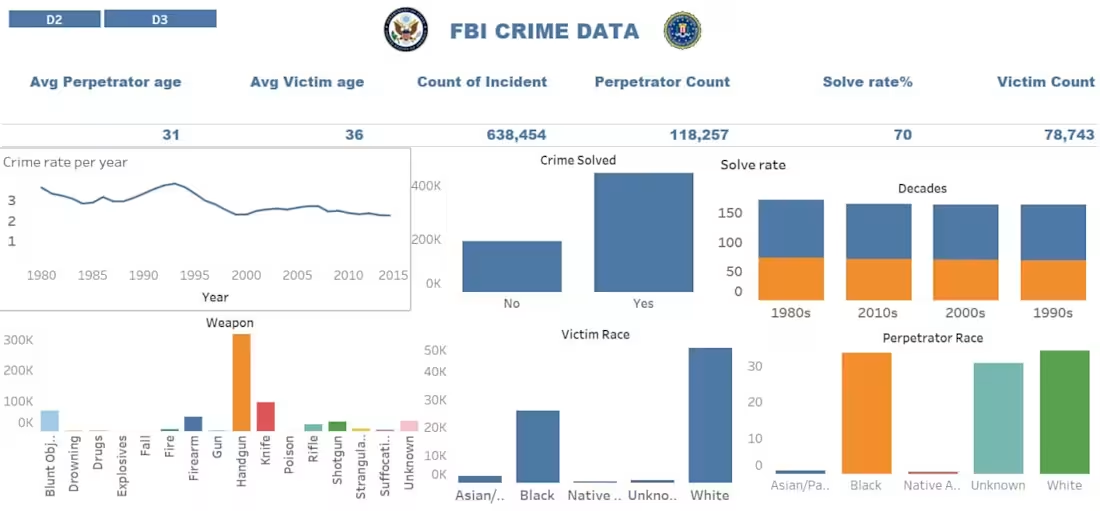
FBI Crime Data Analysis. A Tableau report analysing 638,454 crime incidents across the United States, covering perpetrator and victim demographics, weapon usage, solve rates, and geographic distribution. Key findings included a 70% overall solve rate, handguns as the most used weapon by a significant margin, and strangers accounting for the majority of perpetrator relationships. Delivered 3 interactive dashboards with geographic mapping, demographic breakdowns, and decade-by-decade trend analysis, filterable by state, race, age range, and relationship type.
2
35
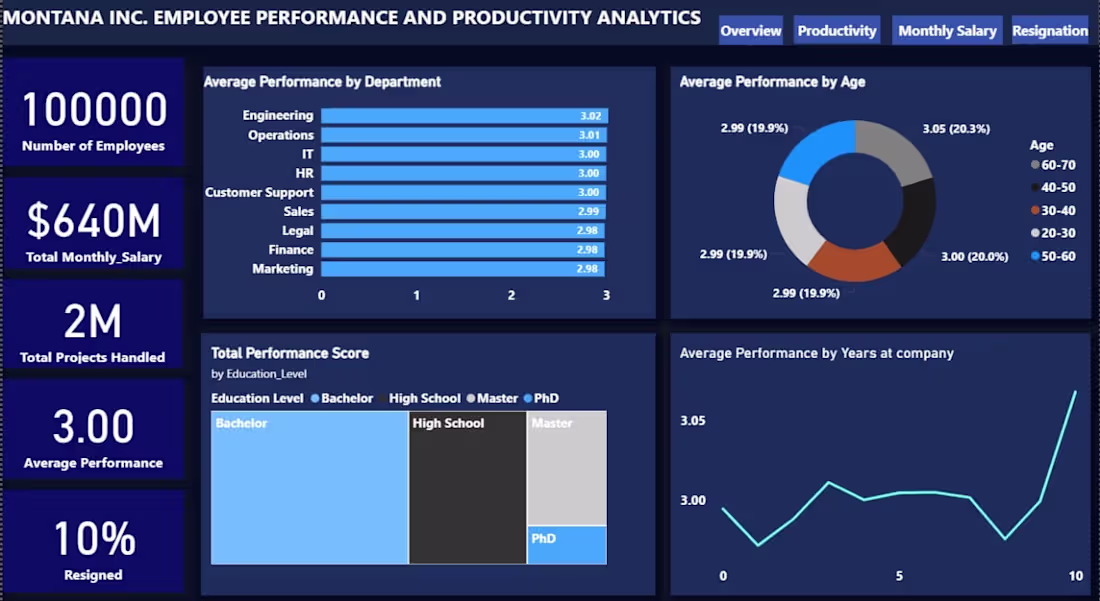
Montana Inc. Employee Performance and Productivity Analytics. A Power BI analysis of a 100,000 employee workforce covering performance, productivity, salary distribution, and resignation trends. Key findings included a 10% resignation rate concentrated among long-tenure employees past year 5, consistent performance scores across all departments averaging 3.00, and a clear salary-to-performance correlation showing higher earners significantly outperforming lower salary bands. Delivered 4 interactive dashboards covering overview, productivity, monthly salary, and resignation analysis, with cross-filtering by gender, education level, and department.
2
40