Motor Insurance Analysis Dashboard
Sharon Selvaraj
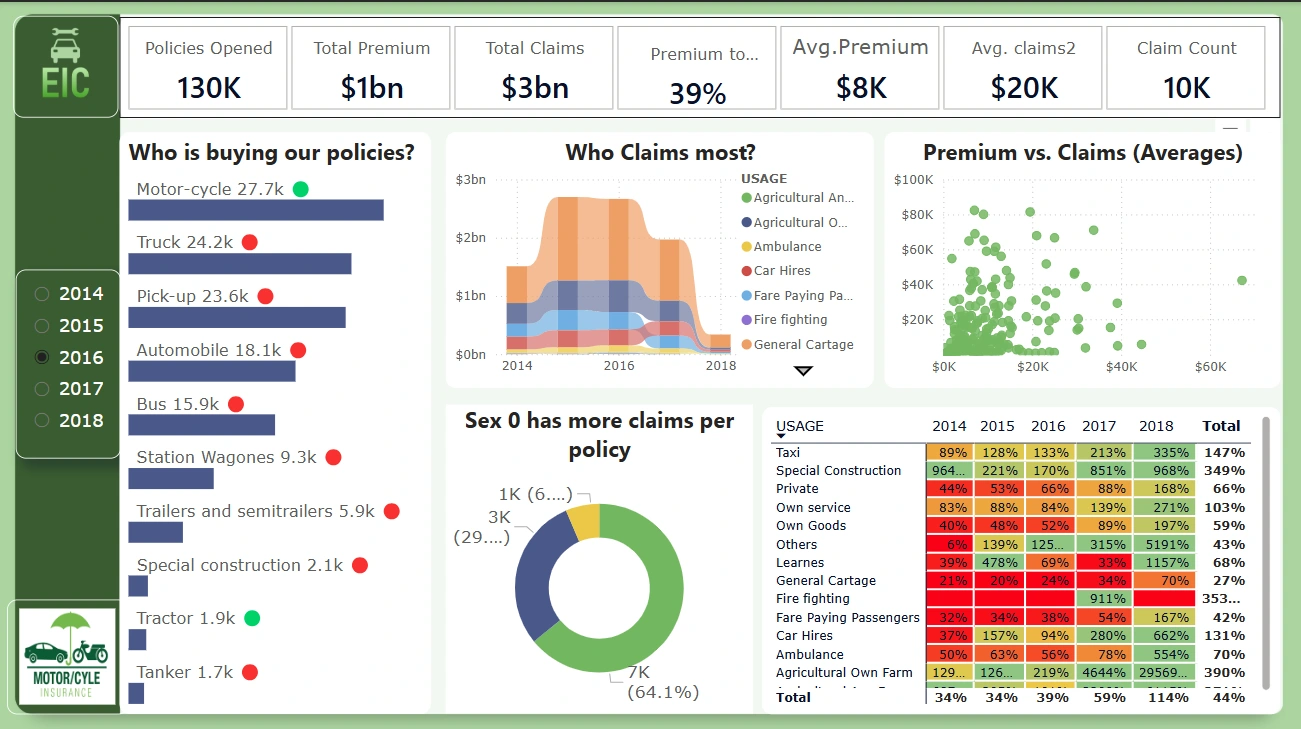
🚗 Motor Insurance Analysis Dashboard - Power BI
This project is a dynamic Power BI dashboard that provides deep insights into motor insurance policies, premiums, and claims. It leverages powerful DAX calculations and Power Query transformations to help stakeholders understand key business performance metrics.
📌 Objective
To build an interactive and insightful dashboard that helps insurance companies:
Track policy trends (opened, closed, active)
Analyze premiums collected vs. claims paid
Understand customer behavior across categories (like SEX, vehicle type)
Improve decision-making through data-driven insights
🧾 Dataset Overview
The dataset includes information related to motor insurance policies with the following fields:
Column Name Description SEX Gender code (0, 1, 2) of the insured INSR_BEGIN Policy start date INSR_END Policy end date EFFECTIVE_YR Year the policy became effective INSR_TYPE Type of insurance INSURED_VALUE Value of the insured vehicle PREMIUM Premium amount paid OBJECT_ID Unique policy identifier SEATS_NUM Number of seats in the vehicle CARRYING_CAPACITY Load-carrying capacity TYPE_VEHICLE Type of vehicle insured
📈 Key Features & Metrics
✅ DAX Measures Created:
Total Policies
Policies Opened
Policies Closed
Total Premium
Total Claims Paid
Claim Paid Count
Premium Paid Count
Average Premium
Average Claims
Premium to Claims Ratio
📊 Visualizations:
Donut Chart: Claims by SEX (0, 1, 2)
Bar/Column Charts: Yearly premium and claim distribution
Cards/KPIs: Quick view of key metrics
Slicers: Interactive filtering for dynamic analysis
🧠 Power BI Techniques Used
Power Query Editor
Imported CSV data
Cleaned, renamed, and transformed columns
Parsed and converted dates
Handled missing/null values
Data Modeling
Created calculated columns
Defined date-based measures for time filtering
DAX Formulas
Used to calculate performance metrics and ratios
💼 Business Impact
With this dashboard, insurance professionals can:
Identify claim-heavy customer segments
Detect potential fraud or anomalies
Balance risk vs. revenue (premiums vs. claims)
Make strategic decisions for marketing or pricing
🛠️ Tools & Tech Stack
Power BI Desktop
DAX (Data Analysis Expressions)
Power Query (M Language)
CSV File Input
📷 Screenshot (Optional)
You can add a screenshot of your dashboard here for better visual appeal:
./assets/dashboard-screenshot.png📁 Repository Structure
🙋♀️ About Me
I’m a data enthusiast passionate about turning raw data into clear, actionable insights.
Feel free to connect with me on LinkedIn or check out more of my projects!
📫 Contact
Sharon Selvaraj
📧 sharoncrosswin@gmail.com
📞 +91 8015697940
Like this project
Posted Jun 3, 2025
Developed a Power BI dashboard for motor insurance analysis using DAX and Power Query.
Likes
0
Views
5