Spec: Traceable Excel Sales Dashboard

Derek Ehrsam

Synthetic portfolio demonstration
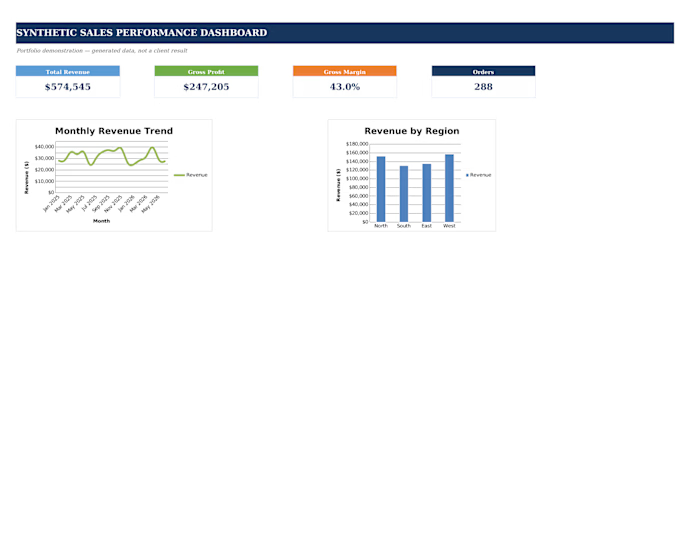
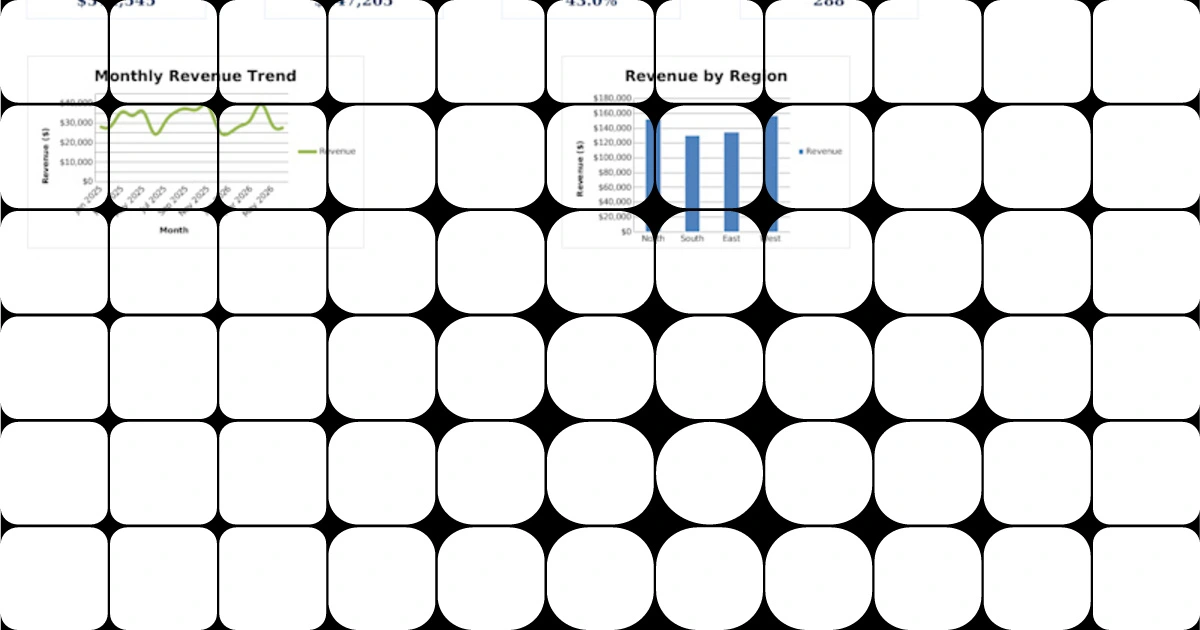
I built this workbook from 288 deterministic generated sales records to demonstrate a traceable spreadsheet-analysis workflow.
What the project demonstrates
A preserved source-data layer separated from summaries and presentation
Transparent formulas rather than hidden calculations
Reconciliation checks between the detailed records and reported totals
KPI cards, conditional formatting, and charts for readable decision support
QA notes that document assumptions and checks
Evidence boundary
This is independently created specification portfolio work using synthetic data. It is not paid client work, and it does not claim traffic, revenue, savings, or other client outcomes.
Like this project
Posted Aug 28, 2026
Synthetic portfolio demonstration using 288 generated sales rows, transparent formulas, reconciled totals, KPI cards, conditional formatting, charts, and QA notes. No client work or business results are claimed.
Likes
0
Views
5