Clusterization
Caio Sanches
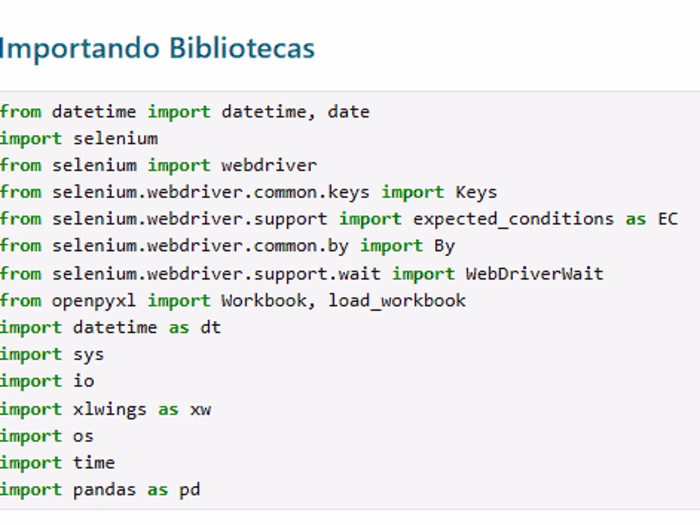
Libraries
Transferring from .csv to Postgres to perform SQL queries.
To cluster, we will use RFM analysis. According to IBM, RFM (Recency, Frequency, Monetary) is a method used to analyze and segment customers based on three key metrics:
Recency (R): How recently a customer has made a purchase.
Frequency (F): How often a customer makes a purchase.
Monetary (M): How much money a customer spends.
This analysis helps businesses identify different customer segments, such as loyal customers, at-risk customers, or new customers, and tailor marketing strategies accordingly
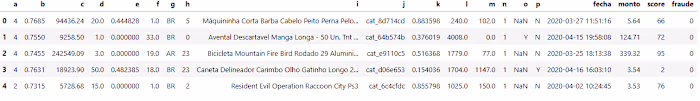
Loading Data
Null values distribution
Just over half of the users add a product to their cart. A little over 1% of the base makes a purchase (conversion rate if conversion is defined as making a purchase)
qntd_transacoes
...
Clusterization
Segmentation
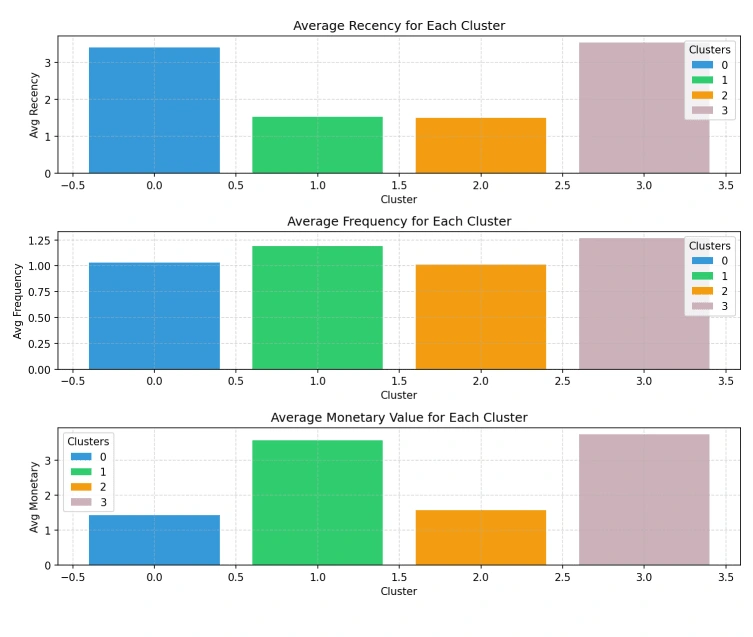
Clusters
To view the rest, please get in touch, as this project is better visualized in Jupyter Notebook. The platform does not allow uploading this type of file
Like this project
Posted Jan 25, 2025
This work involves using RFM analysis for customer segmentation, transforming data, calculating recency, frequency, and monetary scores, and clustering with K-M
Likes
0
Views
4