Fraud detection
Caio Sanches
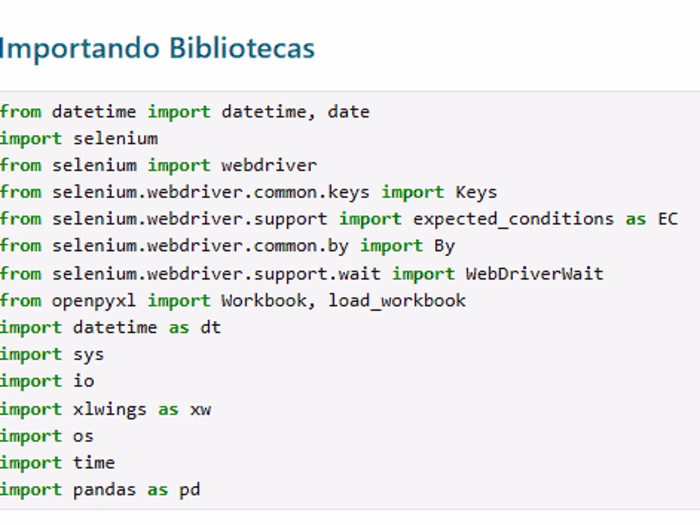
Libraries and functions
Frame the Problem and Look at the Big Picture
Define the objective in business terms - Minimize the number of frauds as much as possible
How will your solution be used? - Reduce fraud in MELI
What are the current solutions/workarounds (if any)? - A score column containing the performance of the previous model
How should you frame this problem (supervised/unsupervised, online/offline, etc.)? - Supervised classification (fraud or not). Based on question 7), I infer that it is batch learning, i.e., training and deploying without data increments.
How should performance be measured? - A high recall is ideal, because we cannot let fraud slip through, meaning we must minimize false negatives.
Is the performance measure aligned with the business objective? - Yes
What would be the minimum performance needed to reach the business objective? - Higher than the score of the previous model
What are comparable problems? Can you reuse experience or tools? - Fraud detection is a classic problem. So, I believe we can leverage prior experience.
Is human expertise available? - No, just the model.
How would you solve the problem manually? - I don't know; more business knowledge is needed.
List the assumptions you (or others) have made so far. - At this moment, we won’t make assumptions, we’ll revisit this later.
Verify assumptions if possible.
Get the data
Sample a test set, put it aside, and never look at it (no data snooping!)
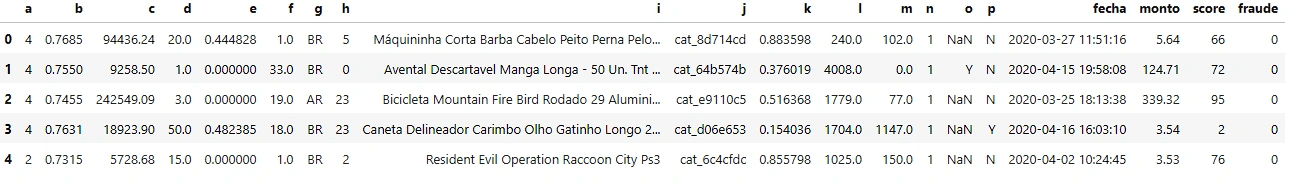
DataFrame
Explore the data
Study each attribute and its characteristics:
- Name
- Type (categorical, int/float, bounded/unbounded, text, structured, etc.)
- % of missing values
- Noisiness and type of noise (stochastic, outliers, rounding errors, etc.)
- Usefulness for the task
- Type of distribution (Gaussian, uniform, logarithmic, etc.)
Column a: Integer/categorical with no missing values, with category 4 being the most frequent.
Column b: Float with 12,984 (8.7%) missing values, with a Gaussian distribution skewed to the right. Range (0,1).
Column c: Float with 12,984 (8.7%) missing values, with almost all its values between 0 and 1 million (0.14 million). Could be income/wealth of buyers or sellers? Applied logarithm to compress the range.
Column d: Float with 365 (0.24%) missing values, bimodal distribution with peaks between 0 and 5, and 45 and 50 (0.50). Seems like age/years/months or something similar.
Column e: Float with no missing values, has an outlier with the value of 833.33. Values above 150 seem to be outliers, while the rest are clustered. It's common to see an outlier value, so we analyzed values within a mean ± 2 standard deviations, and this revealed a left-skewed distribution. Few values above 1, so it seems the range is (0,1), and above 1 is noise.
To normalize, I tried: log (still many outliers) → sqrt (better, but still not great) → boxcox (error, indicated negative values, but they weren’t negative—error was due to values close to 0, so I added 0.05 and applied it again) → OK.
Column f: Float with 11 (approx. 0%) missing values. Contains negative values. After filtering, it has a left-skewed distribution, with most values between 0 and 50, approx. (0, 300). f is difficult to normalize, so we filtered it, losing 25% of the data.
Column g (Countries): Object/string with 194 (0.13%) missing values.
Column h: Integer/categorical with no missing values. Left-skewed distribution.
Column i: Object/string with no missing values. These represent products. After analyzing the products in relation to other columns, it seems c is the total purchase amount, and d is the quantity ordered. The reasoning is based on the three products viewed in section i. Counter to the hypothesis that d is the quantity ordered, d is a float, not an integer. However, the distribution between 0 and 5, and 45 and 50 supports the hypothesis. But when d is 0, c should also be 0, which doesn't happen. When d is 0, f is 0, but f has negative values, so it still doesn't make sense. Nonetheless, we will proceed with this hypothesis.
Column j: Object/string with no missing values. Represents product categories. Most products are in the "cell phone" and "dietary supplement" categories.
Column k: Float with no missing values. Uniform distribution. Range between 0 and 1.
Column l: Float with 11 missing values. Skewed right. Range from 0 to 7.6k. The histogram seems perfect, might be an output from some software?
Column m: Float with 365 missing values. Skewed right. Most values are between 0 and 500, up to 2k. Transformation np.log(df['m'] + 0.5).
Column n: Integer with no missing values. Binary categorical variable. 135,353 values '1' and 14,647 values '0'. Likely "Yes" and "No".
Column o: Object/string with 108,857 (72%) missing values. Binary categorical variable. 24,091 'Y' values and 17,052 'N' values.
Column p: Object/string with no missing values. Binary categorical variable. 83,129 'Y' values and 66,871 'N' values.
Column fecha: Object/string with no missing values. Represents transaction/closure time. Should be converted to datetime and set as the index.
Column monto: Float with no missing values. Skewed right. Range from 0 to 3.6k. Transformation np.log(df['monto']).
Column score: Integer with no missing values. Uniform distribution. 100 indicates the highest risk.
Column fraude: Integer with no missing values. 142,500 non-frauds and 7,500 frauds. Potential class imbalance issue.
a
To view the rest, please get in touch, as this project is better visualized in Jupyter Notebook. The platform does not allow uploading this type of file
Like this project
Posted Jan 25, 2025
Data: Data extraction, manipulation, and feature engineering were key activities in your work. Modeling & Ad-hocs: Building models to address fraud detection an