Case Study-REPORT AND ANALYSIS OF THE AGE COHORT of 25 to 34’s
Emily Hayes
Executive Summary
This report and analysis exists to explain the target insights of the age cohort 25-34 when it comes to different consumption categories. The categories researched for the purpose of this report were Frozen Meals, Going to the Movies, Frozen desserts, Media, and Health and Wellness.
We found that individuals between the ages of 25 and 34 were very unique when it came to their food habits and beliefs. Contrary to other age cohorts, this age cohort looks at their diet as a lifestyle choice and moves towards more dietary restrictions. This being said, these individuals value their dinners but have little time to make healthy meals. This makes frozen meals the perfect option. We find those companies that market their dietary diverness to individuals aged 25-34 are likely to become a part of their food routine.
We found that going to the movies has more elements than one. Ages 25-34 want more from the cinematic experience and movie theaters need to give them that. By listening to the consumers, companies can edit their approach to accommodating consumers very easily. There are many ways for companies to create experiences inside their theaters. Utilizing discounts of movie tickets and theater snacks will go a long way. When companies begin to make these changes, they will begin to see ticket sales sky rocket.
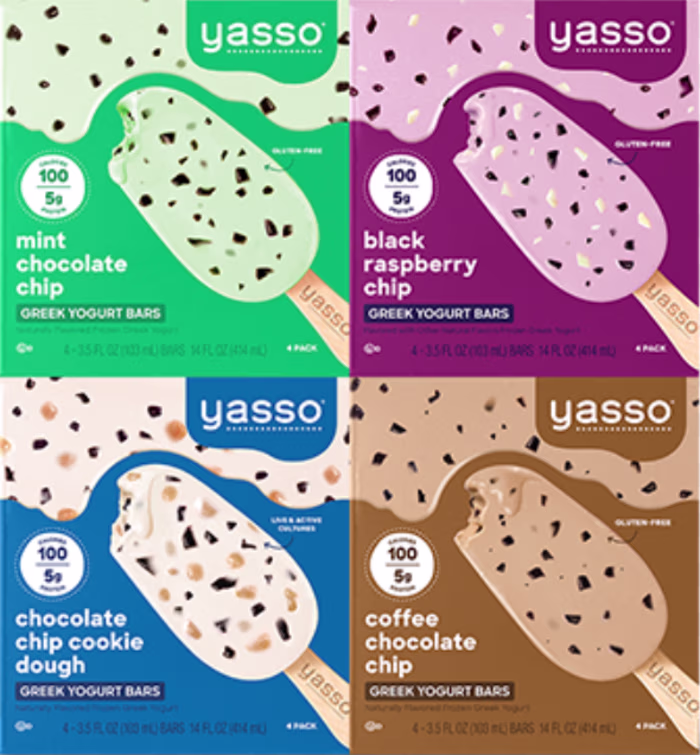
In the frozen treats category of frozen desserts, the age cohort of 25 to 34 has a unique preference of fruit juice ice pops that is not shared by the age cohorts that are younger and older than it. This is due to the higher health consciousness of this age cohort; and the change in children’s influence on household purchase decisions in relation to their age.
In the ice cream category of frozen desserts, people in the age cohort of 25 to 34 share a common preference of premium ice cream. However, the people who purchase premium ice cream in this age cohort are only the more affluent group of people within the age cohort. The less affluent group of people within this cohort purchase ice cream from specialty ice cream fast food stores, which is perceived as the closest affordable alternative to premium ice cream.
Media consumption of this age cohort is very unique as well. Because they were the early adopters to social media, they opt to use it for both news and entertainment. However, since they are well versed in the platforms, they are able to pick out dishonest messages. If marketers want to use social media for this cohort they must first develop trust in the consumer.
The category of health and wellness for the age cohort resonates with the generations pursuit of a higher overall quality of life. A greater connectivity to technology and information allows these consumers to research and interact with products with greater ease so a brand that can distinguish themselves on quality, authenticity and transparency will find success.
Frozen Meals
Research shows that the innovation and success of frozen meals is nothing new to the market. The idea of freezing food itself dates back to as early as 1000 B.C., while men such as Clarence Birdseye and Gerry Thomas truly brought it into grocery stores. After the idea of “flash freezing” food was brought to light by Clarence Birdseye in 1912, and frozen vegetables were soon sold in grocery stores. However, Frozen dinners, originally known as “TV dinners” were introduced in 1954 by Swanson. The meals were flash frozen complete in aluminum containers, the first one containing turkey, cornbread dressing, sweet potatoes, and peas. TV diners were advertised as a meal that a wife could make in minutes. Furthermore, the frozen dinners were coined as a meal that was easy enough to eat in front of the television. Many individuals, specifically men, were strongly against the idea, claiming that they would rather their wives make them a home cooked meal. However, over time, the benefits of frozen dinners began to show through. Individuals found that in times of economic turmoil, the meals were a good ‘go to” saving time, supplies, and thus money.
Over time the frozen dinners category has grown tremendously to hit a variation of eaters. There are frozen dinner categories targeted to men, women, children, health fanatics, and more. Some meals are healthy while others are the complete opposite. The total category grosses 4.5 Billion in revenue each year.
In 2014, however, the product category was struggling to persuade millennials, who now make up the age cohort of 25-34, to purchase the category. As stated in Time magazine, “It’s no secret that millennials have an aversion to frozen food.” The article stated that millennials were replacing frozen meals with restaurant ordering services such as Grubhub or grocery delivery services such as Amazon Fresh. This said, the evidence soon switched in when evidence showed that millennials were instead, “bringing back” frozen meals. The reasons why millenials first opposed, and then supported frozen meals can be explained by understanding some insights about the age cohort.
Insights
To understand millennials opinions on frozen meals, both primary and secondary research was conducted. Firstly, multiple Simmons runs were put together to determine the opinions of millennials compared to other age cohorts when it came to their decisions about food, eating and nutrition. As mentioned by The Florida Times Union, “..millennials have been the forerunners in driving new and healthier dietary trends in recent years, their initiatives have spread across all generations to improve awareness and make us all more conscious of exactly what we're eating.”
In the first Simmons run, we wanted to understand how “healthy” individuals aged 25-34 felt they were being. The first statement ran was “I TRY TO EAT HEALTHIER FOODS THESE DAYS,” and the second was I CONSIDER MY DIET TO BE VERY HEALTHY. The result showed that the percentage of individuals who agreed were slightly below the average with an index of -22 and -20 respectively. This was surprising considering extensive research that reports millennials being extremely healthy. In the continuation of our research, we focused on dinner, since this is when frozen meals are specifically targeted.
In the second Simmons run, the age cohort 25-34 was compared with the age groups 18-24 and 35-44 to compare their opinions of the following statement:
“ DINNER IS MORE IMPORTANT THAN BREAKFAST OR LUNCH.” It was found that individuals between the ages of 25-34 were 14% more likely to agree with that statement than the average. On top of this, 20.7% of individuals between the ages of 25-34 agreed with this statement, which was more than the age groups above and below them. This proved that millennials truly cared about what they were eating for dinner. Knowing this, it was important to understand how much time millennials put into dinner.
For the next Simmons run, the statement was, “ I DON'T OFTEN HAVE THE TIME TO PREPARE/ EAT HEALTHY MEALS.” The survey found that 32.4% of individuals aged 25-34 agreed with this statement. This proved that although millennials valued both health and their dinner, their lives may not have allowed time to make healthy meals. Part of this lack of time may have to do with the many dietary restrictions millenials are putting on their plates in order to stay healthy.
According to the “Million Dollar Vegan,” Market research conducted in the US shows that millennials (aged 21 – 38) are more likely than older generations to go vegan or vegetarian, with 15% of millennials reportedly following a plant-based diet today.” When conducting primary research, we surveyed a total of 44 individuals, the majority of them being between the ages of 25-34. We had found that on top of opinions on healthy eating in general, many individuals are turning to full dietary restrictive categories, especially those individuals aged 25–34. This age group is front running the vegan movement as well as other restrictions such as gluten free, non GMO, keto, etc.
Our survey asked respondents to select which dietary restriction applied to them. We included “ Gluten Free, Vegan, Vegetarian, Dairy-Free, KEto, Non GMO, other, or none of the above. When examining our results we found that only 67.3% of repondants picked none of the above. This means 32.7% of respondents do consider themselves to have a dietary restriction.
When it comes to any product or service, brand awareness is extremely important. This refers to an individual's level of knowledge or understanding when it comes to a specific brand. When it comes to frozen meals, the individual's awareness of brands is extremely important as well. We used both our primary and secondary research to understand awareness within our product category. Our survey pulled the leading eight frozen meal companies including, Lean Cuisine, Healthy Choice, Evol, Smart Ones, Kids Cuisine, Stouffers, Marie Calendars, and Amy’s Kitchen. We found that although 97.35% were aware of the brand, only 75.79% had purchased the brand.
To find a little more information, we put all of the brands available into a Simmons run. The research showed that individuals aged 25-34 were averagely likely to purchase the brands. The specific prompt was for individuals who had purchased either Lean Cuisine, Healthy Choice, Smart Ones, Stouffer’s, Marie Callender’s, or Amy’s within the last 30 days.
Overall, we determined that individuals 25-34 years old were extremely unique when it came to food and habits related to food. Although millennials were called responsible for the many healthy changes and innovations in the food realm, they themselves felt that they were not doing a good enough job, and did not have enough time to do so.
Recommendations
Millennials uniqueness in the food category is what makes them the best customers for frozen meals. Although millennials value their health and make conscious decisions to help themselves, such as being on diet restrictions, they don’t have the time they need to make meals. This where the convenience of frozen dinners helps.
As mentioned in the Guardian, “The average millennial doesn’t have time to make a full meal with fresh meat and produce, a Euromonitor analyst explained. “More and more they’re seeing these products as viable options.”” This is specifically what seems to be driving the shift within the category.
For organizations who are using the new dietary restrictions and health trends to their advantage, they have seen a drastic increase in sales from 2013 to now. For example, a classic frozen food organization, Lean Cuisine has created new product categories such as Vegetarian, Vegan, Low Carb, Gluten Free, etc. One of the biggest changes the company made was removing the word “diet” from their packaging. This earned the brand 58 Million sales increase in 2017. The reason why seems simple, individuals today, especially ages 25-34 are no longer believing in diets. Instead, they believe in lifestyle choices that result in healthier eating.
To market to individuals ages 25-34 it is important to consider the things they value when purchasing food. Millenials do not have enough time to make healthy meals, so convenience for them is key. By marketing the convenience aspect, millennials may opt to buy frozen meals instead of seperate ingredients. Frozen meal companies must also evolve to the new dietary trends and lifestyles that millennials are passionate about. By giving options to people who may find difficulty finding food out and from restaurants, they may be more likely to purchase the brand. Not only should the brands do these things but they should promote them. Although many people showed they are aware of the brands, they may not have been aware of everything the brand has to offer.
In conclusion, food is something that is part of an individual’s every day. If a brand wants to flawlessly fit in someone’s life, they must also fit in to their lifestyles, strengths, and their weaknesses. By doing this, it could make frozen meals a part of a 25-34 year old individual’s life.
Going to the Movies
Going to the movies in recent years is more than just watching a film, it includes an entire cinematic experience. Throughout the years, the cinematic experience has diversified in many ways. Movie theaters have introduced concession stands, seats that recline and full dinner service. Years ago, going to the movies involved the simplicity of a bag of popcorn and a film. Movie theaters around the world are constantly looking for ways to increase attendance by creating new branches of this cinematic experience.
Findings
A study done to identify who attends the movies highlights the largest market for movie going are young adults. Although young adults have the highest percentage of movie going, other factors including slow population growth and declining rates of movie attendance make them a shrinking market looking forward. Since the 1950s movie goers have skewed younger and often when they go to the movies, it is for a date or event. Adults aged 18 to 24 are significantly more likely than average to go to the movies at least once a month, at 34 percent, compared with 20 percent for all adults. Although this age cohort is not the one in immediate examination, younger adults are the ones often going to the movies. Our age cohort 25 to 34 are resting in between young adult and adult. Key events that occur during this age cohort involve having children and getting married. Along with this information, movie makers know their audience usually includes young adults because they are often the most willing to view movies regardless of its plot.
After analyzing research, the age cohort 25-34 are 14 percent more likely to attend a movie in the last six months compared to the age cohort 18-24 which are 24 percent more likely to have attended a movie in the past six months. This supports the data that adults 18-24 are the most likely to attend a movie theater. The cohort 25-34 are 66 percent more likely to attend the movies during opening weekend than any other time compared to the cohort 18-24 who are 75 percent more likely to attend during opening weekend. Based on the data, it is incredibly more likely to see consumers attend a movie theater on the film’s opening weekend compared to any other time frame.
Within a 90 day period, 25-34 year olds are 23 percent more likely to attend a movie theater 1 time, while 18-24 year olds are only 8 percent more likely. This category demonstrates the likelihood of an adult seeing a film only once in a 90 day period while younger adults are less likely due to the possibility of seeing more than one in this same time period. Older age cohorts are more likely to be able to only see one film during this period in comparison to the younger cohort who have increased leisure time. If this is compared to movie attendance within a 90 day period with attending the movies 6 or more times, 18-24 year olds are 64 percent more likely than the population, while ages 25-34 are 3 percent less likely to attend 6 or more times. With the amount of free time younger cohorts have on their hands it is very likely they use a chunk of this time at movie theaters.
The following data highlights the most popular movie theaters which have been visited in the past 6 months. First is AMC movie theaters, males aged 25-34 are 25 percent more likely to attend a movie at AMC while females in the same cohort are 16 percent more likely. The same response shows that males aged 18-24 are 32 percent more likely and females in the same cohort are 60 percent more likely. AMC is one of the larger movie theater franchises that can be found all across the United States. They also have rolled out AMC dine-in movie theaters that offer three course meals while the movie is being screened. AMC has diversified their approach for gaining movie attendance with dine-in theaters as well as non dine-in theaters. Dine-in movie theaters are great for dates and other occasions which is why the percentage of movie watching at these theaters is relatively high. Perks at these theaters include personal buttons that can be pressed to signal a server, where someone can order a full meal or alcoholic beverages. This new part of the cinematic experience has impressed many people bringing in great revenue for AMC the largest movie theater chain in the world.
Another popular movie theater franchise is Regal Cinemas, within the past 6 months males 25-34 are 7 percent more likely to have attended a movie at this theater, where females in the same cohort are 32 percent more likely to attend. Males and females 18-24 are 37 and 39 percent more likely to attend in the past 6 months. Regal Cinemas is the second largest movie theater franchise in the United States. Consumers want to gain an experience from going to the movies, and such as AMC, Regal has created a wide range of experiences consumers can choose from. One feature is RealD 3D that creates a new cinematic experience specifically in 3D additions. Another feature is 4DX which utilizes motion-enhanced seats that syncs with the film’s actions, accompanied by environmental special effects such as wind, strobe lights, water, air blasts, leg ticklers, vibrations, rainstorm, smoke, and scent. This thrilling new feature has been viewed as a popular experience that elevates the simplicity of attending a movie without different memorable features. 4DX is a perfect experience for the family, animated films work great with this physical experience that children will not forget. Regal is the first to implement these new ways to watch movies, and it is clear they continue to evolve.
With the two largest movie theater franchises receiving the highest percentage of attendance, there is a large amount of smaller theaters still bringing in revenue.This division of movie theaters consists of theaters and cinemas that are small businesses across the United States. Men ages 25-34 are 28 percent more likely to attend their hometown’s primary theater compared to the rest of the population, females ages 25-34 are 47 percent more likely to attend a primary movie theater in the last 6 months. Females ages 18-24 are 54 percent more likely to attend a primary theater in the last 6 months. Men ages 18-24 are 34 percent more likely to stick to their primary theater. Based on this data it can be understood that people are more likely to support their local businesses and their convenience. They are less likely to go out of their way to have a dine-in movie experience if there is a traditional movie theater closer to their location of residency. It is more likely to have a local movie theater than one of the larger names AMC and Regal.
There are a lot of different ways movie tickets can be purchased. A consumer can wait on a line to purchase, buy online, or be signed up to a rewards program. In the past 3 months, males 25-34 are 12 percent more likely to have purchased tickets to a movie online, females ages 25-34 are 60 percent more likely to have purchased tickets to a movie online. This could be for a plethora of reasons. Convenience is one of them, individuals enjoy having tickets reserved prior to the movie. This action creates more time to purchase food and use the restrooms at the movie theater rather than waiting in line for a ticket. If a consumer is looking up movie times, it may direct them to a website with online tickets and will persuade them to purchase the tickets in the moment.
Compared to a younger cohort, males 18-24 are 1 percent more likely to have purchased movie tickets online in the last 3 months while females 18-24 are 58 percent more likely to have made this online purchase. Based on the two separate cohorts, females are more likely to shop online to purchase movie tickets. Females are considered online shoppers compared to males. The convenience of purchasing tickets online resonates with females because they look for purchases online more than males. In the category for ordering movie tickets online, females ages 25-34 shop online for tickets are 71 percent more likely to get tickets this way over the entire adult population. Males ages 25-34 asked the same question and only 25 percent more likely than the rest of the population. Males are not making their purchasing decisions online as much as females in the same 25-34 age cohort. Movie companies must utilize the various forms
of ticket purchasing to gain a grasp on where the consumers are purchasing their products. This could be either in person, online or through a third-party.
On personal computers at home, males and females ages 25-34 are 61 percent more likely to watch television or a movie on their device. This includes streaming services, and various other websites that provide television and movie content. The younger age cohort of 18-24, males are 71 percent more likely while females are 73 percent more likely to utilize their personal computers at home to stream television and movies. Young adults who are often away at college during this age cohort utilize their personal computers as televisions. They watch movies and television shows freely with the click of a button. Consumers within the last 30 days have online activity that involves watching movies through download or stream. Males ages 25-34 are 57 percent more likely to have online activity streaming movies while females ages 25-34 are 99 percent more likely to do so. Interestingly, males ages 18-24 are only 27 percent more likely to stream movies in the past 30 days, while females in the same age cohort are 119 percent more likely. Of the four subgroups, females 18-24 are most likely to have online activity in the last 30 days revolving around streaming movies. This lets movie theaters gain insight that there are people who enjoy watching movies and televisions from home due to the convenience.
Insights
In order to continue to increase movie viewership in theaters, there are times of the year where theaters are pulling in large numbers. Study shows that the end of the year and the summer are two of the important seasons for Hollywood. If these seasons are important for Hollywood then they are also important for movie theaters who get the opportunity to screen these films during the most successful parts of the year. Due to holiday and summer breaks, this is the best time to get the whole family out of the house and into a movie theater. For example, when children are out of schools on breaks, they are eager to keep busy and this is when movie theaters capitalize.
During hard times, 18-to-24-year-olds do not necessarily cut back on their movie spending. Our age cohort 25-34 would be more likely to save their money during an economic recession to avoid spending on entertainment. As previously stated, the younger age cohort 18-24 have less financial responsibilities than their older cohorts.
Although young adults have significantly lower incomes than their older counterparts they also have fewer financial responsibilities. That is one reason why their annual spending on movie admissions is only slightly below average, according to the 1994 Consumer Expenditure Survey Households headed by someone under age 25 spent $69 on average on admissions to movies, ballets, and opera, compared with $76 for all households. Due to the small amount of ballet and opera going, there is an assumption that the majority of this data comes from movie attendance.
Getting a larger share of adults aged 25 and older to go to the movies is incredibly challenging due to larger portions of leisure time being spent at home. There is a struggle to get older adults to venture out to the movies when they pursue many other hobbies while being in the comfort of their own homes.
Movie theater franchises are continuously coming up with ideas to get larger amounts of people into their theaters. An Atlanta-based movie-theater chain is trying to get older movie goers in for dinner and a movie. The company is actively targeting adults aged 21 to 40 in theaters with cabaret- style seating and full food and beverage menus. When there is entertainment involved, older adults enjoy viewing performances with a dinner for pairing. They want to reach adults who have negative opinions towards standard movie theaters. When a movie theater has popcorn on the floor and the seats are not clean, it becomes very unappealing to customers. Older adults are more vocal with their feelings for uncleanliness. Just as the company based in Atlanta, many other theaters are attempting to make watching movies more of a luxury.
Adults of all ages, especially young ones, still have an appetite for moving-image products. Now there are other ways to get them aside from big screens, from videotapes to video games and computer screens. Movie theaters in past years were the only places for moving-image products. As technology and media continues to progress, professionals have considered new ways to watch movies in theaters and at home. Movie theaters continue to evolve as new features are introduced into the cinematic experience.
People who have aged out of the prime movie-going years often feel less urgency to see new movies. Many are content to wait for films to be played on a home movie channel or released on video, while younger movie patrons hastily hit the theater. As individuals grow older, they are less likely to become interested in seeing films right when they hit theaters. Due to their differences in leisure time activities, they would rather wait to watch the movie when it can be played on a home television. People prefer watching movies in their homes because that is where they feel most comfortable. When blockbuster films hit theaters, teenagers and young adults wait hours to make sure they are one of the first to purchase tickets. The thrill of waiting outside all night in the cold just to see the midnight screening of a film registers with these younger age cohorts.
Before 2007 it was unheard of for a film to be released for video-on-demand rather than receiving a theatrical run. Many believed this new distribution model would allow films to gain momentum heading into a theatrical release, but after several years of using this strategy, distributors found that profits for video-on-demand releases outpaced their theatrical profits by a two to one margin. The form of video-on-demand now provided a new option for consumers to gain the cinematic experience. The most positive attribute to this new way of watching films is the opportunity to watch from the comfort of your home.
A key part of a successful cinematic experience involves the consumer’s emotion. The emotions as well as their intensity, are influenced by the consumer’s interactions with others.
In order to create a successful cinematic experience for consumers, the presence of other individuals allows the consumer to express him/herself more freely. Interactions occur simply after a movie has commenced, discussions about the positives and negatives of the cinematic experience mostly take place after the credits start rolling. The logic behind conversations starting after the movie is over is simply due to the lack of speaking there is in the theater as a movie is played. Immersion is an emotional cognitive and sensory process which provides access to a specific goal, a subjective experience that, when combined with others, contributes in particular to achieving a global objective of identification for the individual. This occurs when there is an interaction of the consumer and an enclosed, safe, and thematic experiential context.
In this case, you watch the individual disconnect from the real world as they immerse themselves into the realm of the desired cinematic experience. In the specific case of a movie shown in a theater, the emotions felt by the moviegoer can become weaker as he/she perceives there is not enough action, that he/she no longer “believes”, or that a scene is meaningless. In moments where the moviegoer loses interest in the film, their mind begins to wander elsewhere. As this happens the consumer begins to solely decrease immersement in the film. There becomes a higher possibility of focusing on other elements in the environment where the movie is being screened. Throughout the duration of a film there are times where a consumer would state that it is “boring.” During these key moments in a film, attention is lost which disengages the viewers for undisclosed amounts of time. When this happens to a consumer, it links emotion and immersion. The way a consumer feels during and after the film they are viewing can either leave a positive or negative impact on the experience. The best way to understand why consumers disconnect during a film is to monitor their expressions and actions to better understand their emotions.
While the consumer still participates passively in the experience, if he or she becomes immersed in that setting, then an aesthetic experience occurs. In the aesthetic experience, the consumer merely enjoys being in the event environment without altering the nature of the environment. While attending the movies, the consumer does not alter the environment they are experiencing. They are simply enjoying their surrounding environment without making changes to the overall cinematic experience. Scenes of a movie could alter the amount of immersion from the consumer. According to environmental psychology, movie- goers are more likely to respond to all elements that emerge from the place are predominantly movie attributes in the movie experience context. This assists the understanding that consumers take attributes specifically from the film rather than surrounding elements.
Recommendations
Based on the data found, there are several recommendations for movie theater franchises. The age cohort 25-34 are more likely to purchase their tickets online, companies should begin online advertising on websites this cohort would most likely visit. Unlike the younger age cohort, ages 25-34 will less likely wait in line for new movie releases. With their lack of leisure time, they want to have tickets in advance to prepare for an easy movie experience. Online shopping has become incredibly popular with this cohort, a suggestion would be to create bundles. Movie theaters should create bundles that involve a plethora of ideas. Food and drink combos, buy one get one free, 10th movie free. These are just some ways a franchise can see their movie going numbers sky rocket.
Adults ages 25-34 want more out of their cinematic experience. Movie theaters have already implemented dining service, but they should expand on that. The movie experience should be more than just a screen. Ages 25-34 would prefer to watch movies in their households, companies should give them that option. Movie theater seats currently recline, but they can go further. Transform the movie theaters into various different settings, this will change the cinematic experience greatly.
Further age and gender segmentation will not be necessary in order to better understand the cohort. As adults get older, they begin to react similarly to each other. Adults in this consumer category have a preference of staying home and watching movies because of the lack of leisure time. Companies should put their focus into elaborating on the cinematic experience to bring viewers back into their seats, specifically males and females ages 25-34.
Frozen Desserts
The frozen desserts category is divided into the subgroups of frozen treats and ice cream due to the vastly different consumption behaviors between the two subgroups.
Frozen Treats
Findings
In the frozen treats subgroup of frozen desserts, the brands that the age cohort of 25 to 34 is most likely to purchase the most often are Minute Maid Fruit Juice Pops and Welch’s Fruit Juice Bars, with the index of 153 and 133 respectively. The age cohort of 18 to 24 and 35 to 44 are not as likely to purchase those brands the most often. The age cohort of 18 to 24 has an index of 98 for Minute Maid Fruit Juice Pops, however, the sample size is only 50 people, and an index of 95 for Welch’s Fruit Juice Bars. The age cohort of 35 to 44 has an index of 124 for Minute Maid Fruit Juice Pops and an index of 113 for Welch’s Fruit Juice Bars.
Conversely, the brands that are most likely to be purchased by the age cohort of 18 to 24 and 35 to 44 the most often are similar. The age cohort of 18 to 24 is most likely to purchase Butterfinger Ice Cream Bars and Nestle Crunch Ice Cream Bars the most often, with the index of 142 and 136 respectively. The age cohort of 35 to 44 is most likely to purchase Milky Way Cream Bars, Butterfinger Ice Cream Bars and Nestle Crunch Ice Cream Bars the most often, with the index of 170, 139 and 136 respectively. The preference of Butterfinger Ice Cream Bars and Nestle Crunch Ice Cream Bars is shared by the age cohort of 18 to 24 and 35 to 44.
However, the age cohort of 25 to 34 do not have a preference for Butterfinger Ice Cream Bars and Nestle Crunch Ice Cream Bars. This age cohort is unlikely to purchase those brands the most often. It has an index of 87 for Butterfinger Ice Cream Bars and an index of 68 for Nestle Crunch Ice Cream Bars.
Ice Cream
Findings
In the ice cream subgroup of frozen desserts, the brands that the age cohort of 25 to 34 is most likely to purchase the most often are Ben & Jerry’s, Baskin-Robbins, Dairy Queen and Haagen-Dazs, with the index of 129, 123, 122 and 120 respectively. The preference of Ben & Jerry’s and Baskin-Robbins is also shared with the age cohorts of 18 to 24 and 35 to 44.
However, the most preferred brand is different in each age cohort. The age cohort of 25 to 34 is most likely to purchase Ben & Jerry’s the most often. The age cohort of 18 to 24 is most likely to purchase Dreyer’s the most often. The age cohort of 35 to 44 is most likely to purchase Dove the most often.
Frozen Treats
Insights
The preference of fruit juice ice pops, which are the Minute Maid Fruit Juice Pops and Welch’s Fruit Juice Bars, of the the age cohort of 25 to 34 is unique to its own age cohort when comparing to the cohorts younger and older than it, which are the age cohorts of 18 to 24 and 35 to 44. On the other hand, the age cohorts of 18 to 24 and 35 to 44 have similar preference. Both of the age cohorts prefer frozen treats from the popular candy brands, which are the Butterfinger Ice Cream Bars and Nestle Crunch Ice Cream Bars.
There are two reasons for the age cohort of 25 to 34’s unique preference of fruit juice ice pops. One reason is that this age cohort is more likely to be more health conscious than the age cohorts of 18 to 24 and 35 to 44. For the lifestyle statements of “usually I am quick to try a new nutritional product,” “eating fattening food makes me feel guilty” and “I usually only snack on healthy foods,” the age cohort of 25 to 34 has an index of 119, 114 and 108 respectively, to agree to that statement, compare to the age cohort of 18 to 24’s index of 107, 96, 89 respectively; and the age cohort of 35 to 44’s index of 99, 106 and 99 respectively.
Fruit juice ice pops are appealing to the age cohort of 25 to 34 they are congruent with their value of being healthy. They perceive fruit juice ice pops as a healthier alternative to the dairy frozen treats; since they strongly associate fruit juices with being healthy.
However, according to the results from the primary research, the frozen desserts that are purchased by a consumer often are not solely consumed by his or herself alone. Often, the frozen desserts purchased are shared between the purchaser and his or her family members. It leads to another reason for the age cohort of 25 to 34’s unique preference of fruit juice ice pops. It is likely that fruit juice ice pops are being used by the parents in this age cohort as the reward in their material parenting style for their young children. The mean age mothers of having the first child is 26.9. It implies that the children of the parents in this age cohort are newly born or at a very young age. People in this age cohort are 166% more likely to have children under the age of 2 in the household.
While parents in this age cohort wanted to reward their children with frozen treats, since even infants already have a preference of a sweet taste, most of the dairy frozen treats are not recommended to be consumed by children under the age of 1. As a result, the parents in this age cohort use fruit juice ice pops as an alternative to dairy frozen treats to reward their young children. This assumption is supported by the data from Simmons. It shows that people of age 25 to 29, who are closer to the mean age of mothers having the first child, are 63% more likely to purchase Welch’s Fruit Juice Bars the most often. However, the likelihood decreases to 9% of the people of age 30 to 34, who are further away from the mean age of mothers having the first child.
When the children are newly born and young, they cannot consume dairy and they have very little influence on the purchase decision made in the household, so their parents, who are of age 25 to 29, make the purchase decision for them by purchasing fruit juice ice pops for them to consume. As the children grow older, they are able to consume dairy and they have greater influence on the purchase decision made in the household. They are able to influence the household purchase decision according to their preference; and their preference is reflected in their parents’ purchases.
Children’s degree of influence on household purchase decisions is the reason that the age cohort of 25 to 34’s preference of frozen treats is vastly different from the preference of the age cohorts of 18 to 24 and 35 to 44; while the preference of the age cohorts of 18 to 24 and 35 to 44 are similar. The age cohort of 25 to 34 are most likely to have children under the age of 2 in the household. The children under the age of 2 have little to no influence on household purchase decisions. On the other hand, the age cohorts of 18 to 24 and 35 to 44 are most likely to have children of age 13 to 17 and 10 to 11, respectively. As children grow older, they become more influential on household purchase decisions. Children of age 10 to 11 and 13 to 17 are highly influential on household purchase decisions. According Dougherty et al., nearly half, 47.8%, of the children’s requests are converted into the parents purchase.
The age cohort of 25 to 34’s preference of fruit juice ice pops is due to the young children’s inability to digest dairy and their low degree of influence on household purchase decisions. The age cohorts of 18 to 24 and 35 to 44’s preference of frozen treats from the popular candy brands is due to the children’s high degree of influence on household purchase decisions and the popularity of the candy brands, Butterfinger and Nestle Crunch, among children.
Ice Cream
Insights
In the ice cream subgroup of frozen desserts, the age cohort of 25 to 34 has a preference of Ben & Jerry’s, Baskin-Robbins, Dairy Queen and Haagen-Dazs. Of the people in the age cohort of 25 to 34 that have the preference of Ben & Jerry’s and Haagen-Dazs, they are likely to have a higher household income, $75,000 - $99,999, than the people in the age cohort that have a preference of Baskin-Robbins and Dairy Queen, $25,000 - $49,999. Yet, both the people who prefer Ben & Jerry’s and Haagen-Dazs and the people who prefer Baskin-Robbins and Dairy Queen in this age cohort have relatively the same tendency of trying to have gourmet food whenever they can, with the index of 149 and 148 respectively.
Moreover, the results from the primary research shows that consumers value the brand more than the price when purchasing frozen desserts. With 1 being “strongly disagree;” 5 being “strongly agree,” the mean response of 3.2 for the question “when I purchase ice cream/frozen treats, the price is the most important to me” compare to the mean response of 3.86 for the question “when I purchase ice cream/frozen treats, the brand is the most important to me.” More respondents agree to the latter than the former.
Premium ice cream, Ben & Jerry’s and Haagen-Dazs, is preferred by the more affluent group of people in the age cohort of 25 to 34 because they are positioned as premium brands in the ice cream category; and their positioning strategy have successfully made people perceive them as premium brands. Premium ice cream is appealing to the more affluent group of people in the age cohort of 25 to 34 as their positioning strategy is congruent with this group of people’s value of trying to eat gourmet food whenever possible. Also, since this group of people have a higher household income, they are able to pay for the premium price of the premium ice cream. Therefore, the more affluent group of people in the age cohort of 25 to 34 are more likely to purchase premium ice cream. They value the premium ice cream brands and the price of the premium ice cream is less of a factor to them when purchasing ice cream.
On the other hand, premium ice cream may still be appealing to the less affluent group of people in the age cohort of 25 to 34, since they also have the value of trying to eat gourmet food whenever possible. However, since they have less disposable income, purchasing premium ice cream, which has premium prices, induces a high level of financial risk to this group of people. As a result, this group of people purchase ice cream from the specialty ice cream fast food stores, which are Baskin-Robbins and Dairy Queen, as an alternative that is closest to the premium level of Ben & Jerry’s and Haagen-Dazs while the prices do not induce too much financial risk. This group of people have less disposable income, they still value the brand more than the price when purchasing ice cream. Even though the ice cream from the specialty ice cream fast food stores is more expensive than the mass produced store bought ice cream, this group of people still prefer it because it is perceived by them as more premium than the mass produced store bought ice cream.
Frozen Treats
Recommendations
When marketing the frozen treats category of frozen desserts towards the target of the age cohort of 25 to 34, marketers can communicate marketing messages that are appealing to their value of being healthy. This group of people have a higher tendency of being health conscious than the age cohorts younger and older than it.
Other than appealing to the age cohort of 25 to 34’s value. Marketers can also target this group of people by communicating marketing messages that are tailored to their family life cycle. When taking this approach, marketers should divide the age cohort of 25 to 34 into subgroups of age 25 to 29 and age 30 to 34. Marketers should target frozen treats, specifically fruit juice ice pops, product messages towards the parents in the age group of 25 to 29. Parents in this age group are likely to have newly born or very young children. They are likely to be the dominant decision maker in household purchases. Fruit juice ice pops product messages are likely to be appealing to this group of people because fruit juice ice pops can be used as an alternative to dairy frozen treats for them to reward their young children, who cannot digest dairy yet.
On the other hand, marketers should target frozen treats product messages towards the children of the parents in the age group of 30 to 34. Since children of the parents in this age group are likely to be older. They become highly influential in household purchase decisions. The parents in this age group are no longer the dominant decision maker in household purchases. Almost half of the children’s requests will convert into the parent’s purchase since most of the parents will yield to the children’s requests to avoid conflicts. The frozen treats product messages that are targeting the children of the parents in the age group of 30 to 34 should induce the children to request the products from their parents. If the messages are able to induce the children to request the products from their parents, it is more likely that the marketing communication will convert into sales.
Ice Cream
Recommendations
When marketing the ice cream category of frozen desserts towards the target of the age cohort of 25 to 34, marketers should divide the age cohort into subgroups of the more affluent group and the less affluent group according to their household income. Even though both the more affluent group of age 25 to 34 and the less affluent group of age 25 of 34 value having gourmet food, only the more affluent group of age 25 to 34 is purchasing gourmet food. This group has the disposable income to afford the price of gourmet food that the less affluent group is lacking.
When targeting ice cream products marketing messages towards the more affluent group of age 25 to 34, marketers should emphasize the level of premium of the ice cream products or the brands. The messages that are successful in leading this group of people to perceive the ice cream products or the brands as premium, the more likely that the marketing messages will convert into sales.
Even though premium ice cream also appeals to the less affluent group of age 25 to 34, they do not have the disposable income to afford the price of the premium ice cream. Therefore, the next affordable alternative that is closest to premium ice cream is appealing to this group of people, which is the ice cream from specialty ice cream fast food stores. Specialty ice cream fast food stores allow customers to customize the combination of the ice cream flavors according to each of their order; and the perceived proficiency of the specialty ice cream fast food stores in serving ice cream made the less affluent group of age 25 to 34 perceive their ice cream as the closest alternative to the premium ice cream while offered at an affordable price.
When targeting ice cream products marketing messages towards the less affluent group of age 25 to 34, marketers should emphasize the level of premium in the ice cream products, for example, the customization ability of the ice cream and the brand’s proficiency in serving ice cream; but also emphasize that the ice cream products are offered at a price that is affordable to them. In other words, to distinguish the products from the mass produced store bought ice cream by showing a higher level of premium in the products while emphasizing being more affordable than the premium ice cream.
Media
Findings
Just as we have found individuals aged 25-34 to be unique in their decisions on other product categories, their outlook on media is no different. Media is traditionally known as the means of mass communication. However, over time, the media vehicles themselves have changed. Television, Print, and Radio have been classic media vehicles. It wasn’t until 2004, when a new category had officially become a part of the rest. Social media began to grow exponentially in 2004, during the peak of MySpace and invention of Facebook. Although other platforms such as Six Degrees and Freindster had hit the market earlier in the 1970s to early 2000s, people began to believe social media was here to stay in about 2004. Although this was changing the landscape for all individuals, it was especially impactful for those who are now 25-34. In 2004, those individuals who are now 25 were 9-10 years old and individuals who are now 34 years old were 18 years old. This information is extremely important because of the activity level of these individuals on the internet back in the day. In 2004, 87% of teens 12-17 were using the internet, and in 2006, 55% of them were using social platforms such as MySpace or Facebook. It is obvious that this age category were the early adopters of social media in general, which is a category so influential in our world today.
Because the age cohort of individuals aged 25-34 were some of the first individuals using social media, we sought to find out exactly how they felt about social media, and how their use of social media may impact the effectiveness of other media categories. We wanted to find which media categories were the most influential to these individuals, as well as how these individuals felt about each category.
Insights
Media is used for many things such as work, play, entertainment, news, and much more. To start off we wanted to find which categories individuals aged 25-34 used for each purpose. We were able to collect both primary and secondary research to answer our questions.
To understand individuals' media habits we decided to survey where individuals got their news from. Of our survey, we found that most individuals were gathering their news and current information from social media. To further understand and back this up we ran a simmons run comparing the following sources: Social Media, Television, Radio, and Newspapers. We found that for individuals 25-34, they greatly prefered using social media to gather their news. There was something interesting about this though.
When looking at the results of our survey we found that the results for our second news related question asking where people trust news from was much different than the results of where individuals gather their information. In this question, the majority of individuals chose television.
This brought up an important point when looking at our age category. Because individuals are so well versed on social media, they can easily pick out real from fake, and may not always trust information. Research shows that millenials, who include individual ages 25-34, trust information gathered from people they know rather than traditional approaches such as celebrity endorsement.
To understand who individuals between the ages of 25-34 trust, we ran a Simmons report to understand where they were getting their entertainment. When it came to television, individuals ages 25-34 were 29% less likely to use it for entertainment, whereas other forms of social media, especially Youtube were all above average for the age cohort.
In a recent article completed by Inc. magazine, research shows that millennials actually trust Youtube more than their own parents. The reasoning for this is because of the bond and trust they form for youtubers who take them into their daily life. Although it begins as entertainment, these people become influential in many people’s lives.
Recommendations
Individuals aged 25-34 are an interesting age cohort to market to because of how well versed they are in social media. Millenials go to social media for both news and entertainment so a lot of their day is spent on the networks. This makes it the most effective media vehicle for advertisers to reach the age cohort by. In a Simmons run completed, we found that individuals of this cohort were 11% more likely than the average to purchase products that were just advertised on social media. This being said, advertisers should be aware of this when marketing to this age cohort because of how easy it is for them to distrust social media.
It is important to establish trust between a brand and the individual on the other side of the screen. When running a Simmons report about the topic we used a few statements as examples.
We found that the age cohort of 25-34 year olds was more likely to purchase products that people they knew had recommended on social media. This gives advertisers the opportunity to use social media sponsors or influencers to grab one's attention. They could also just promote the posting of their product on social media by every day users.
We also found that individuals of this age cohort were way more likely to purchase products or watch programs in which the brand or organization participated on social media themselves. This is because individuals felt even more connected with the brand.
In conclusion, we feel that social media would be an extremely helpful tool to use in marketing to individuals ages 25-34, however, marketers should first understand how to form trust between their brand and the consumers.
Health and Wellness
Findings
The health and wellness category has been gaining popularity over the years. A variety of industries including hospitality, tourism, beauty, skincare, food and beverage, have branched out to cater products associated under the umbrella of “health” and “wellness”. American’s desire to live more healthy and active lifestyles has altered the American consumer’s values and the health and wellness product category has proliferated in an attempt to meet the needs and wants of the large, emerging market. Since different individuals perceive the same products or services in a variety of ways, an analysis of the different market segments can be implemented through a psychological and attitudinal approach. The theoretical foundation for models of health and wellness exhibits several examples that attempt to incorporate the concepts of health and wellness. The National Wellness Institute (NWI) delivers a framework for a conceptual model of wellness which was developed by Bill Hettler in 1976 featuring six interrelated dimensions. The model is a combination of elements of socio-psychological and physical well-being. The socio-psychological dimensions primarily focus on the inner and personal growth needs of individuals. The physical dimensions focus on extrinsic motivation and goal-oriented incentives. Another model is known as the Indivisible Self Model (ISM), developed by Jane E. Myers and Thomas J. Sweeney, which is based on a holistic view of an entire lifespan. At the center of the model is the indivisible self which is surrounded by the essential self, social self, creative self, physical self and coping self. Each of these surrounding factors have two corresponding wellness dimensions. As the models help to provide a framework for understanding the importance and factors of health and wellness, the importance they place on elements contributing to self-actualization and self-esteem highlights how the consumers increased self-awareness is affecting their decisions.
Insights
The health and wellness marketplace is a growing and dynamic market, as consumers aspire to achieve an improved quality of life. While traditional medicine is still relied upon for treating moderate to serious concerns, consumers are looking beyond reactive medicine towards a proactive health approach. This is based upon growing skepticism in patients around preventive treatments as they focus on a symptom-to-treatment approach rather than a root-cause preventive treatment method. A proactive health approach encourages individuals to fully evaluate their health, both mental and physical, and find a holistic solution to their health problems and/or prevent future health issues. The main “treatments” are through boosting nutrient intake through food, beverages and supplements as well as avoiding products made with substances found to be harmful to the body. This approach extends to topical products such as makeup, skincare, haircare and even appears in the pursuit of leisure activities such as exercising and meditating.
According to a study on health and wellness in America conducted in 2014, there are four key themes that act as the foundation for the consumer perspective on health and wellness. The first theme highlights the consumers desire to learn about their own health and nutrition while the second theme represents the consumers desire for a healthy lifestyle and how their behavior correlates to their attitude. The third theme demonstrates how food can be used as medicine and the fourth theme further characterizes the differences in purchase behavior across defined consumer segments.
Overall, consumers search for information about health and nutrition to take control of their health and improve the quality of their lives. In today’s age of technology, consumers have access to countless sources and authorities for health and wellness. For the age cohort, 25-34, also known as millennials, who are familiar with turning to the internet for instant information it is very easy to research ingredient lists and use this information to drive decisions. Furthermore, information found online can be supported by third party reviews and comments for a comprehensive overview of almost any product. Millennials are driven to purchase products to support their health and wellness through a concern for future health problems and an interest in achieving a high quality of life. This is represented in their ingredient preferences, such as calcium, vitamins/minerals and fiber, which are similar to that of the Baby Boomer cohort only at a lower level.
The desire to live a healthy lifestyle and actually adopting the wellness practices necessary to do so are often achieved with varying levels of success. This is due to a gap in the aspirational desires and the actual behavior of consumers. More consumers are likely to pledge a commitment to proper nutrition and exercise in order to take responsibility for one's health however many find it a challenge to eat healthy. The desire is fueled by the concern for health issues as one ages in addition to a concern regarding weight. However, the actual application of these desires faces barriers when consumers view rising food prices and taste as deterrents for healthy eating.
Within our age cohort of 25 to 34, health is valued above everything at 53% except family which 79% said was most important to them, followed by friends at 39%, spirituality at 31% and career at 27%. As a generation that defines healthy eats healthier, exercises more and smokes less, almost half consider healthy eating to be a lifestyle choice instead of a means to lose weight. Millennials spend more on health and fitness than older generations and they integrate apps and technology to help stay healthy. A major difference from older generations is that millennials are selective of brands that both anticipate their needs and help them discover new things, while supporting their values and being consistent with the images they want to convey to themselves and others.
In regard to health and wellness, the age cohort of individuals 25 to 34 shows differences between men and women. Women are 13% more inclined to improve their diets to include healthier products and ingredients, 26% more likely to shop for organic or natural foods, 37% more likely try new foods and 30% more likely to try a new nutritional product. They are also 86% more likely to track calories and exercise through apps or websites, 25% more likely to gather health information from websites and 30% more likely to trust homeopathic medicine (30%). While these results show a positive attitude and behavior on behalf of women, men on the other hand are a little less likely to take the same actions on behalf of their health and wellness. Men are only 14% more likely to try new health foods. They are 25% less likely to eat a well-balanced diet, 25% less likely to trust homeopathic medicine and neither more or less likely to shop for organic or natural foods, gather health information from websites, try new nutritional products or track calories and exercise on an app or website.
Millennials’ are dedicated to wellness, devoting both their time and money to exercising and eating properly, this dedication to an active lifestyle influences trends in everything from food and drink to fashion. The rise of health and wellness can be seen through the proliferation of the functional food and beverage industry, supplements, health and wellness devices such as fitness trackers, athletic wear and chains of workout studios. Millennials more than any other age group believe that functional foods can replace some medications, they are also the consumer group with the highest consumption of functional beverages. 57% of consumers aged 25-34 have demonstrated use of all segments within the functional beverage category from sports drinks, weight loss drinks to meal replacement.
Recommendations
Based on the results, the age cohort 25 to 34 would respond more towards health and wellness products that are properly labelled. As a generation that values authenticity and transparency, a label with data and information on ingredients used as well as processing and growing information would properly inform and motivate these consumers to purchase products. Highlighting ingredients that boost antioxidants, vitamins, adaptogens and other supplements such as melatonin, collagen and probiotics are all factors that appeal to consumers between ages 24 to 35. The health benefits these ingredients provide bolster the pursuit of a healthy diet and lifestyle. This corresponds with the cohorts aspirational desires and self-image as well as the importance of maintaining a healthy, holistic lifestyle.
Additionally, in order to close the gap between aspiration and behavior, products should focus on introducing easy and convenient solutions while exploring specific health issues aid in the consumer purchase decision process. This includes providing easy ways to track calories, nutrition intake and exercise to manage intake and monitor progress. These programs can manage impulses and retrain bad habits through positive reinforcement.
In conclusion, health and wellness products that embrace the values of authenticity and transparency of this generation while allowing them to further improve their overall quality of life are most sought out by this cohort.
Bibliography
Balcarová, Tereza, J. Pokorná, and Ladislav Pilař. “The Influence of Children on the Parents Buying Behavior: Food Purchase in the Czech Republic.” Agris on-line Papers in Economics and Informatics 6, no. 2 (2014): 11-19. Accessed March 3, 2020. https://www.researchgate.net/publication/286123717_The_Influence_of_Children_on_the_Parents_Buying_Behavior_Food_Purchase_in_the_Czech_Republic
Beauchamp, Gary K., and Marianne Moran. “Dietary Experience and Sweet Taste Preference in Human Infants.” Appetite 3, no. 2 (1982): 139-152. Accessed March 3, 2020.
Brandon, John. “Shocking New Study Says Millennials Trust YouTube and Social Media More Than Their Parents. Not So Fast There, Millennial Haters.” Inc.com. April 9, 2019. Accessed April 27, 2020. https://www.inc.com/john-brandon/this-shocking-new-study-says-millennials-trust-youtube-social-media-more-than-their-parents-not-so-fast-there-millennial-haters.html.
Buijzen, Moniek, and Patti M. Valkenburg. “Observing Purchase-Related Parent–Child Communication in Retail Environments: A Developmental and Socialization Perspective.” Human Communication Research 34, no. 1 (2008): 50-69. Accessed March 3, 2020.
“Cow's milk and children.” MedlinePlus. Last updated March 23, 2020. Accessed March 25, 2020. https://medlineplus.gov/ency/article/001973.htm.
Dortch, Shannon. “Going to the Movies” 18, no. 12. Accessed March 15, 2020.
Dougherty, Maureen, Mary Story, and Jamie Stang. “Observations of Parent-Child Co-Shoppers in Supermarkets: Children’s Involvement in Food Selections, Parental Yielding, and Refusal Strategies.” Journal of Nutrition Education and Behavior 38, no. 3 (2006): 183-188. Accessed March 25, 2020.
Fornerino, Marianela, Agnès Helme-Guizon, and David Gotteland. “Movie Consumption Experience and Immersion: Impact on Satisfaction.” Recherche et Applications En Marketing (English Edition) (AFM c/o ESCP-EAP) 23, no. 3 (September 2008): 93–109. Accessed March 15, 2020.
Frey, Sherry, and Steve French. “Health & Wellness in America.” Nielsen and Natural Marketing Institute. August, 2014. Accessed March 16. http://www.nmisolutions.com/opt/consmrwhitepapr/Health__Wellness_Consumer_Whitepaper_August%202014F%20(2).pdf
Greiner, Andrew. “This candy is the favorite for Halloween kids.” YouGov. September 18, 2019. Accessed March 25, 2020. https://today.yougov.com/topics/food/articles-reports/2019/09/18/candy-favorite-halloween-kids.
Hettler, Bill. “Six Dimensions of Wellness Model.” National Wellness Institute, Inc. 1976. Accessed March 16, 2020. https://cdn.ymaws.com/www.nationalwellness.org/resource/resmgr/pdfs/SixDimensionsFactSheet.pdf
Jones, Matthew, Louise, Larry Bird, George, Mike Wheeler, Anna, Sharon, et al. “The Complete History of Social Media: The Founding of Online Networking.” History Cooperative. June 16, 2015. Accessed April 22, 2020. https://historycooperative.org/the-history-of-social-media/.
Lee, Jaeseok, Chih-Chien Chen, Hak-Jun Song, and Choong-Ki Lee. “Consumption of Movie Experience: Cognitive and Affective Approaches.” Quality Assurance in Hospitality and Tourism 18, no. 2 (n.d.): 173–99. Accessed March 15, 2020.
Lenhart, Amanda, Mary Madden, Aaron Smith, Kristen Purcell, and Kathryn Zickuhr. “Part 1: Teens and Social Networks.” Pew Research Center: Internet, Science & Tech. November 9, 2011. Accessed on December 31, 2019. https://www.pewresearch.org/internet/2011/11/09/part-1-teens-and-social-networks/#internet-adoption-over-time-by-teens-and-adults.
Linshi, Jack. “Why Millennials Need to Develop a Taste for Frozen Food.” Time. October 22, 2014. Accessed April 1, 2020. https://time.com/3529202/millennials-frozen-food/.
Mahdawi, Arwa. “Millennials Are Making Frozen Food Hot Again, but Can They Stop Killing Everything Else?” The Guardian. May 14, 2018. Accessed April 11, 2020. https://www.theguardian.com/environment/2018/may/14/millennials-frozen-food-what-industries-killed-saved.
Maison, Dominika, Anthony G. Greenwald, and Ralph Bruin. “The Implicit Association Test as a measure of implicit consumer attitudes.” Polish Psychological Bulletin 32, no.1 (2001). Accessed March 25, 2020.
Martin, Joyce A., Brady E. Hamilton, Michelle Osterman, and Anne K. Driscoll. “Births: Final Data for 2018.” National Vital Statistics Reports 68, no. 13 (2019). Accessed March 3, 2020. https://www.cdc.gov/nchs/data/nvsr/nvsr68/nvsr68_13-508.pdf.
“Millennials & Functional Beverages.” FONA International. October 19, 2015. Accessed April 10, 2020. https://www.fona.com/millennials-functional-beverages/
Mohsin, Maryam. “10 Social Media Statistics You Need to Know in 2020 [Infographic].” Oberlo. February 7, 2020. March 23, 2020. https://www.oberlo.com/blog/social-media-marketing-statistics.
MRI-Simmons, “Fall 2017 National Household Consumer Survey Adult Study 12 Month.” Accessed February 27, 2020. Simmons Insights.
MRI-Simmons, “Fall 2017 National Household Consumer Survey Adult Study 12 Month.” Accessed March 12, 2020. Simmons Insights.
MRI-Simmons, “Fall 2017 National Household Consumer Survey Adult Study 12 Month.” Accessed March 15, 2020. Simmons Insights.
MRI-Simmons, “Fall 2017 National Household Consumer Survey Adult Study 12 Month.” Accessed March 16, 2020. Simmons Insights.
MRI-Simmons, “Fall 2017 National Household Consumer Survey Adult Study 12 Month.” Accessed March 20, 2020. Simmons Insights.
MRI-Simmons, “Fall 2017 National Household Consumer Survey Adult Study 12 Month.” Accessed March 21, 2020. Simmons Insights.
MRI-Simmons, “Fall 2017 National Household Consumer Survey Adult Study 12 Month.” Accessed March 22, 2020. Simmons Insights.
MRI-Simmons, “Fall 2017 National Household Consumer Survey Adult Study 12 Month.” Accessed March 30, 2020. Simmons Insights.
MRI-Simmons, “Fall 2017 National Household Consumer Survey Adult Study 12 Month.” Accessed April 9, 2020. Simmons Insights.
MRI-Simmons, “Fall 2017 National Household Consumer Survey Adult Study 12 Month.” Accessed April 10, 2020. Simmons Insights.
Myers, Jane E., and Thomas J. Sweeney. “The Indivisible Self: An Evidence-Based Model of Wellness.” Journal of Individual Psychology 60, no. 3 (2004): 234-245. Accessed March 16, 2020. https://pdfs.semanticscholar.org/f345/ee44e2f14c74f43fddac1f771376706270cf.pdf
Nermoe, Katie. “Millennials: The ‘Wellness Generation’.” Sanford Health News. September 12, 2018. Accessed January 31, 2020. https://news.sanfordhealth.org/sanford-health-plan/millennials-wellness-generation/
“NEW LOOK, NEW BOWLS, AND MORE OF WHAT YOU LOVE.” Lean Cuisine. Accessed April 26, 2020. Accessed April 12, 2020. https://www.leancuisine.com/?gclsrc=aw.ds&&gclid=EAIaIQobChMIjuOhn-GE6QIVDD0MCh0JUQa6EAAYASAAEgJW0_D_BwE.
Odell, Patty. “Lean Cuisine's Package Redesign Drives $58 Million Sales Increase in One Year.” Chief Marketer. May 4, 2017. Accessed April 14, 2020. https://www.chiefmarketer.com/lean-cuisines-package-redesign-drives-58-million-sales-increase-in-one-year/.
Sagin, Erin.“10 Stats That Will Make You Rethink Marketing to Millennials.” WordStream. Last updated February 12, 2020. Accessed April 27, 2020. https://www.wordstream.com/blog/ws/2016/02/02/marketing-to-millennials.
Staff, Eater. “The Strange History of Frozen Food.” Eater, August 21, 2014. Accessed March 22. https://www.eater.com/2014/8/21/6214423/the-strange-history-of-frozen-food-from-clarence-birdseye-to-the.
Tefertiller, Alec. 2017. “Moviegoing in the Netflix Age: Gratifications, Planned Behavior, and Theatrical Attendance.” Communication & Society 30 (4): 27–44. Accessed March 15, 2020.
“Mindful eating: 5 ways millennials are driving healthier diets.” The Florida Times-Union - Jacksonville.com. March 15, 2018. Accessed April 26, 2020. https://www.jacksonville.com/lifestyle/20180315/mindful-eating-5-ways-millennials-are-driving-healthier-diets?template=ampart.
Villena, Kayla. “Millennial Beauty.” Euromonitor. January 21, 2019. Accessed March 15, 2020. https://blog.euromonitor.com/millennial-beauty/
“Why Are so Many People Going Vegan?” Million Dollar Vegan. March 6, 2019. Accessed April 8, 2020. https://www.milliondollarvegan.com/vegan-trending-millennials/.
Like this project
Posted Apr 22, 2021