Retail Store Clustering
Harsh Modi
This project started with retail store data of a company and they wanted to cluster it and then create a strategy for that. Data provided by them did not contain good parameters to cluster so I needed to calculate some custom KPIs and then cluster them and gave recommendation according to that.
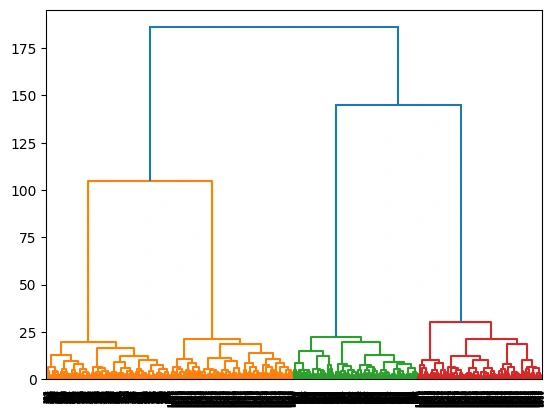
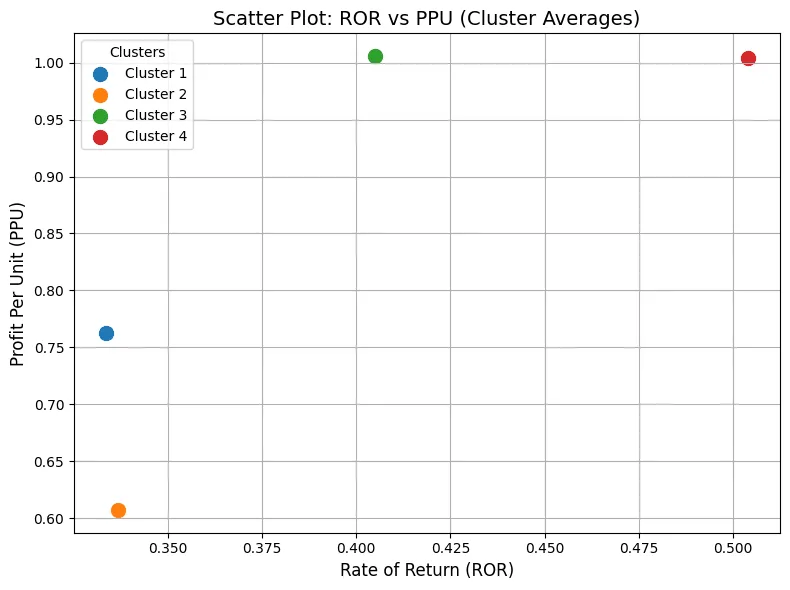
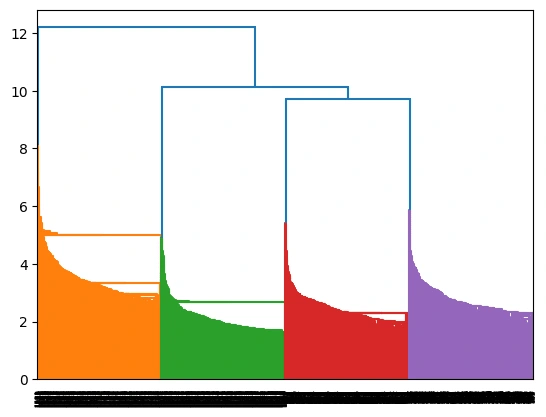
This project involves clustering supermarket stores based on various metrics to identify distinct groups and provide tailored recommendations for each cluster. The clustering analysis revealed four distinct clusters, each with unique characteristics and challenges:
Cluster 1: Value Seekers
Characteristics:
Second highest quantity per customer and profit per unit (PPU).
Low return on sales, possibly due to offering products with lower contribution margins and high discounts.
Second highest revenue but low revenue per customer.
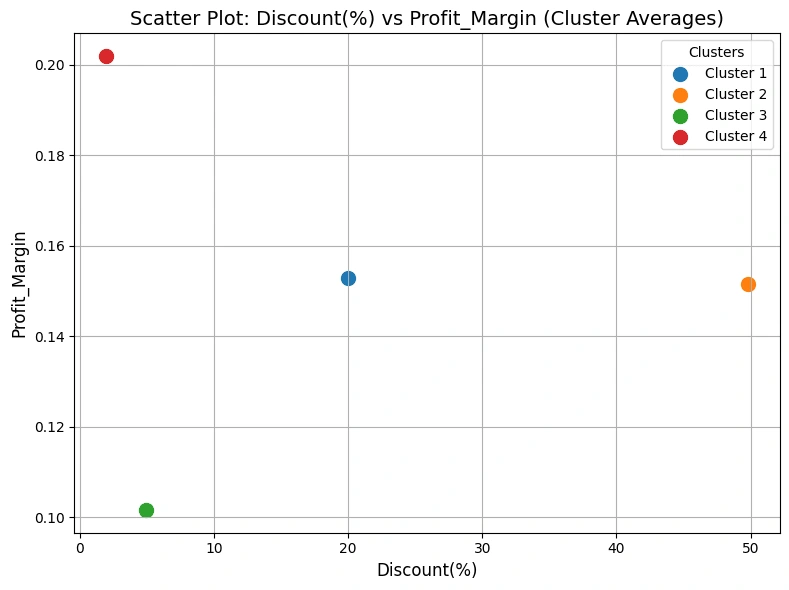
Cluster 2: Discount-Driven Stars
Characteristics:
Highest sales, revenue, and profit, but lowest PPU due to very high discounts.
Second highest revenue per customer, indicating bulk purchases and high basket value.
Cluster 3: High-Margin Specialists
Characteristics:
Highest PPU but lowest quantity per SKU (QPS), indicating low sales volume per product.
Least profit per revenue (PPR), suggesting inefficient cost recovery.
Low quantity per customer, likely due to low discounts.
Cluster 4: Niche Players
Characteristics:
Highest profit margins but very high returns, negatively impacting revenue-to-sales ratio.
Low business per customer across all metrics (revenue, item, quantity) due to offering only one SKU.
Recommendations:
Value Seekers: Enhance product mix with higher margin items and encourage higher sales volume per customer.
Discount-Driven Stars: Optimize discount strategy to balance customer attraction with profitability and manage return rates.
High-Margin Specialists: Use strategic discounts and product bundling to increase sales volume and reduce return rates.
Niche Players: Diversify product offerings to attract more business per customer and implement measures to reduce returns.
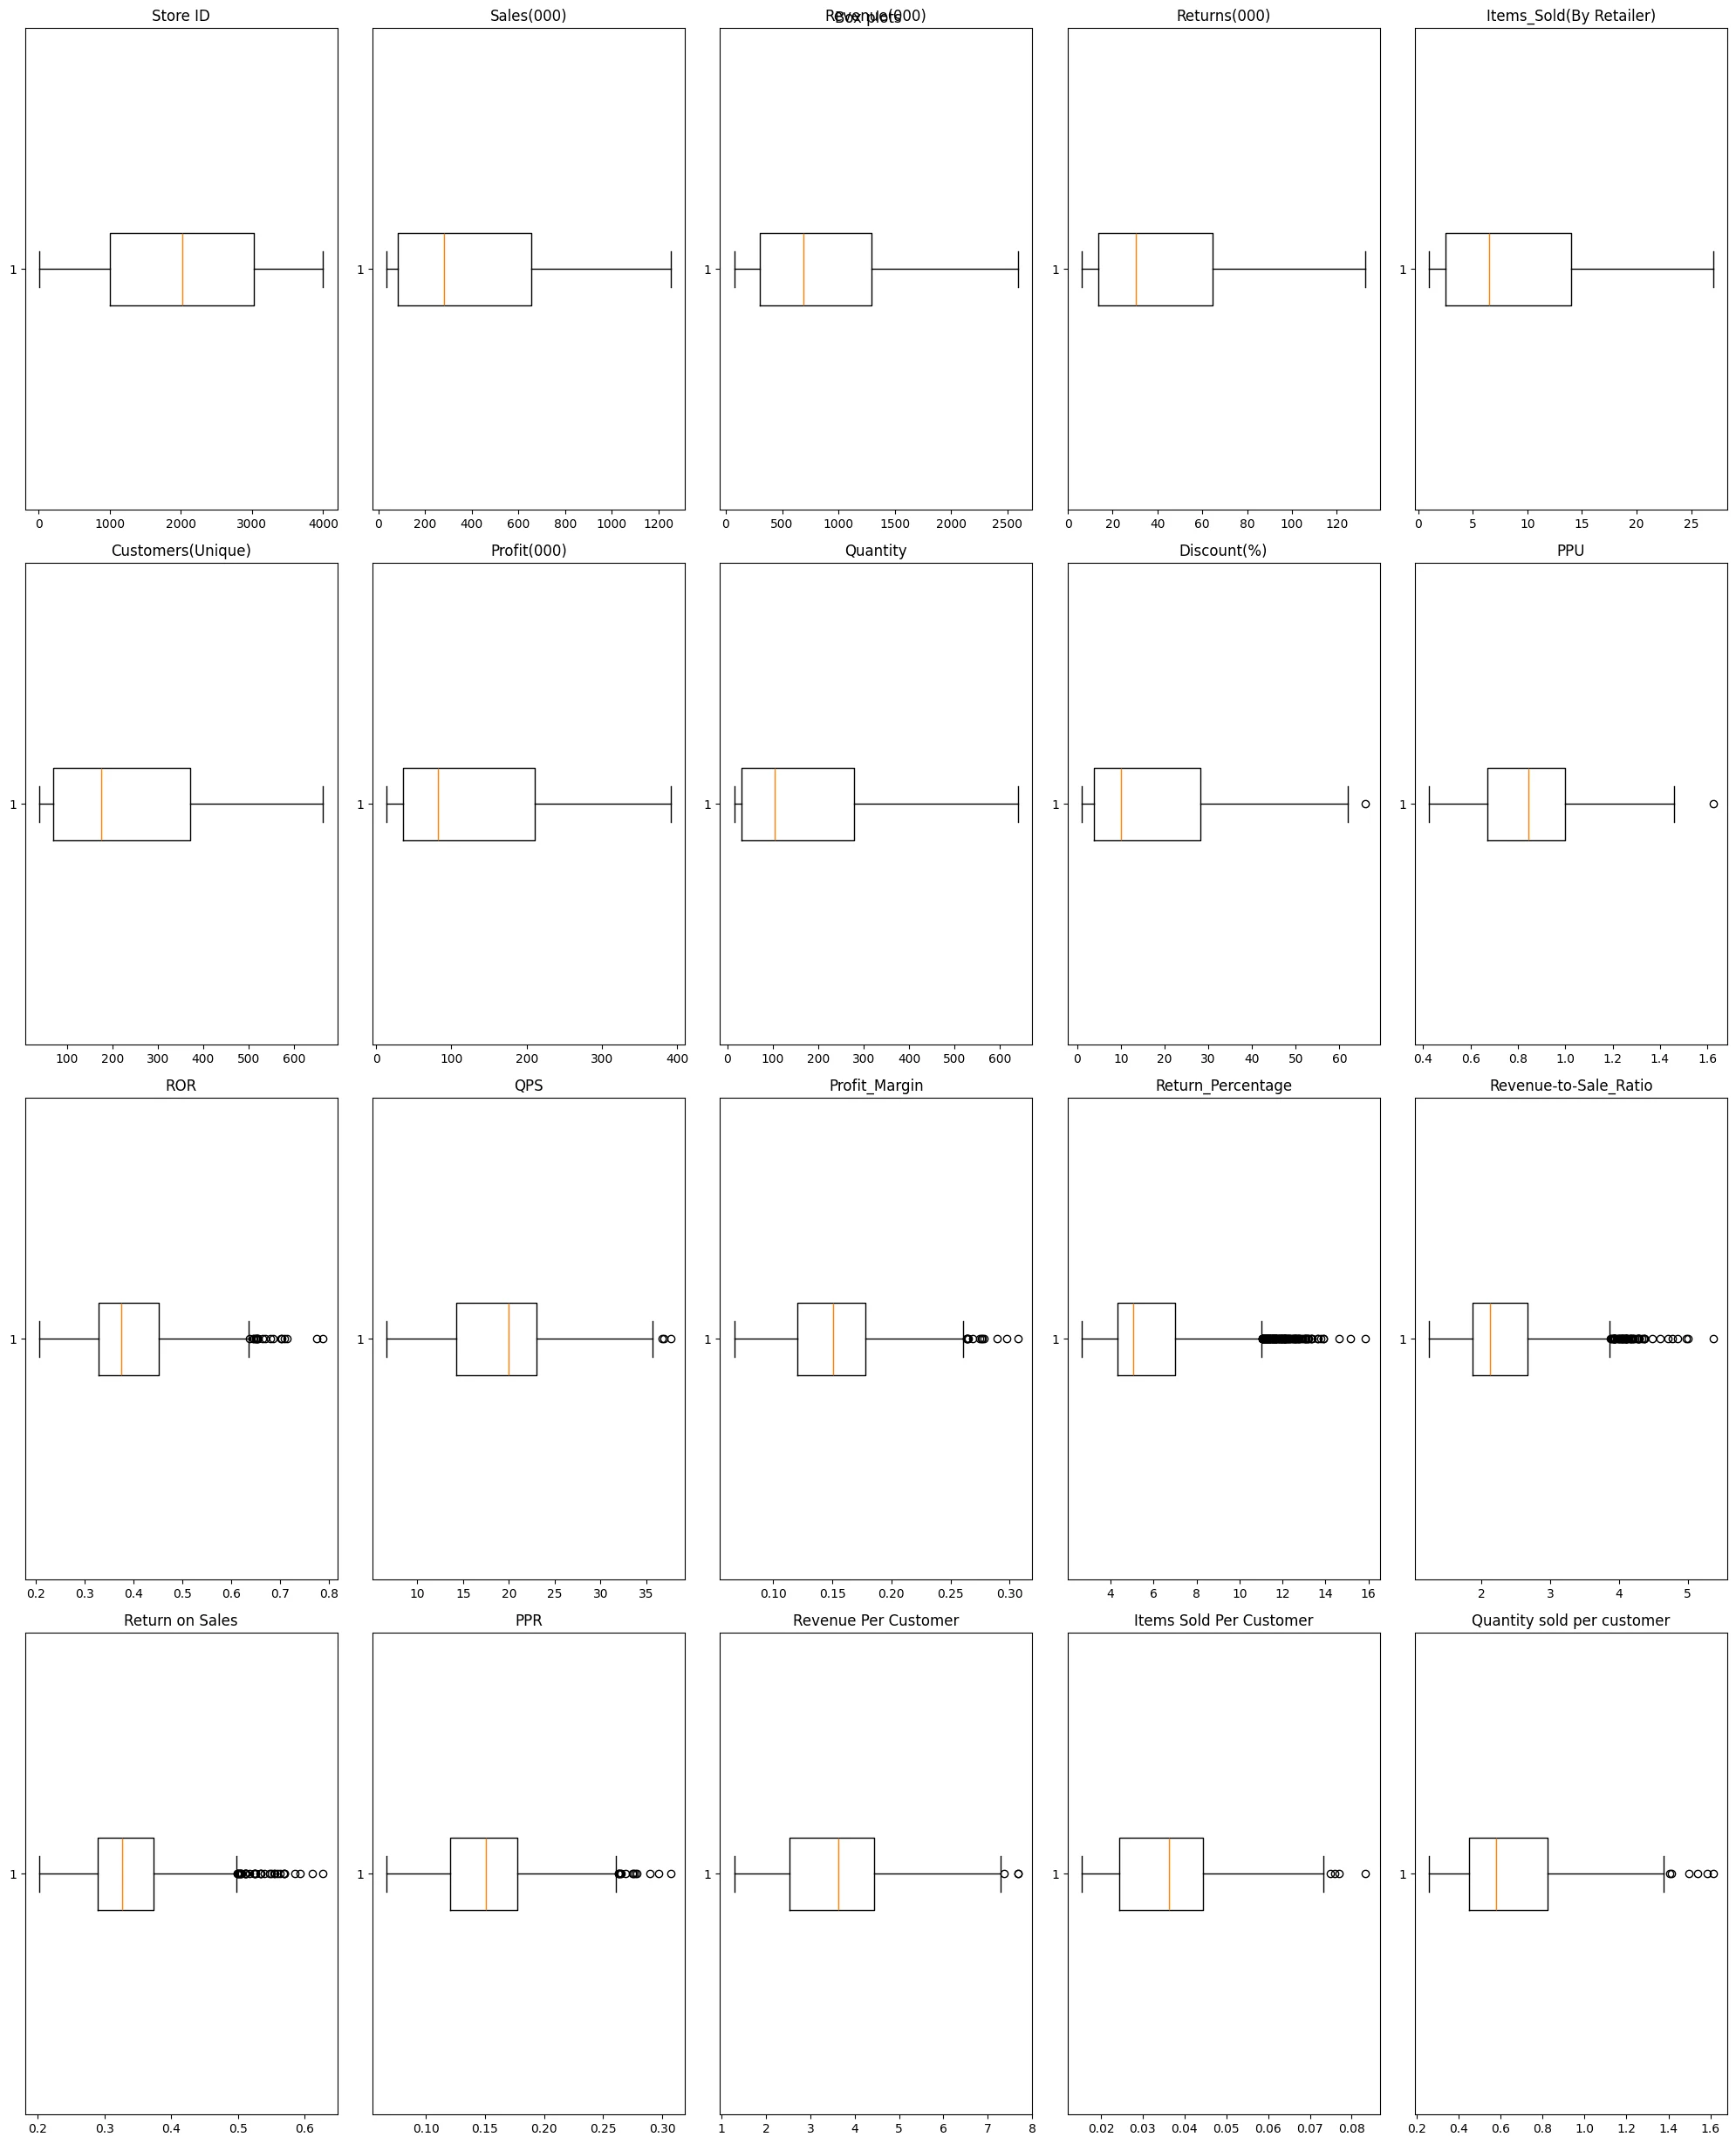
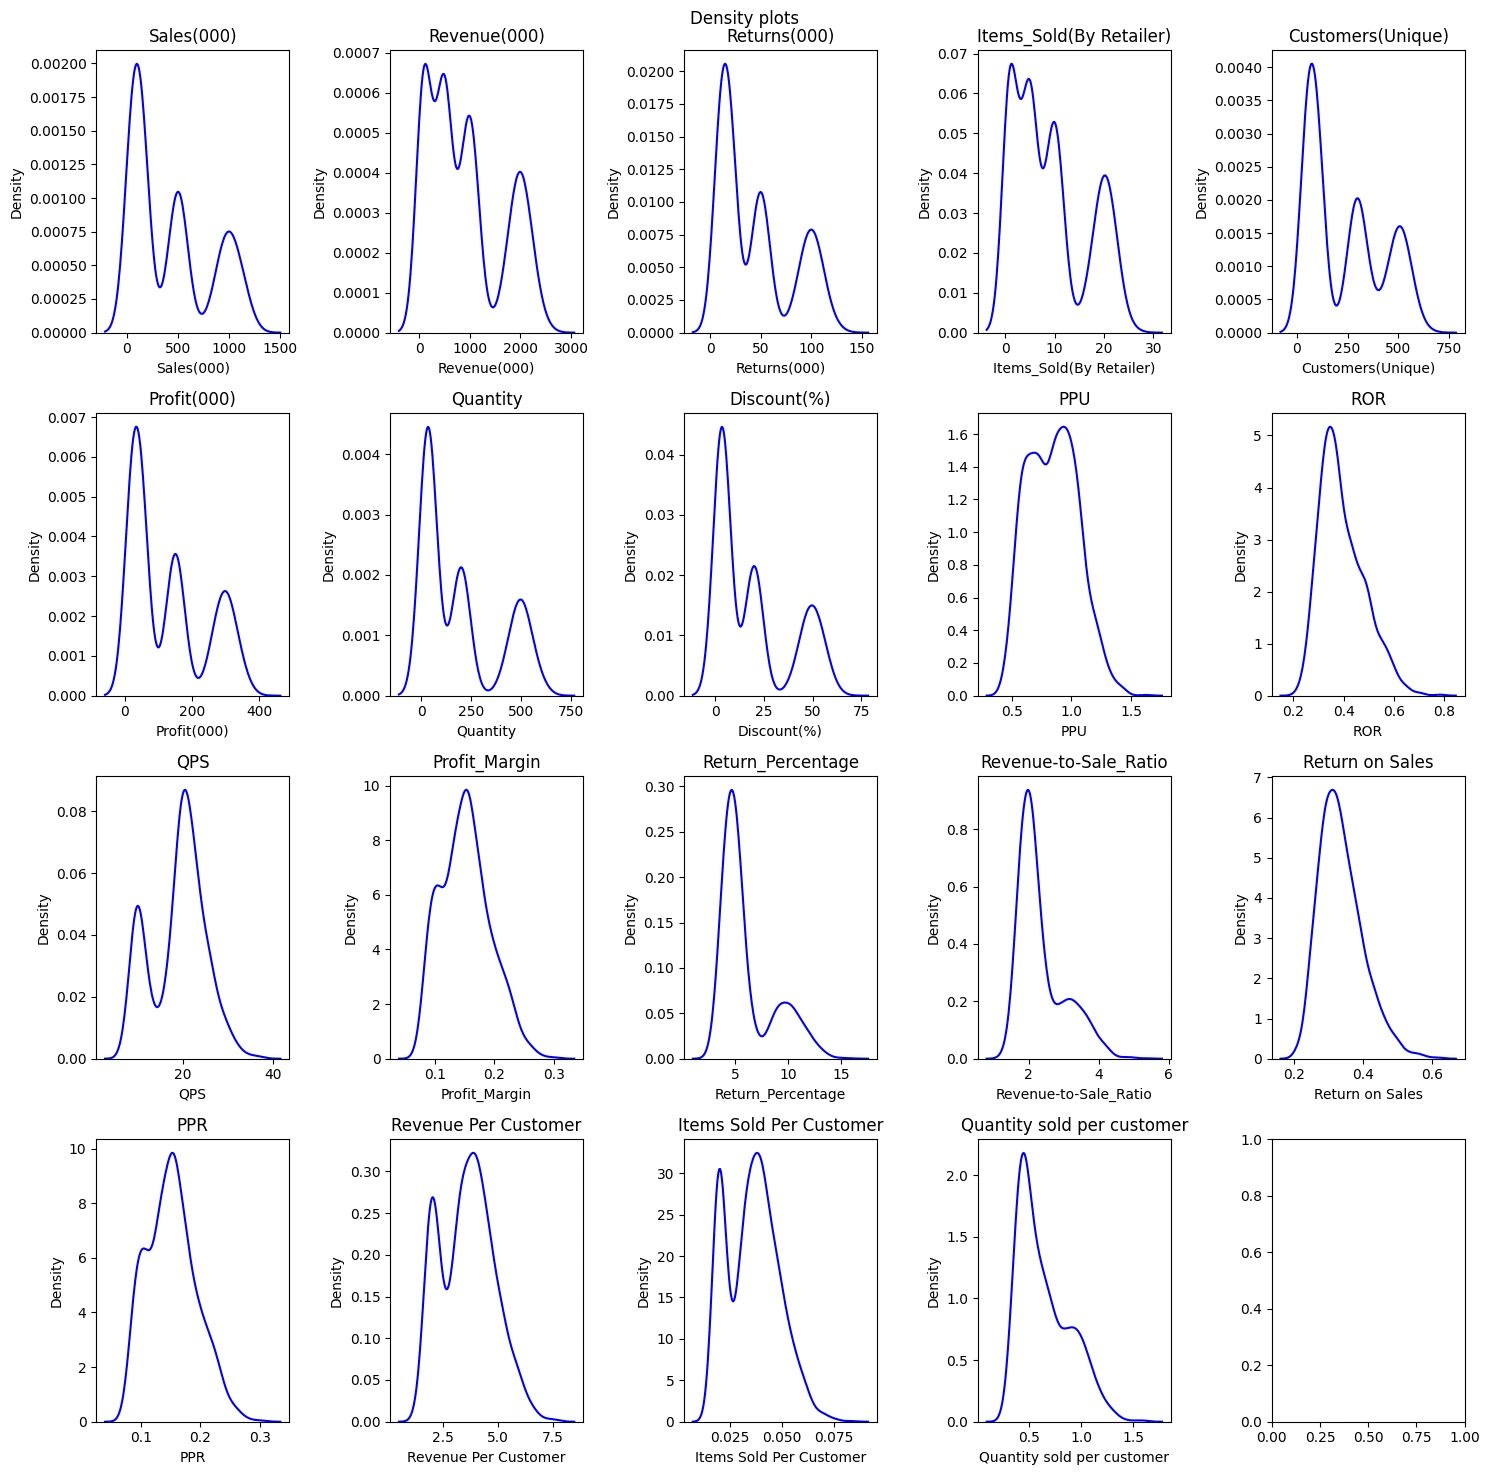
Following are some of the related graphs:
D
Like this project
Posted Dec 11, 2024
Clustering stores into four groups based on sales metrics, identifying unique characteristics and providing tailored recommendations to improve performance.