Looker Studio Budgeting Dashboard
Kresimir Peraic
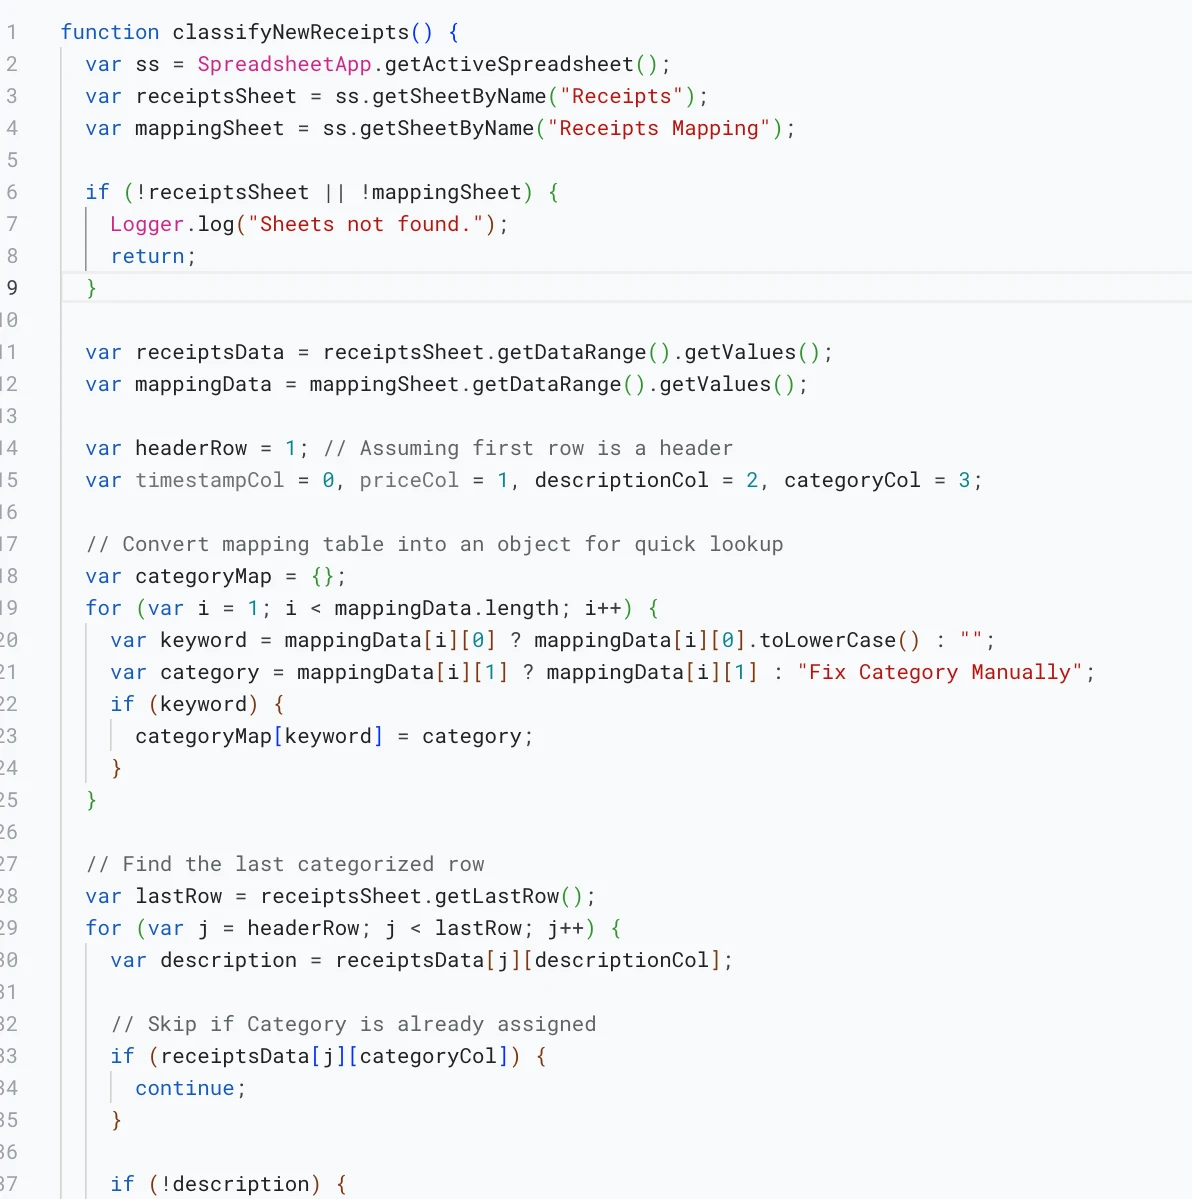
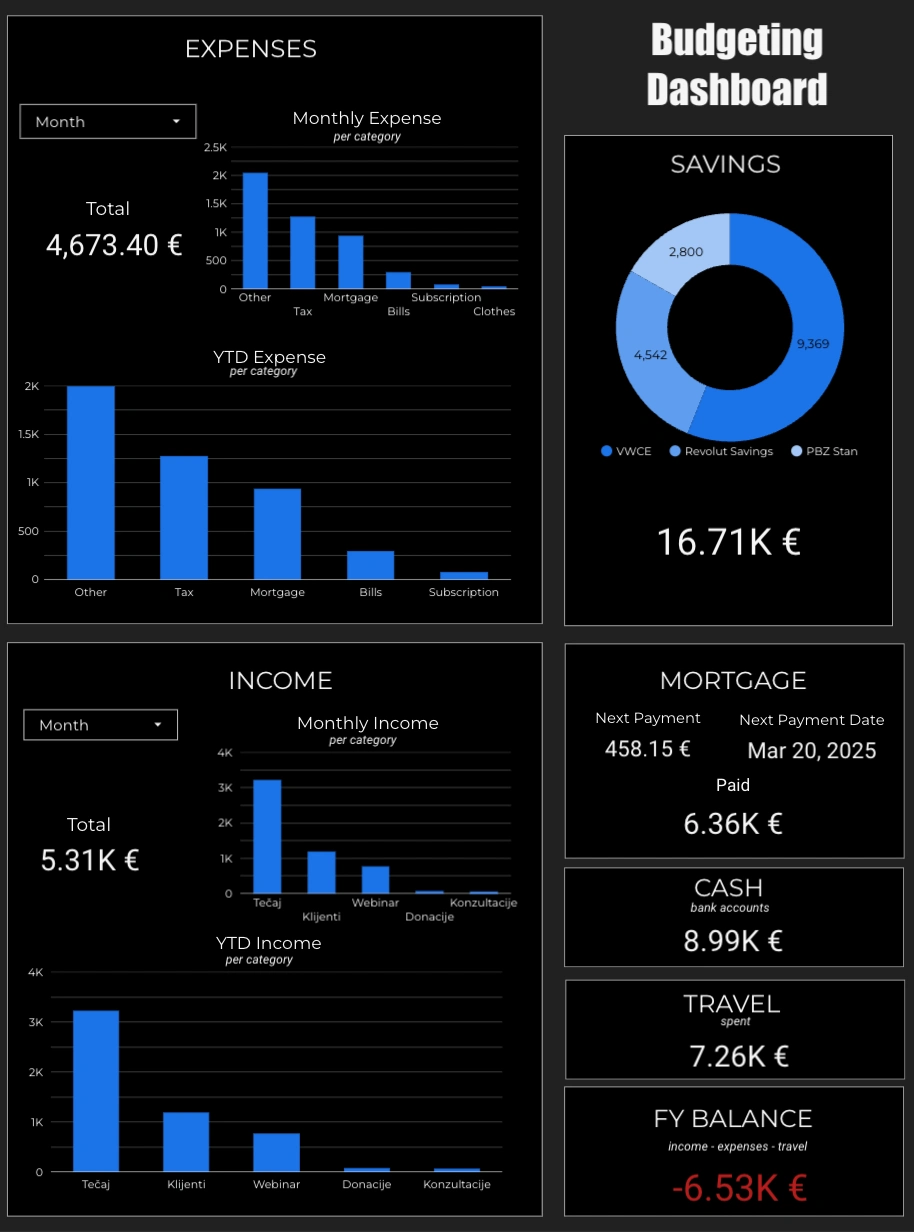
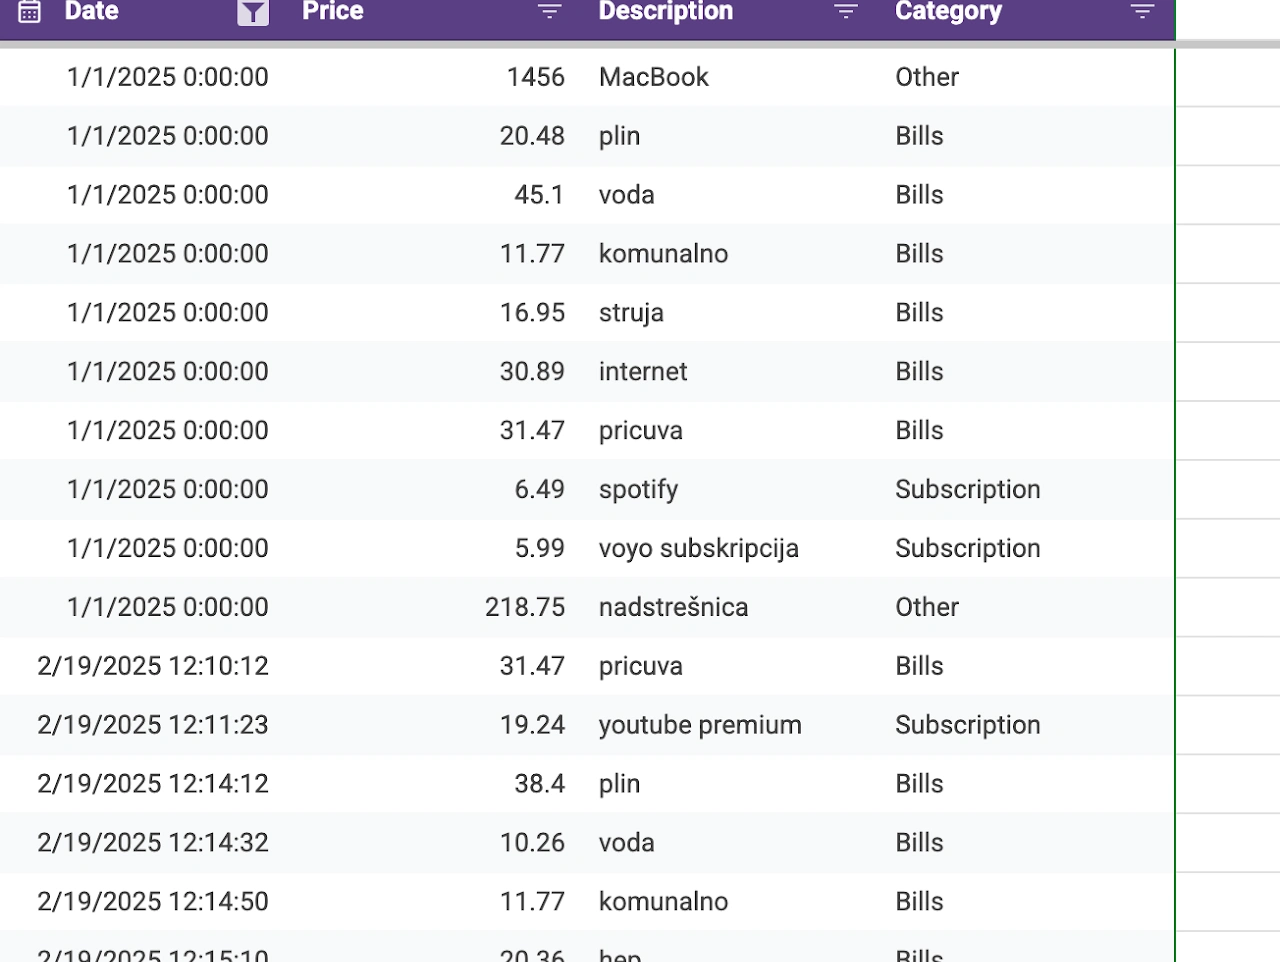
Created an interactive budgeting dashboard in Looker Studio. Dashboard pulls data from multiple Google Sheets. Google Sheets gets data via Google Forms and automatically categorizes expenses in categories via Apps Script. Report contains monthly expenses and income per categories, filterable by month. On top there is a Savings overview, Mortgage overview, Cash overview and Balance overview.
Like this project
Posted Mar 28, 2025
Looker Studio Budgeting Dashboard