Patterns for Health: Visualizing Cross-Ventilation Systems
Isaac Martinotti
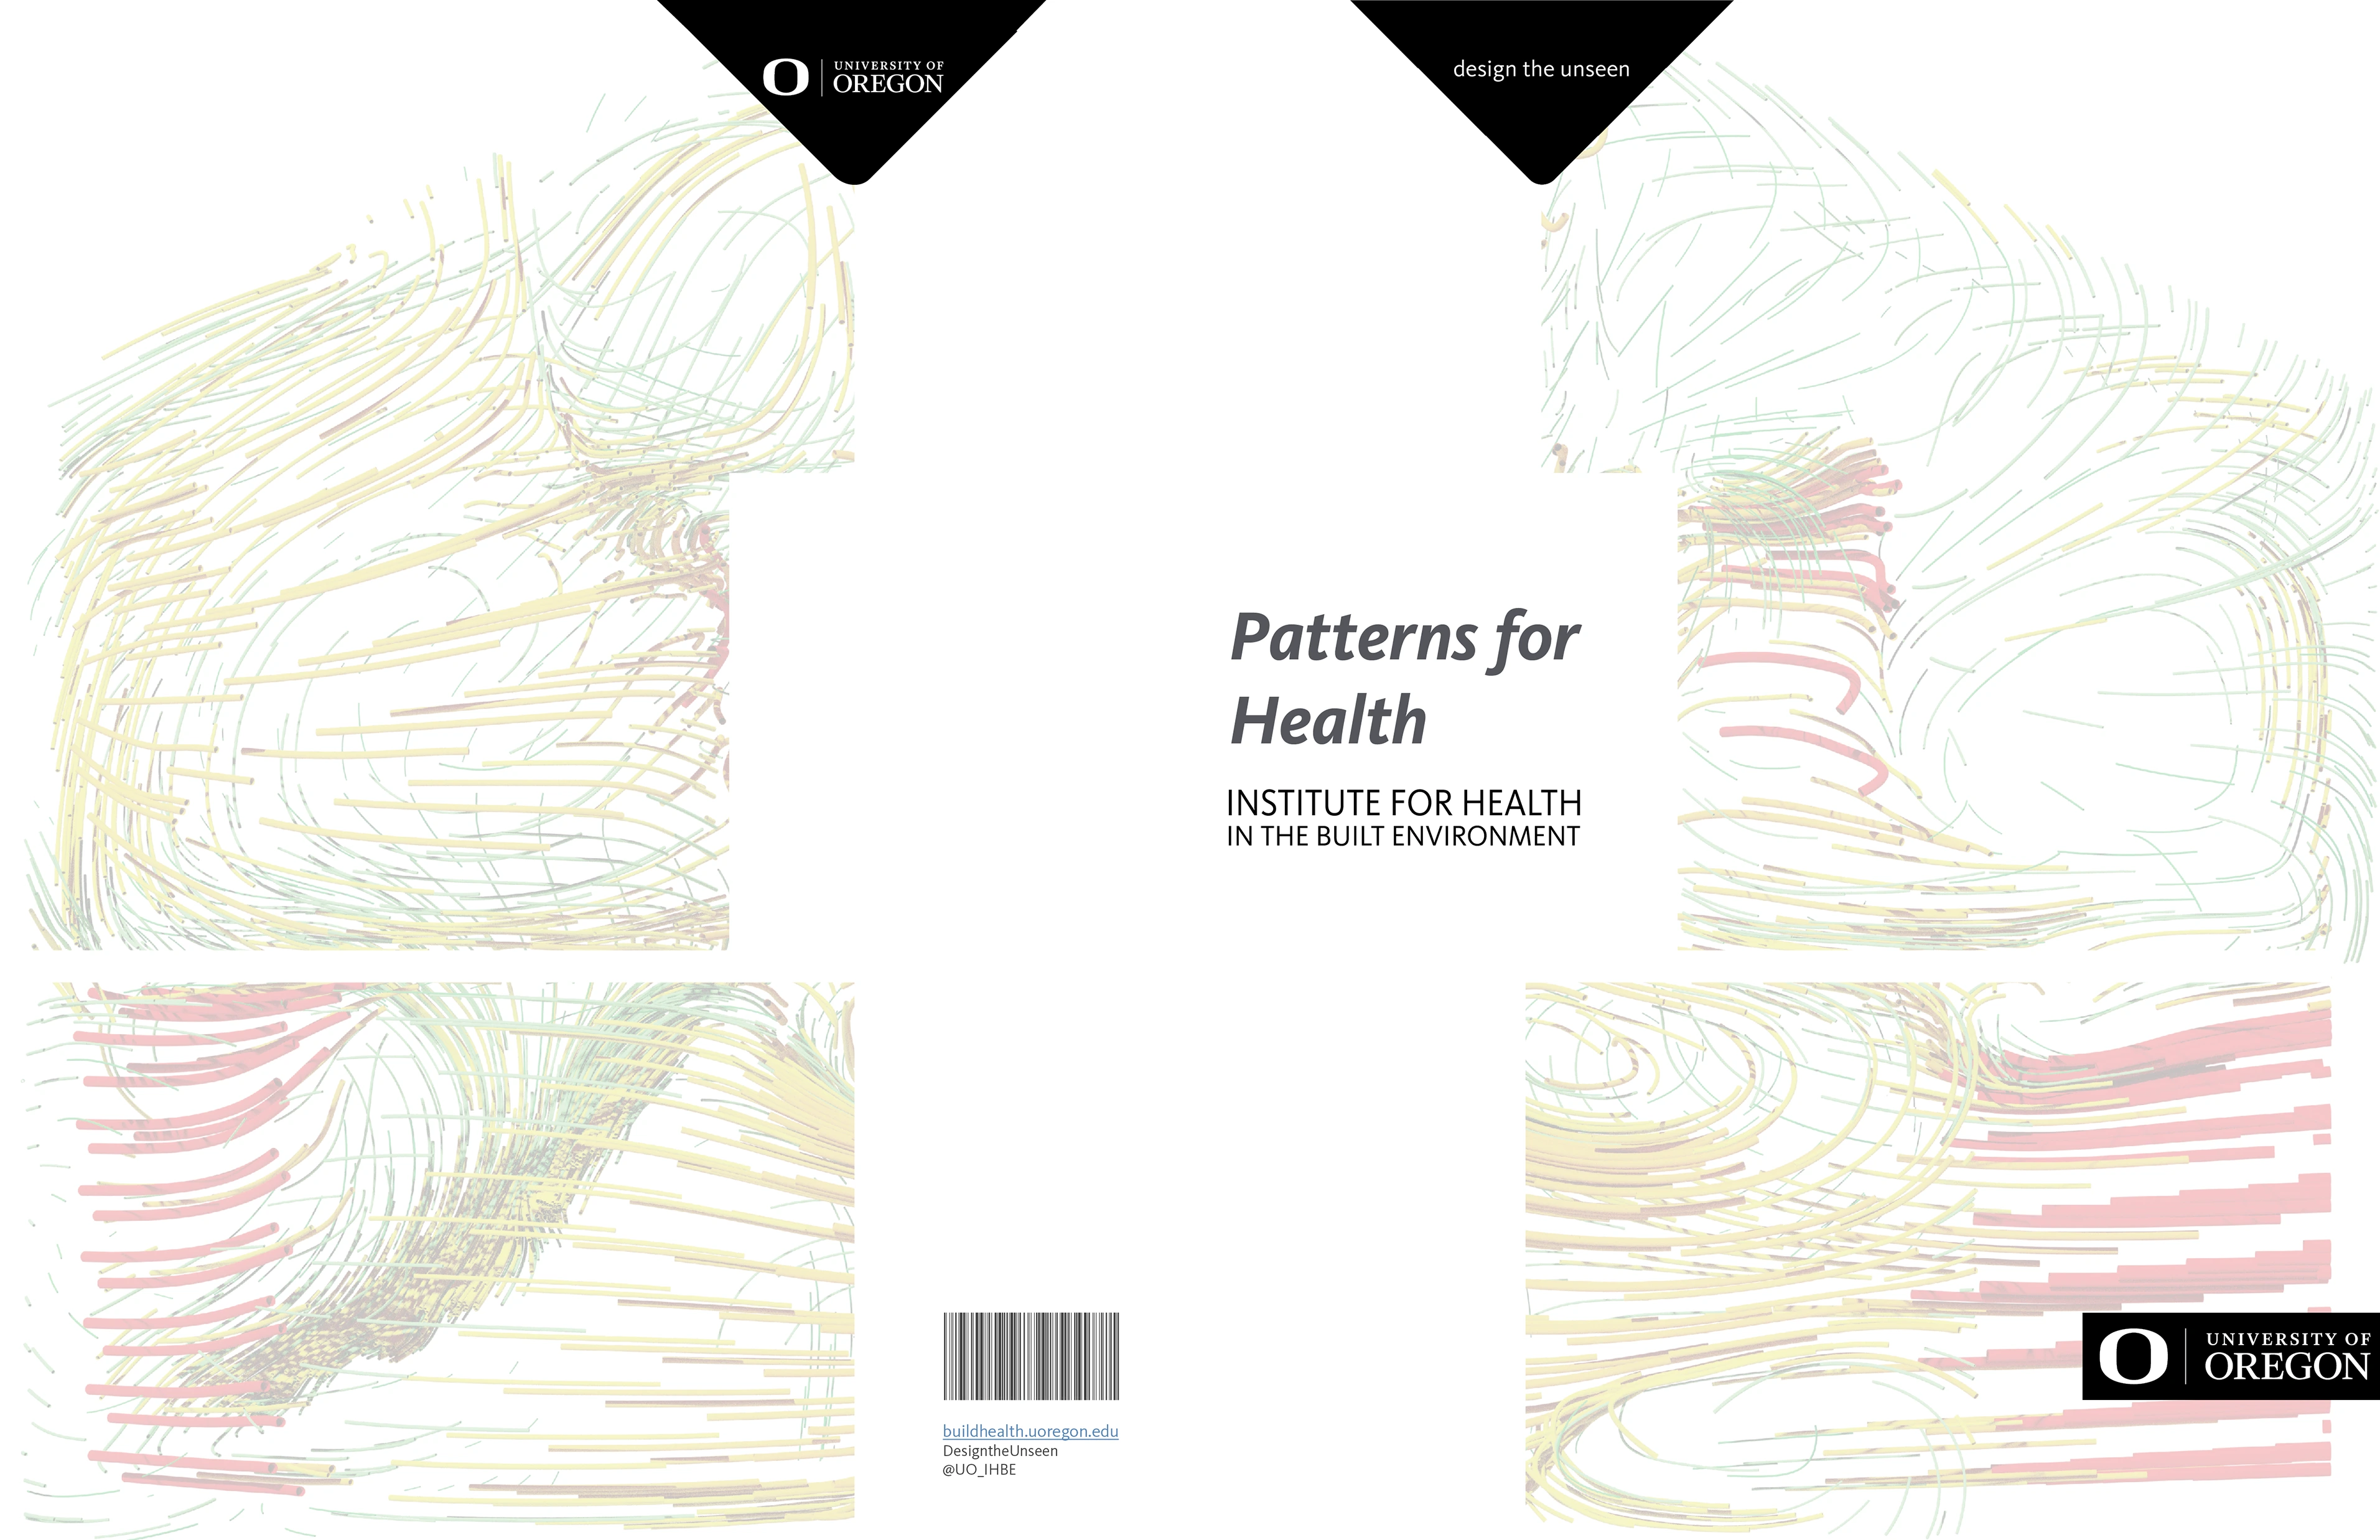
Patterns for Health, a parametric visualization system created in combination with a pattern language to visually explain various cross-ventilation systems and their impact on small dwellings
Worked independently - but part of a larger research proposal - to create a parametric system for understanding how exterior weather impacts indoor health. As the primary researcher and computational designer for the 'Patterns for Health' project, my role was central to its development. I conceived and built the entire computational pipeline, using Rhino/Grasshopper and Python to script and integrate diverse simulation tools like OpenFoam (CFD), SafeAirspaces, and ClimateStudio. My work involved transforming raw simulation data into easily understandable visual outputs, creating both static, data-dense images and dynamic animations using Blender and the Adobe Suite. I also developed the case study examples and prototyped the user interface concepts, aiming to translate complex scientific research into an accessible tool for public use.
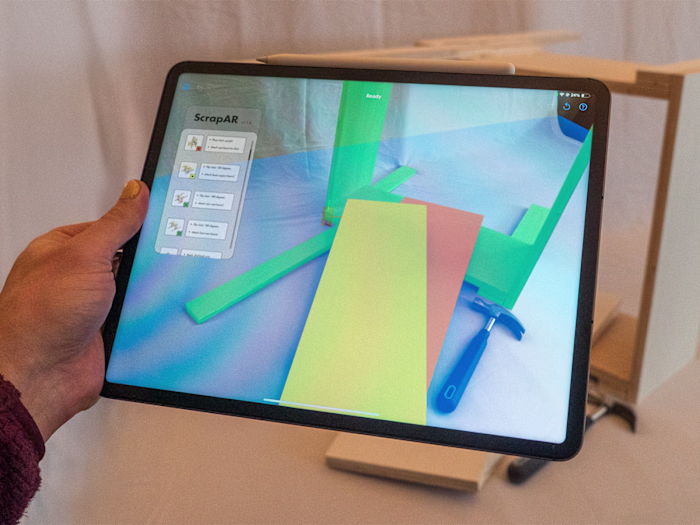
The 'Patterns for Health' project was born from the desire to make healthy building design accessible to everyone, not just experts. We saw that while valuable 'rules of thumb' exist, like those in the Daylighting Pattern Guide, they often require a base level of design understanding that many homeowners lack and tend to focus on single issues. Our goal was to create an intuitive, parametric web tool that provides instant feedback, allowing non-professionals to diagnose issues within their spaces and discover specific, actionable solutions to improve daylight, air quality, and overall health, thereby democratizing the creation of healthier environments.
• Automated Workflows - Rhino/Grasshopper & Python
• Building Performance Simulation - OpenFOAM for CFD & Radiance for daylighting analysis
• 3D Modeling & Visualization - Blender & AfterEffects
• Health & Comfort Metrics - SafeAirspaces, various daylight metrics (PPD, sDA, Viral Deg)
• UI / UX - InDesign for data merging, Figma for webtool prototyping
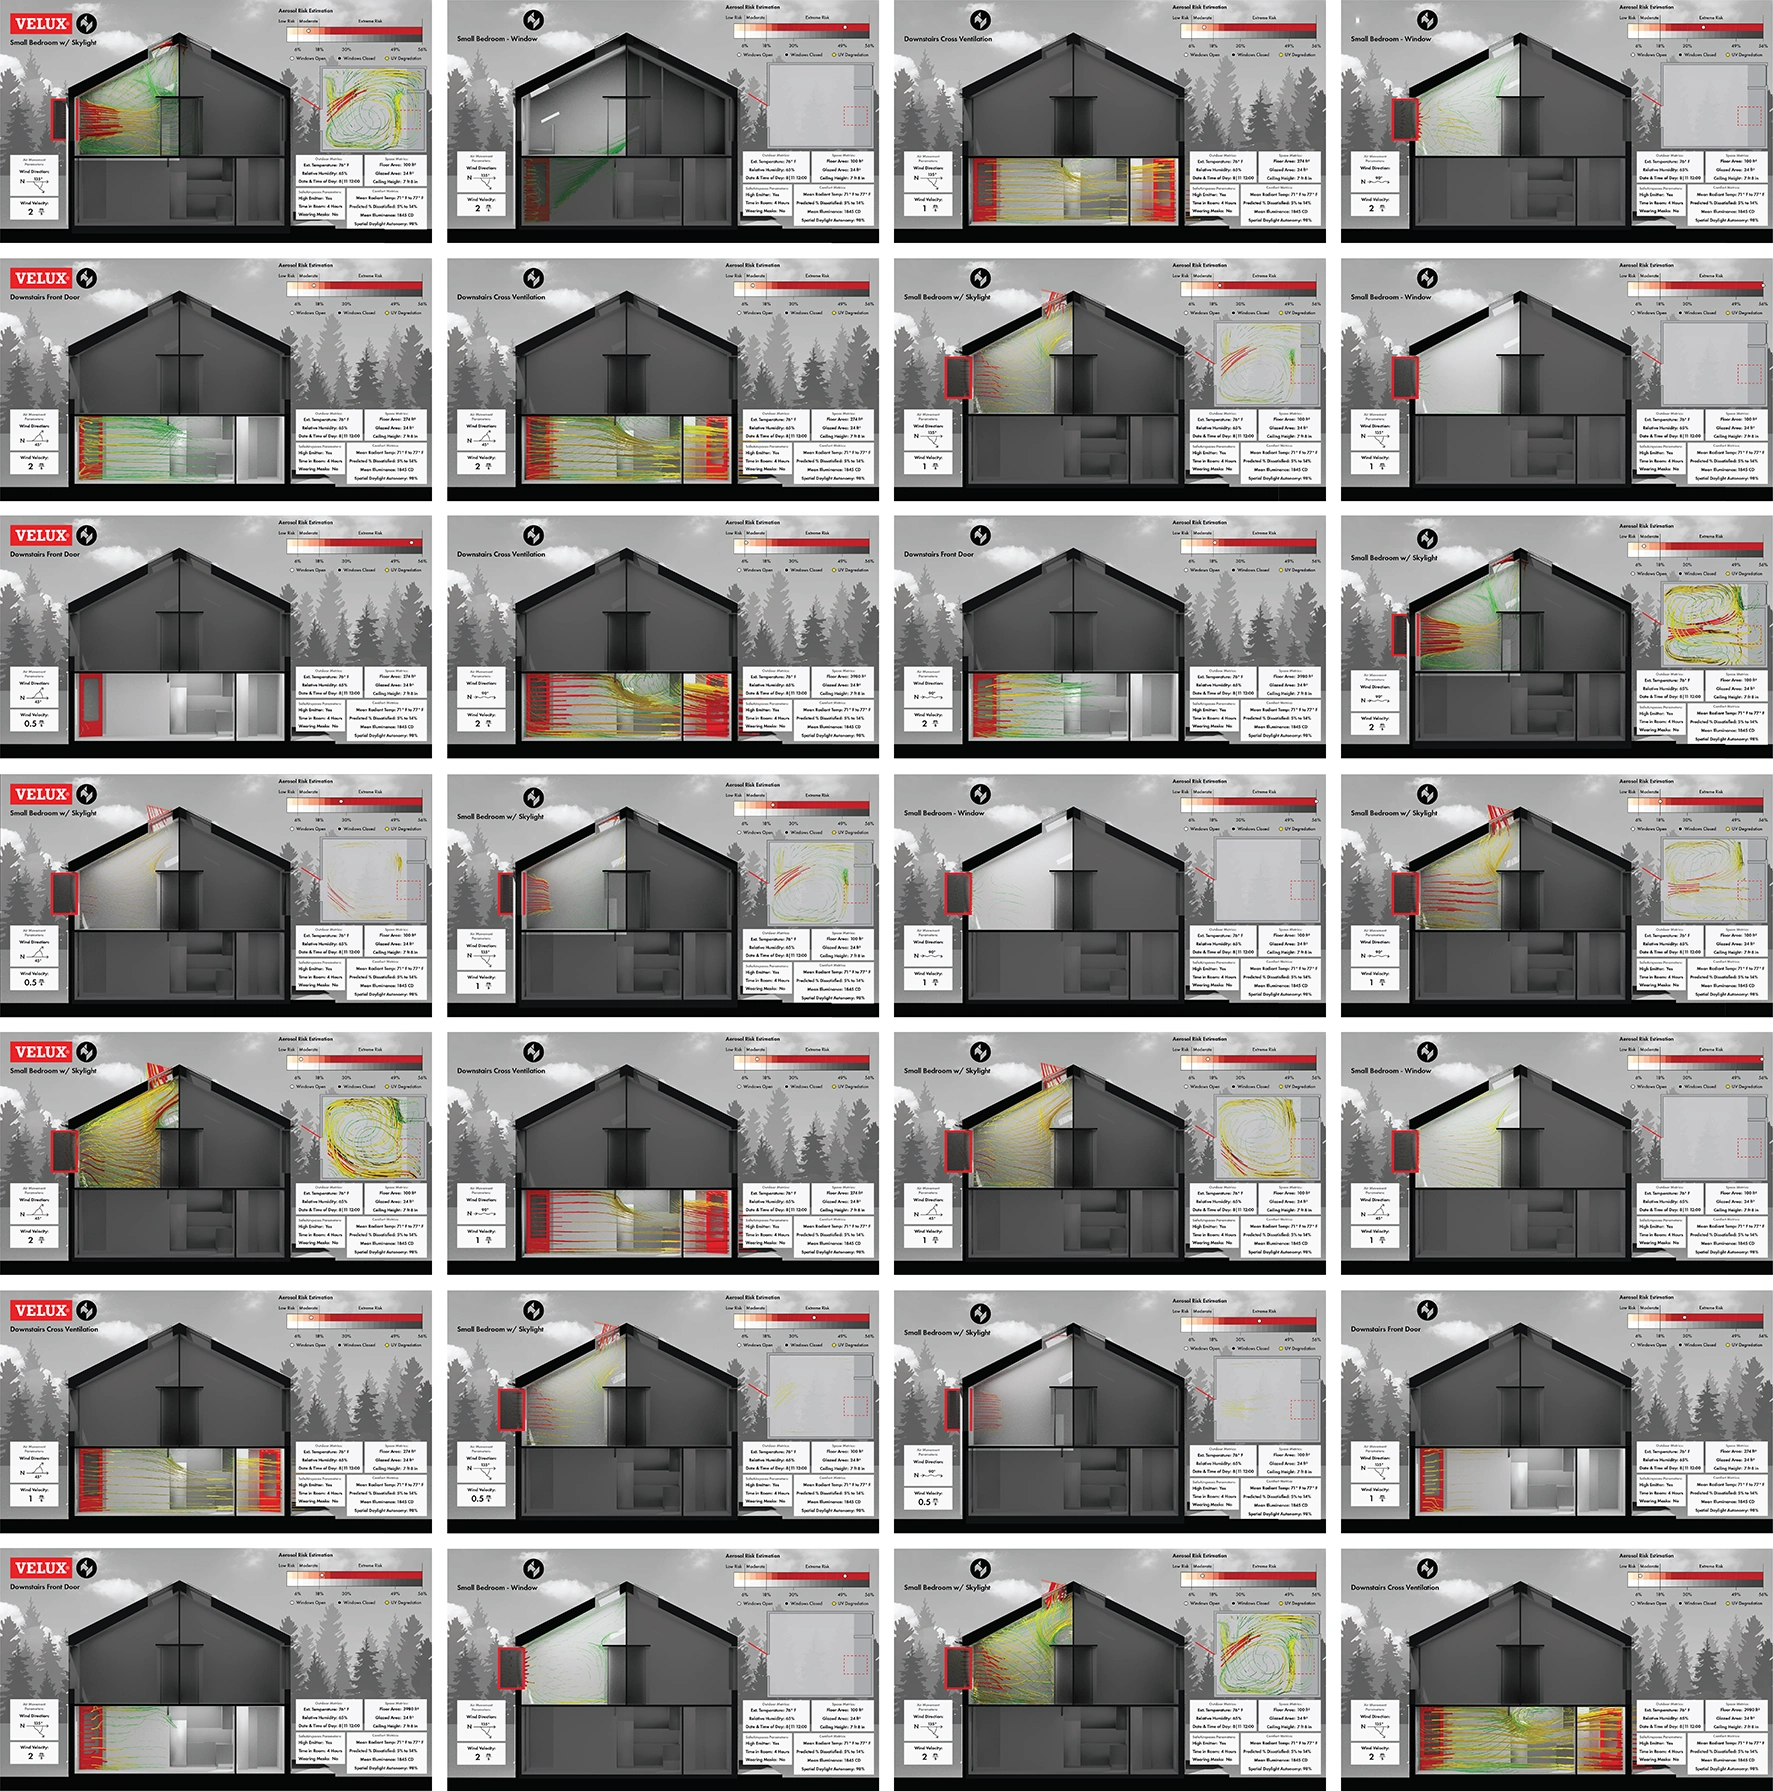
The following document details the development of 'Patterns for Health,' a parametric tool designed to translate complex building performance simulations into understandable visualizations for non-professionals. It outlines an automated pipeline that leverages industry-standard software (Rhino, Grasshopper, OpenFoam, OpenStudio, Blender) to generate static images and animated clips. These visuals intuitively display critical health and comfort metrics, including airflow, aerosol risk estimation, daylight autonomy, and thermal comfort, using a specific case study home as an example. The paper demonstrates how varying inputs like window openings, wind direction, and time of day impact these metrics and discusses future steps, including web-tool development and enhanced viral degradation visualizations.
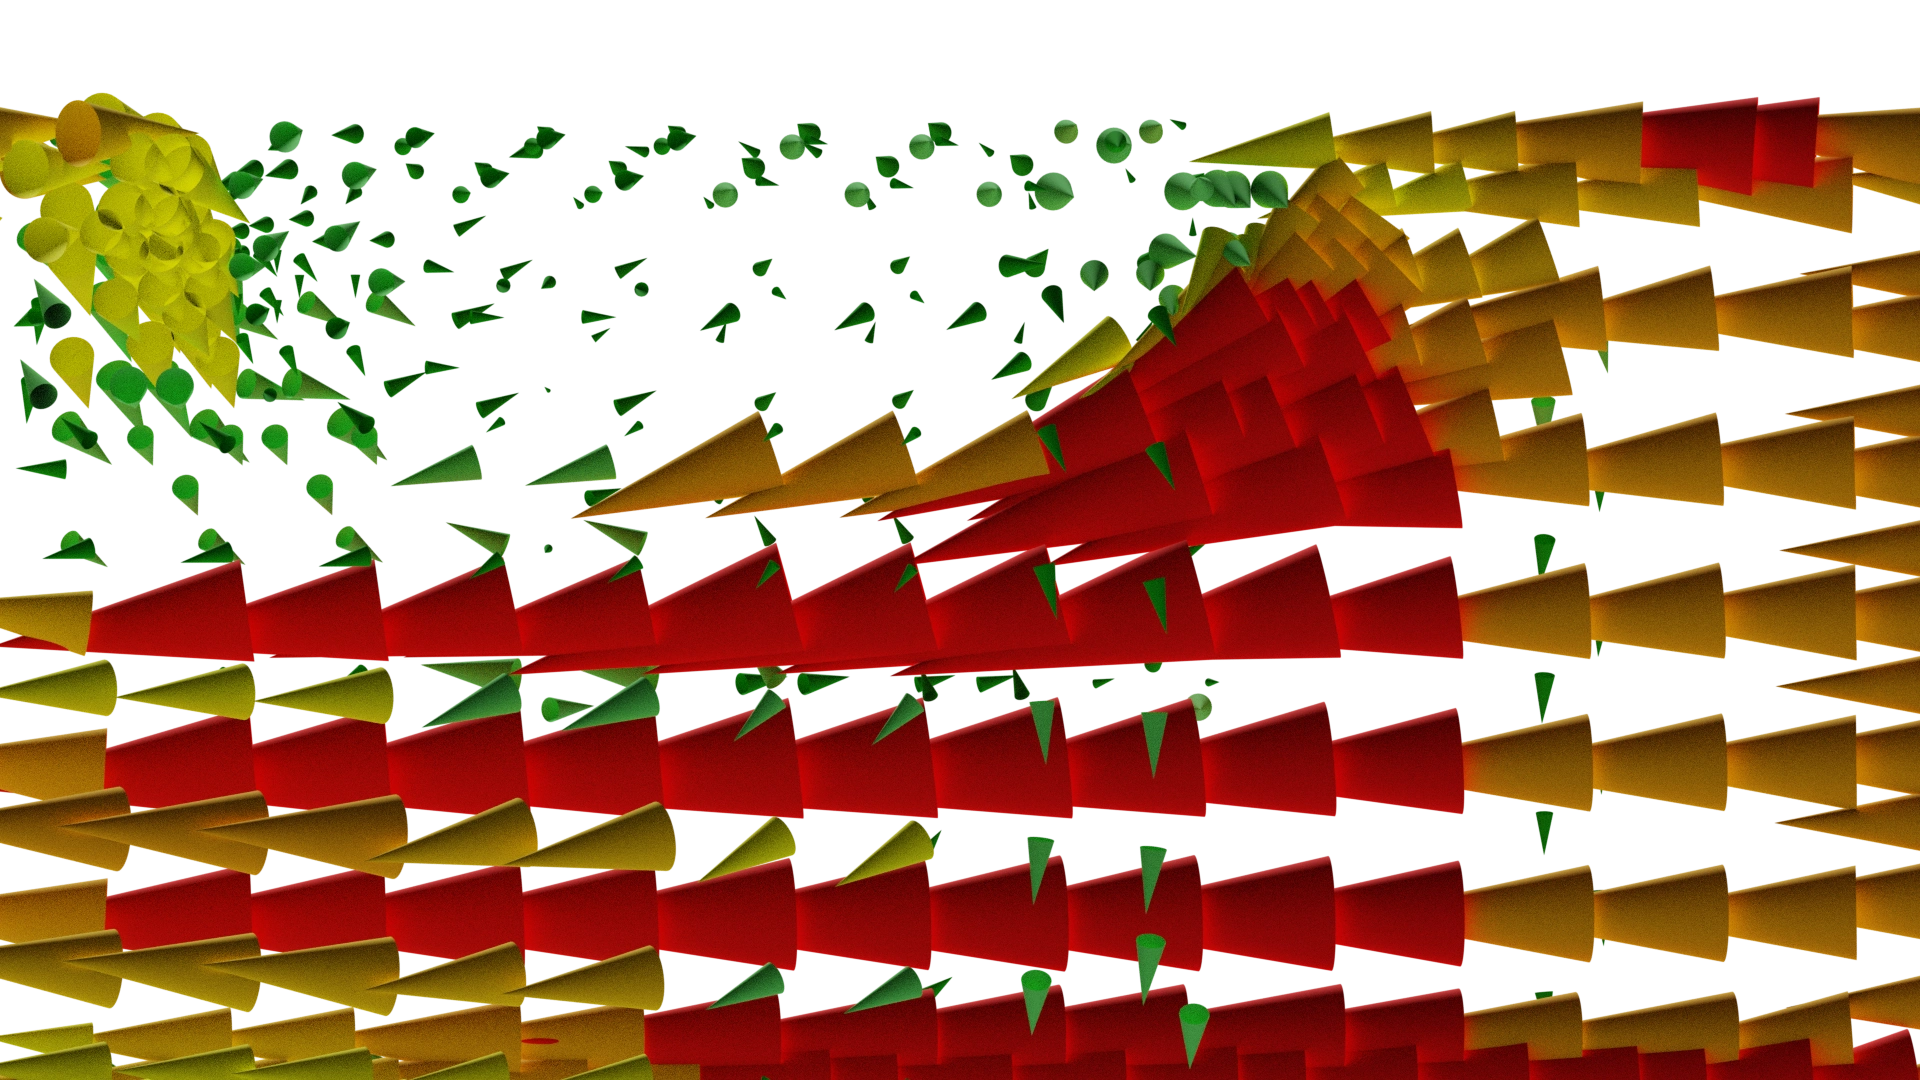
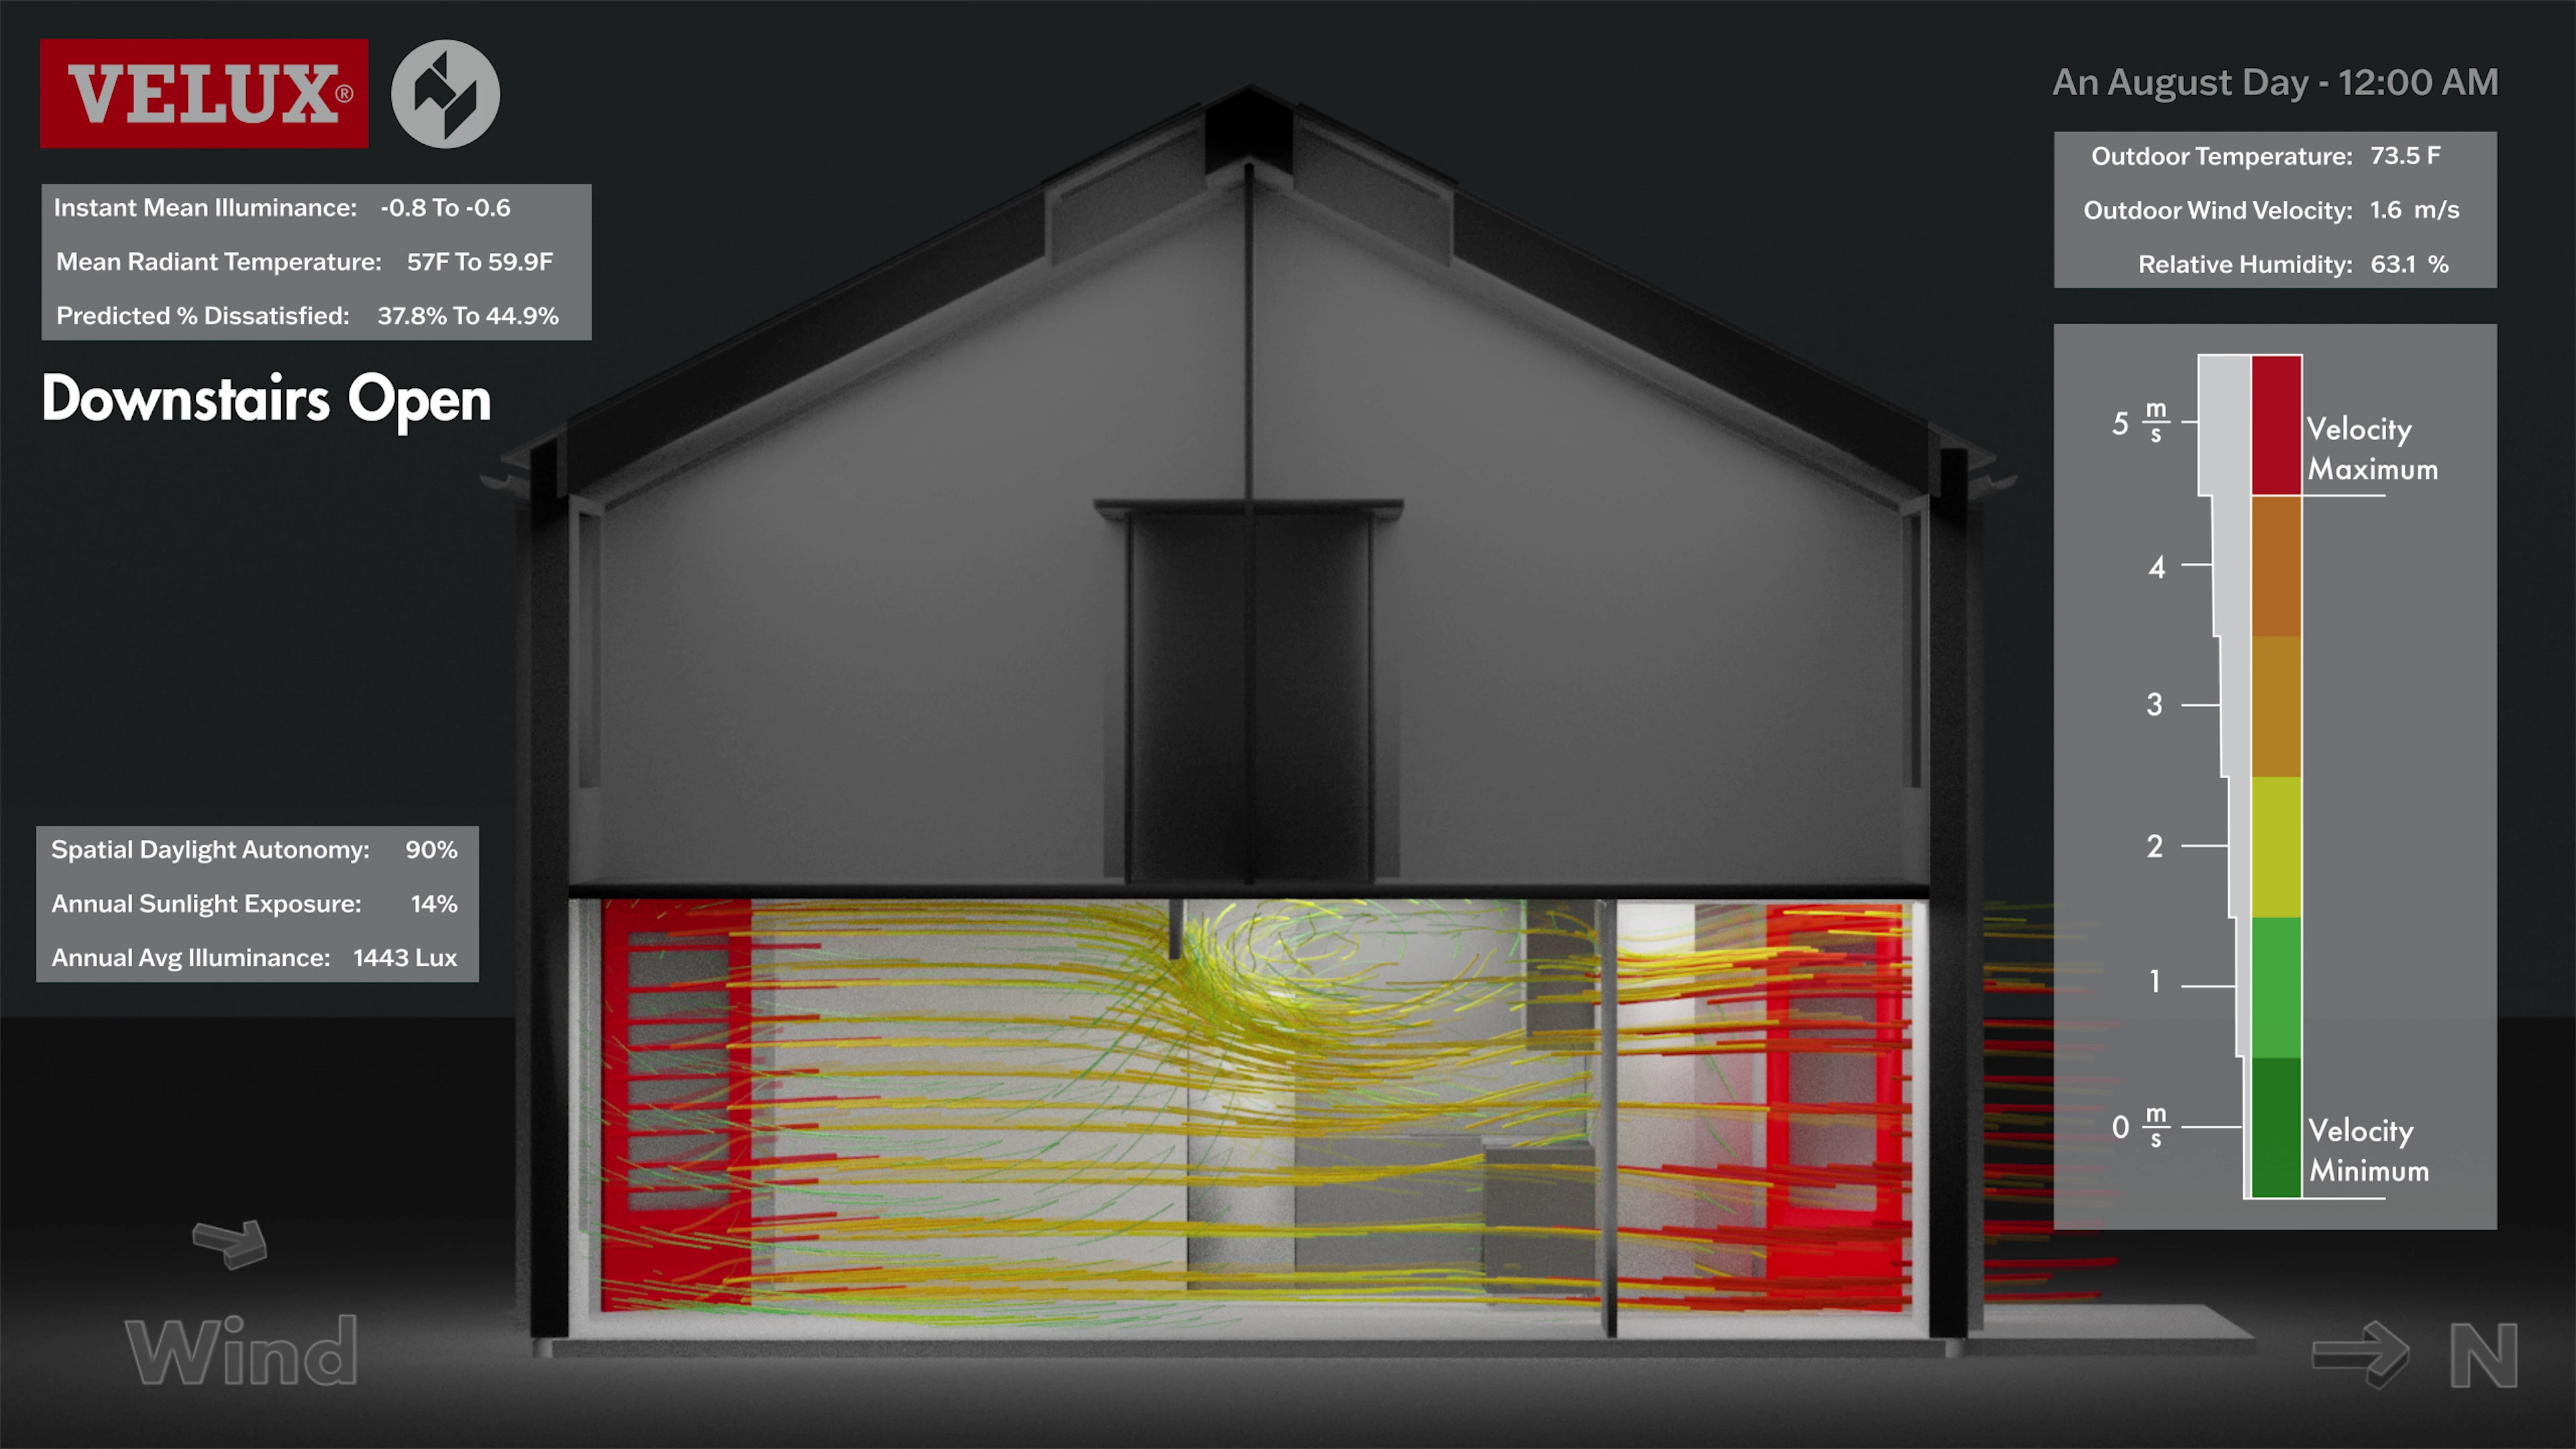
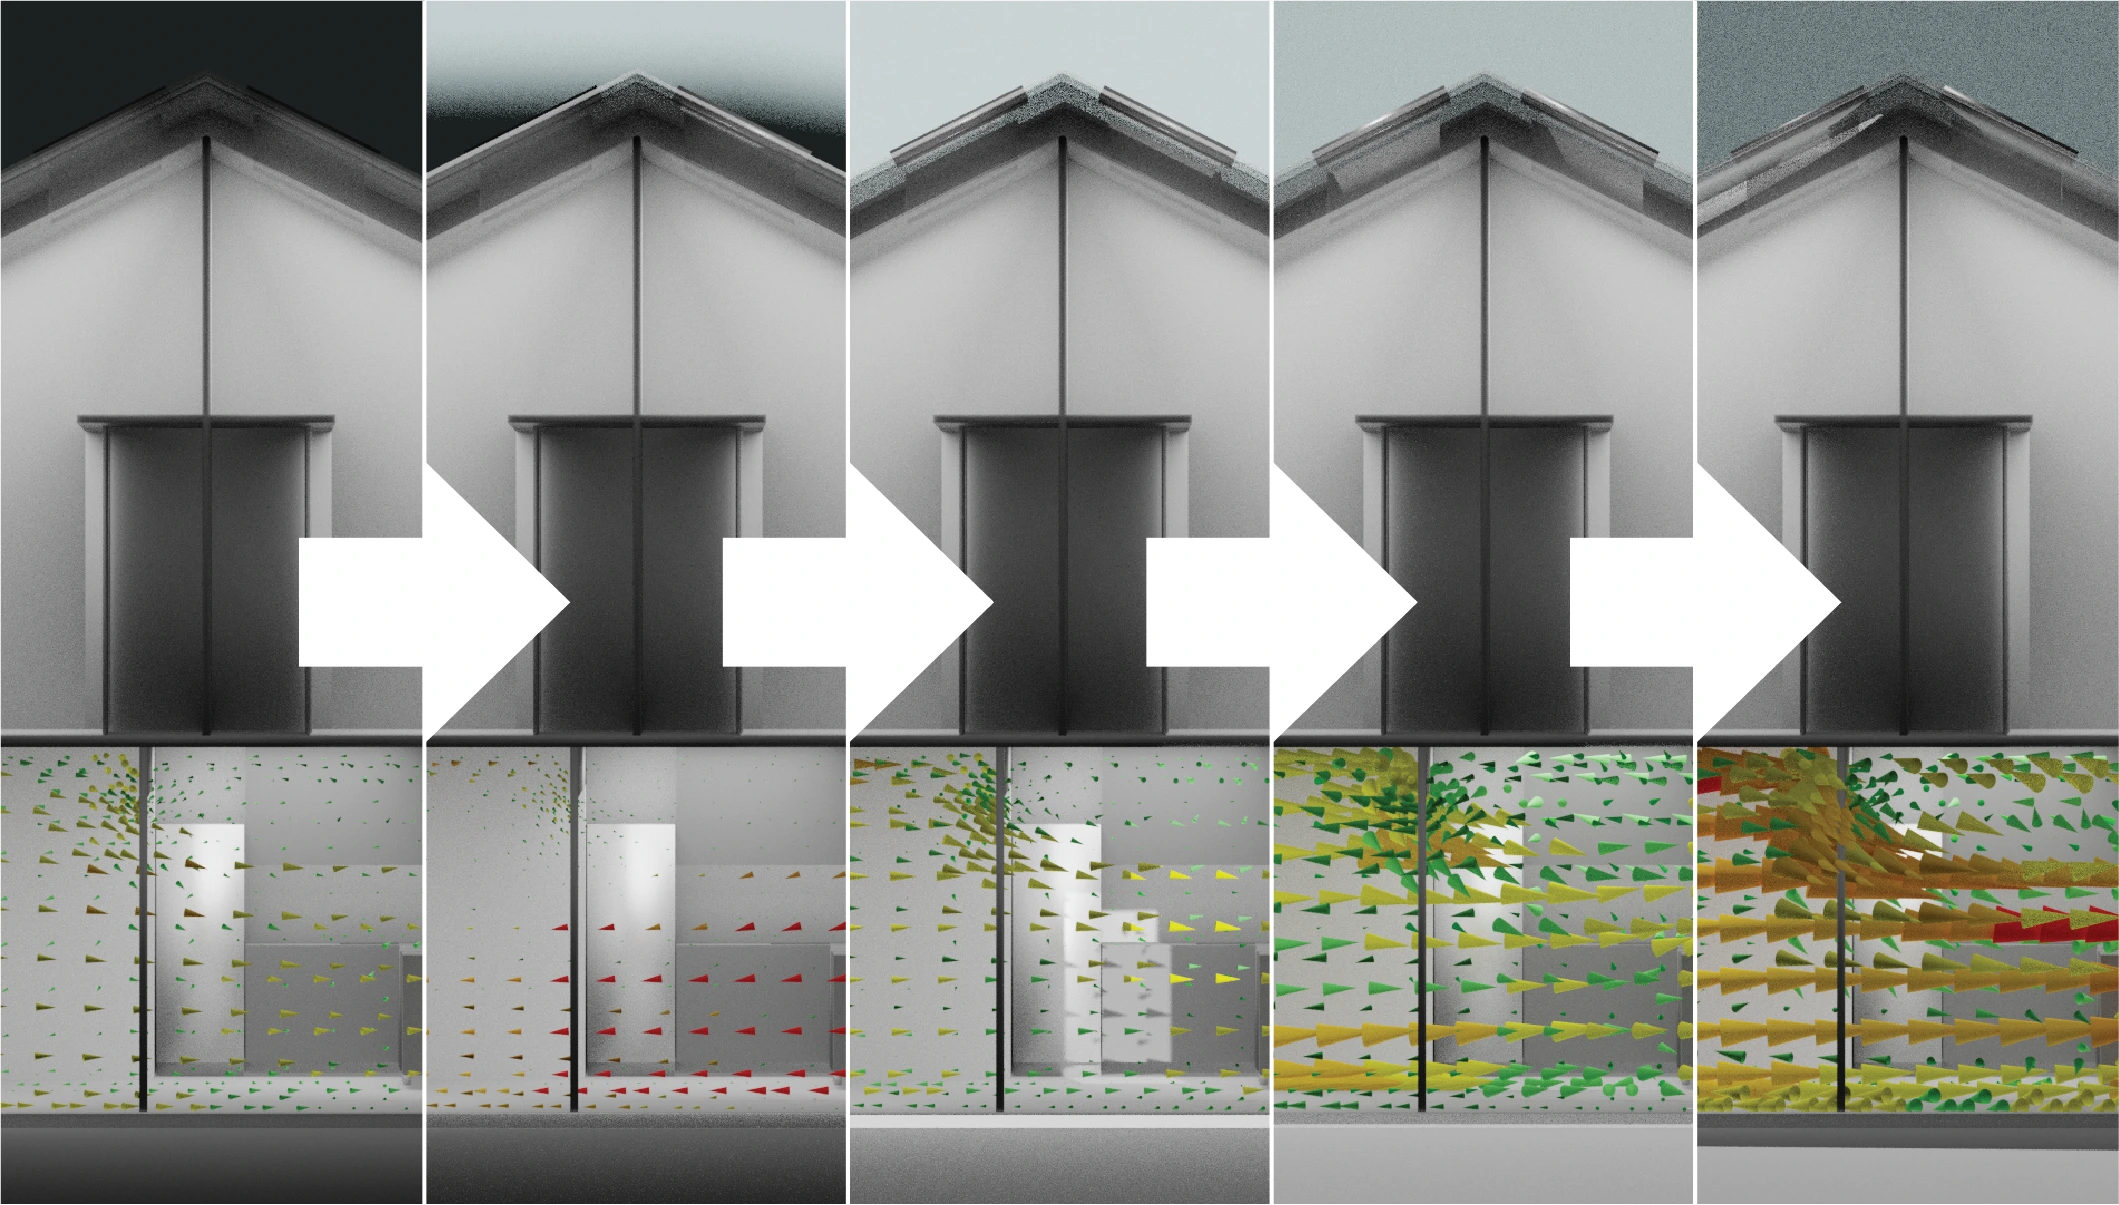
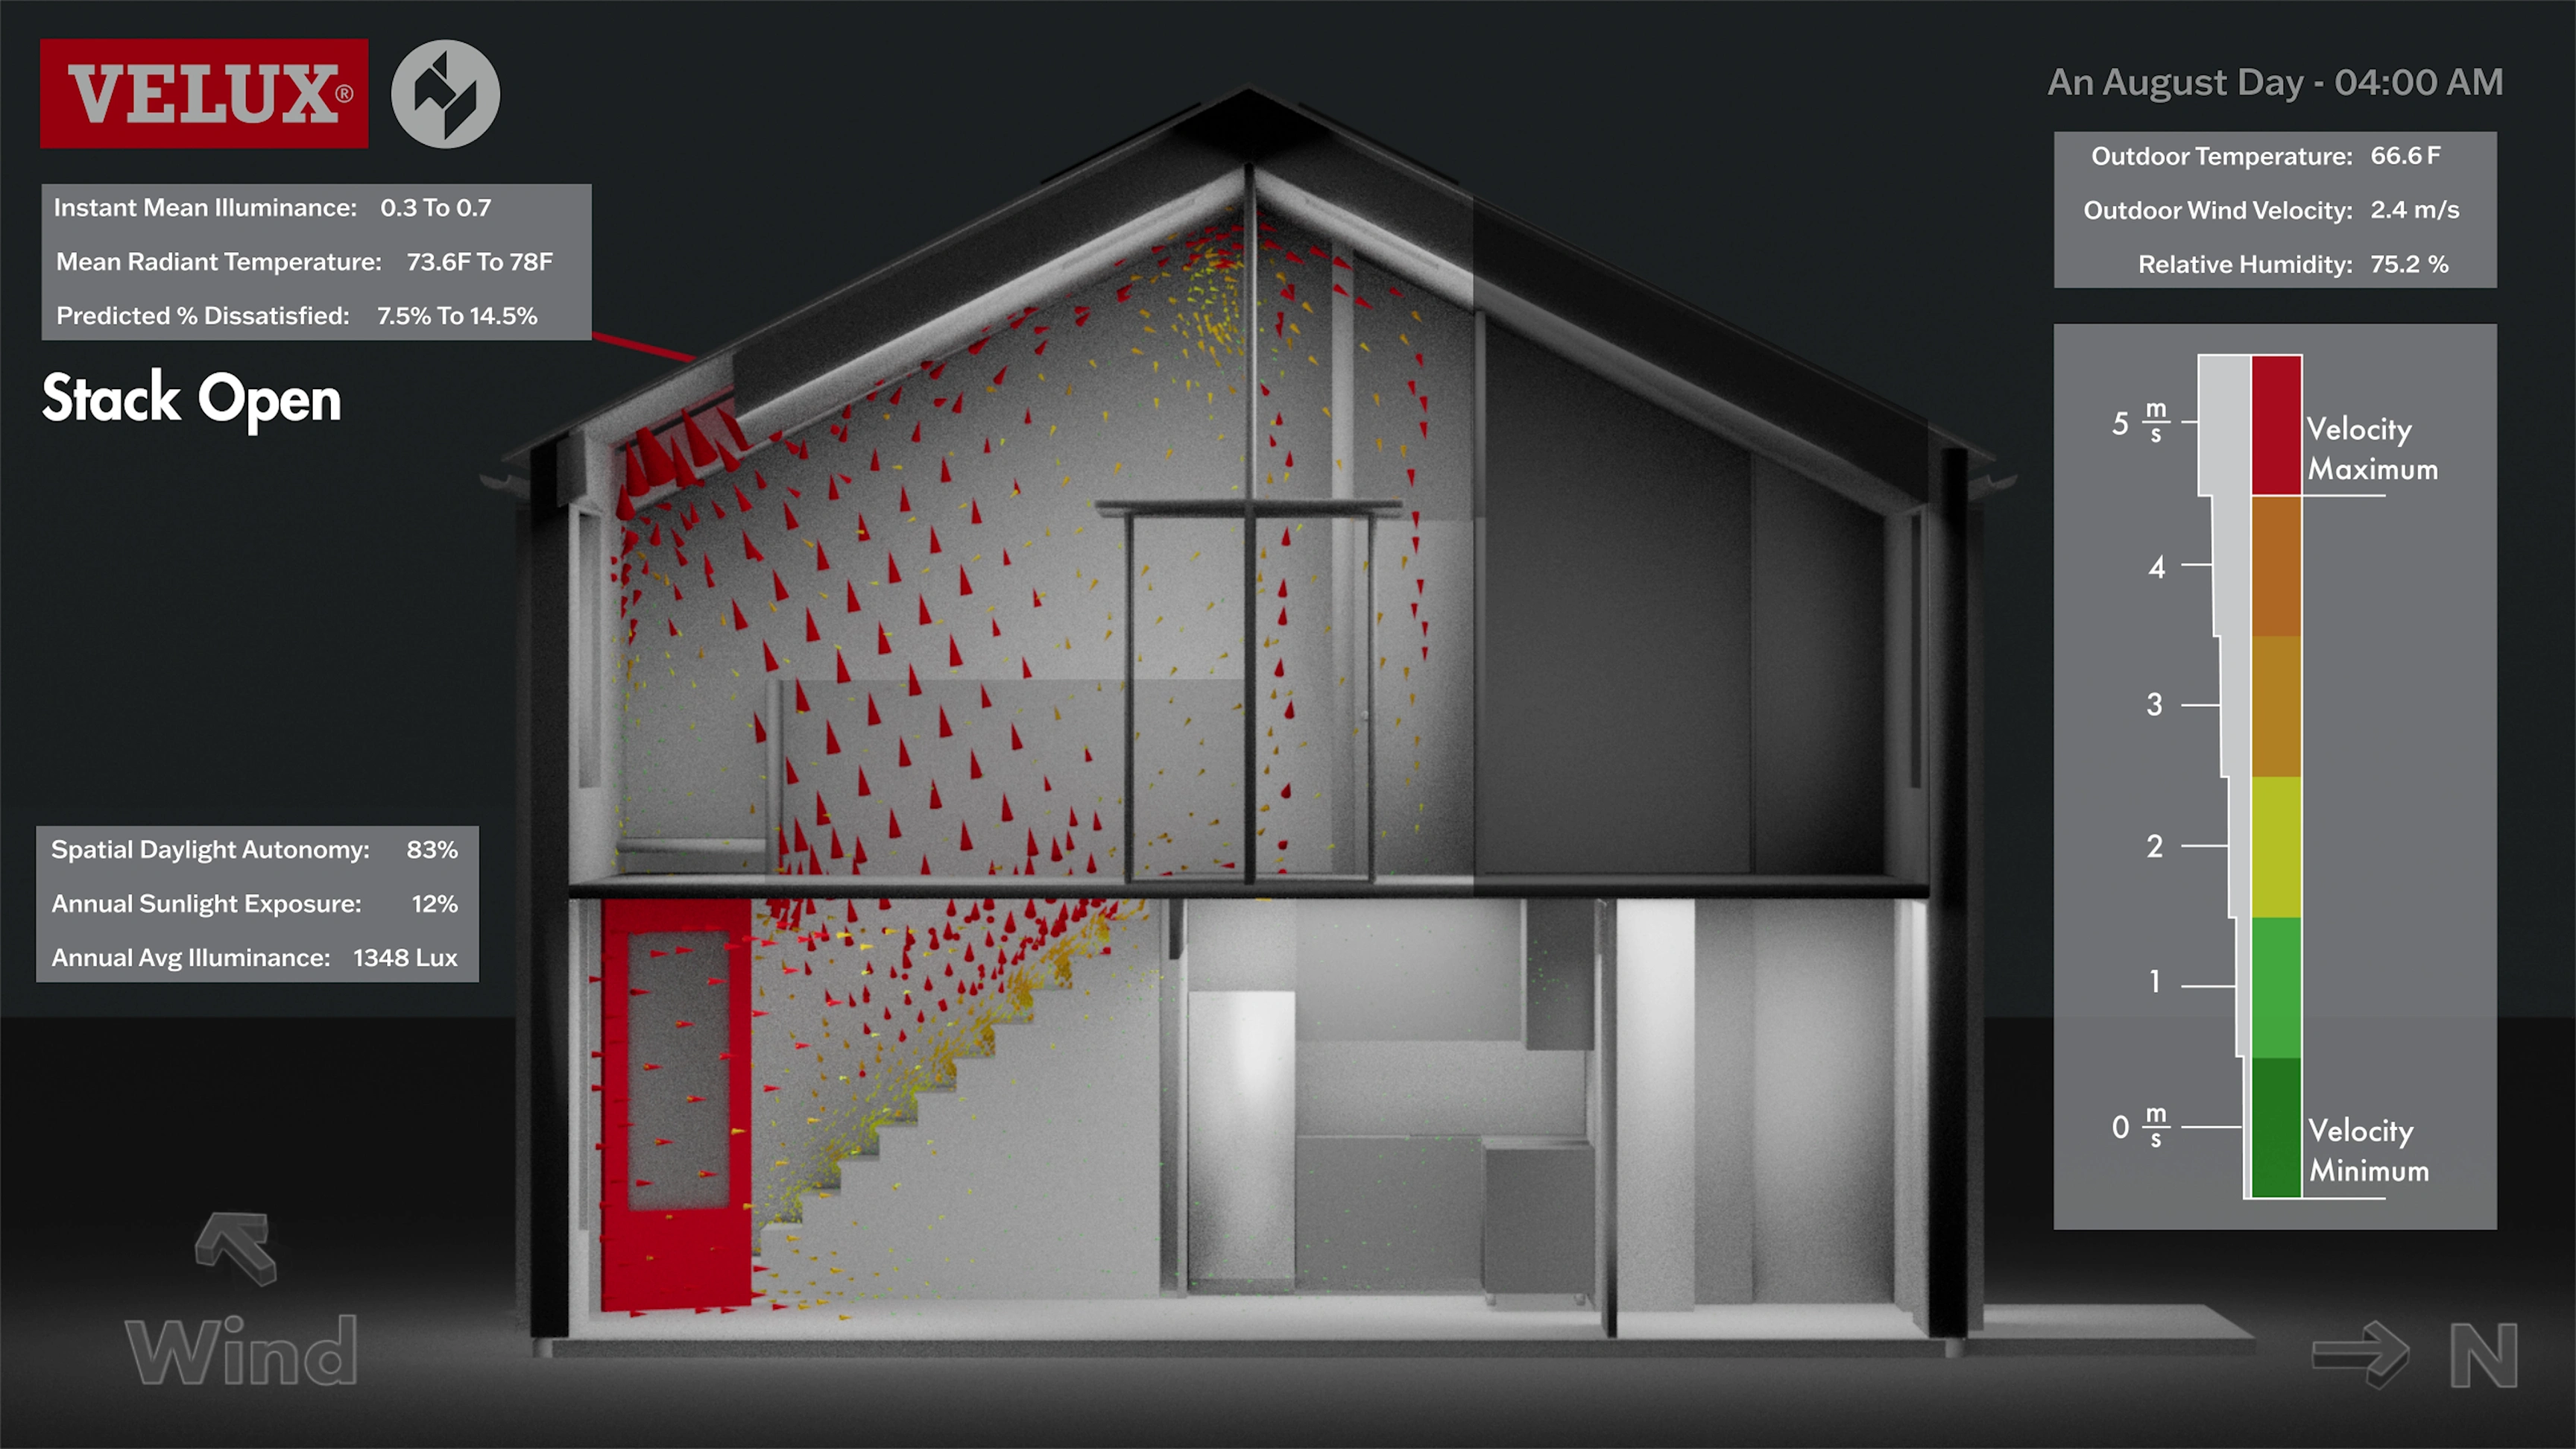
While numbers are always useful, they can often be difficult to fully understand without context. One of the main benefits of animating data is allowing the end user to see how aspects of a simulation change over time, and being able to provide instant feedback on how an individual action can completely change a situation. To best show the results of these simulations over time, I created a system to run CFD simulations at specific time-steps throughout a specific day and overlay the animation with other useful metrics. Instant mean illuminance, mean indoor radiant temperature, and outdoor metrics allow us to show how changes in the exterior realm can very quickly change the overall indoor climate.
Like this project
Posted Oct 6, 2025
Created 'Patterns for Health' to visualize cross-ventilation impacts on dwellings.
Likes
0
Views
2
Clients
VELUX