Geospatial Analysis of UK Traffic Accidents
Ciro
Case Study: Geospatial Analysis of Traffic Accidents in the UK
Overview
Conducted a large‑scale geospatial and temporal analysis of UK traffic accident data (2005–2017). Cleaned and transformed 1.91M records to identify high‑risk hotspots and peak accident times, producing outputs ready for Business Intelligence integration.
Challenge
Raw geospatial datasets are often noisy and difficult to interpret. The challenge was to clean millions of records, correct coordinates, and transform severity data into actionable insights for road safety planning.
Approach
Data Cleaning: Removed invalid records, corrected types, and filtered coordinates outside UK boundaries.
Transformation: Created Hour_of_Day variable and mapped accident severity into numeric categories.
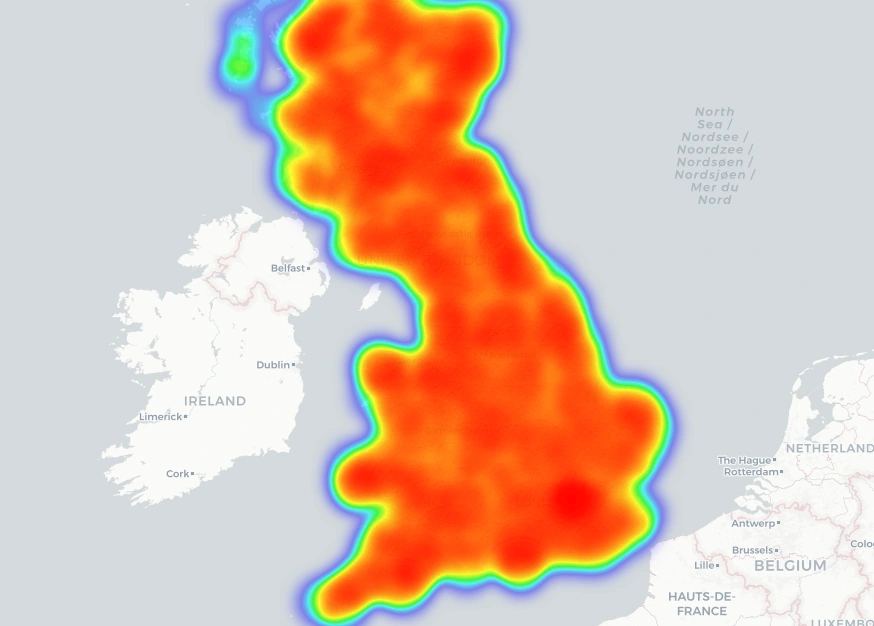
Visualization: Generated Folium heatmaps and Power BI dashboards to highlight geographic and temporal risk patterns.
BI Integration: Exported clean dataset for direct ingestion into Power BI.
Solution
Delivered a robust geospatial analysis pipeline that revealed:
Hotspots of severe/fatal accidents outside high‑traffic density zones.
Peak risk window between 3:00–6:00 PM, aligning with evening rush hour.
Clean, structured outputs for BI teams to integrate into safety planning dashboards.
Impact
Scale: Processed nearly 2M records with only 4.5% loss due to invalid data.
Actionable Insights: Identified critical accident hotspots and temporal risk patterns.
Business Value: Provided government and BI stakeholders with clear, validated visuals for resource allocation and policy decisions.
Like this project
Posted Jan 2, 2026
Conducted analysis of UK traffic accidents to identify high-risk hotspots and times.