Admin Dashboard for Financial Application
Jakub Popiolek
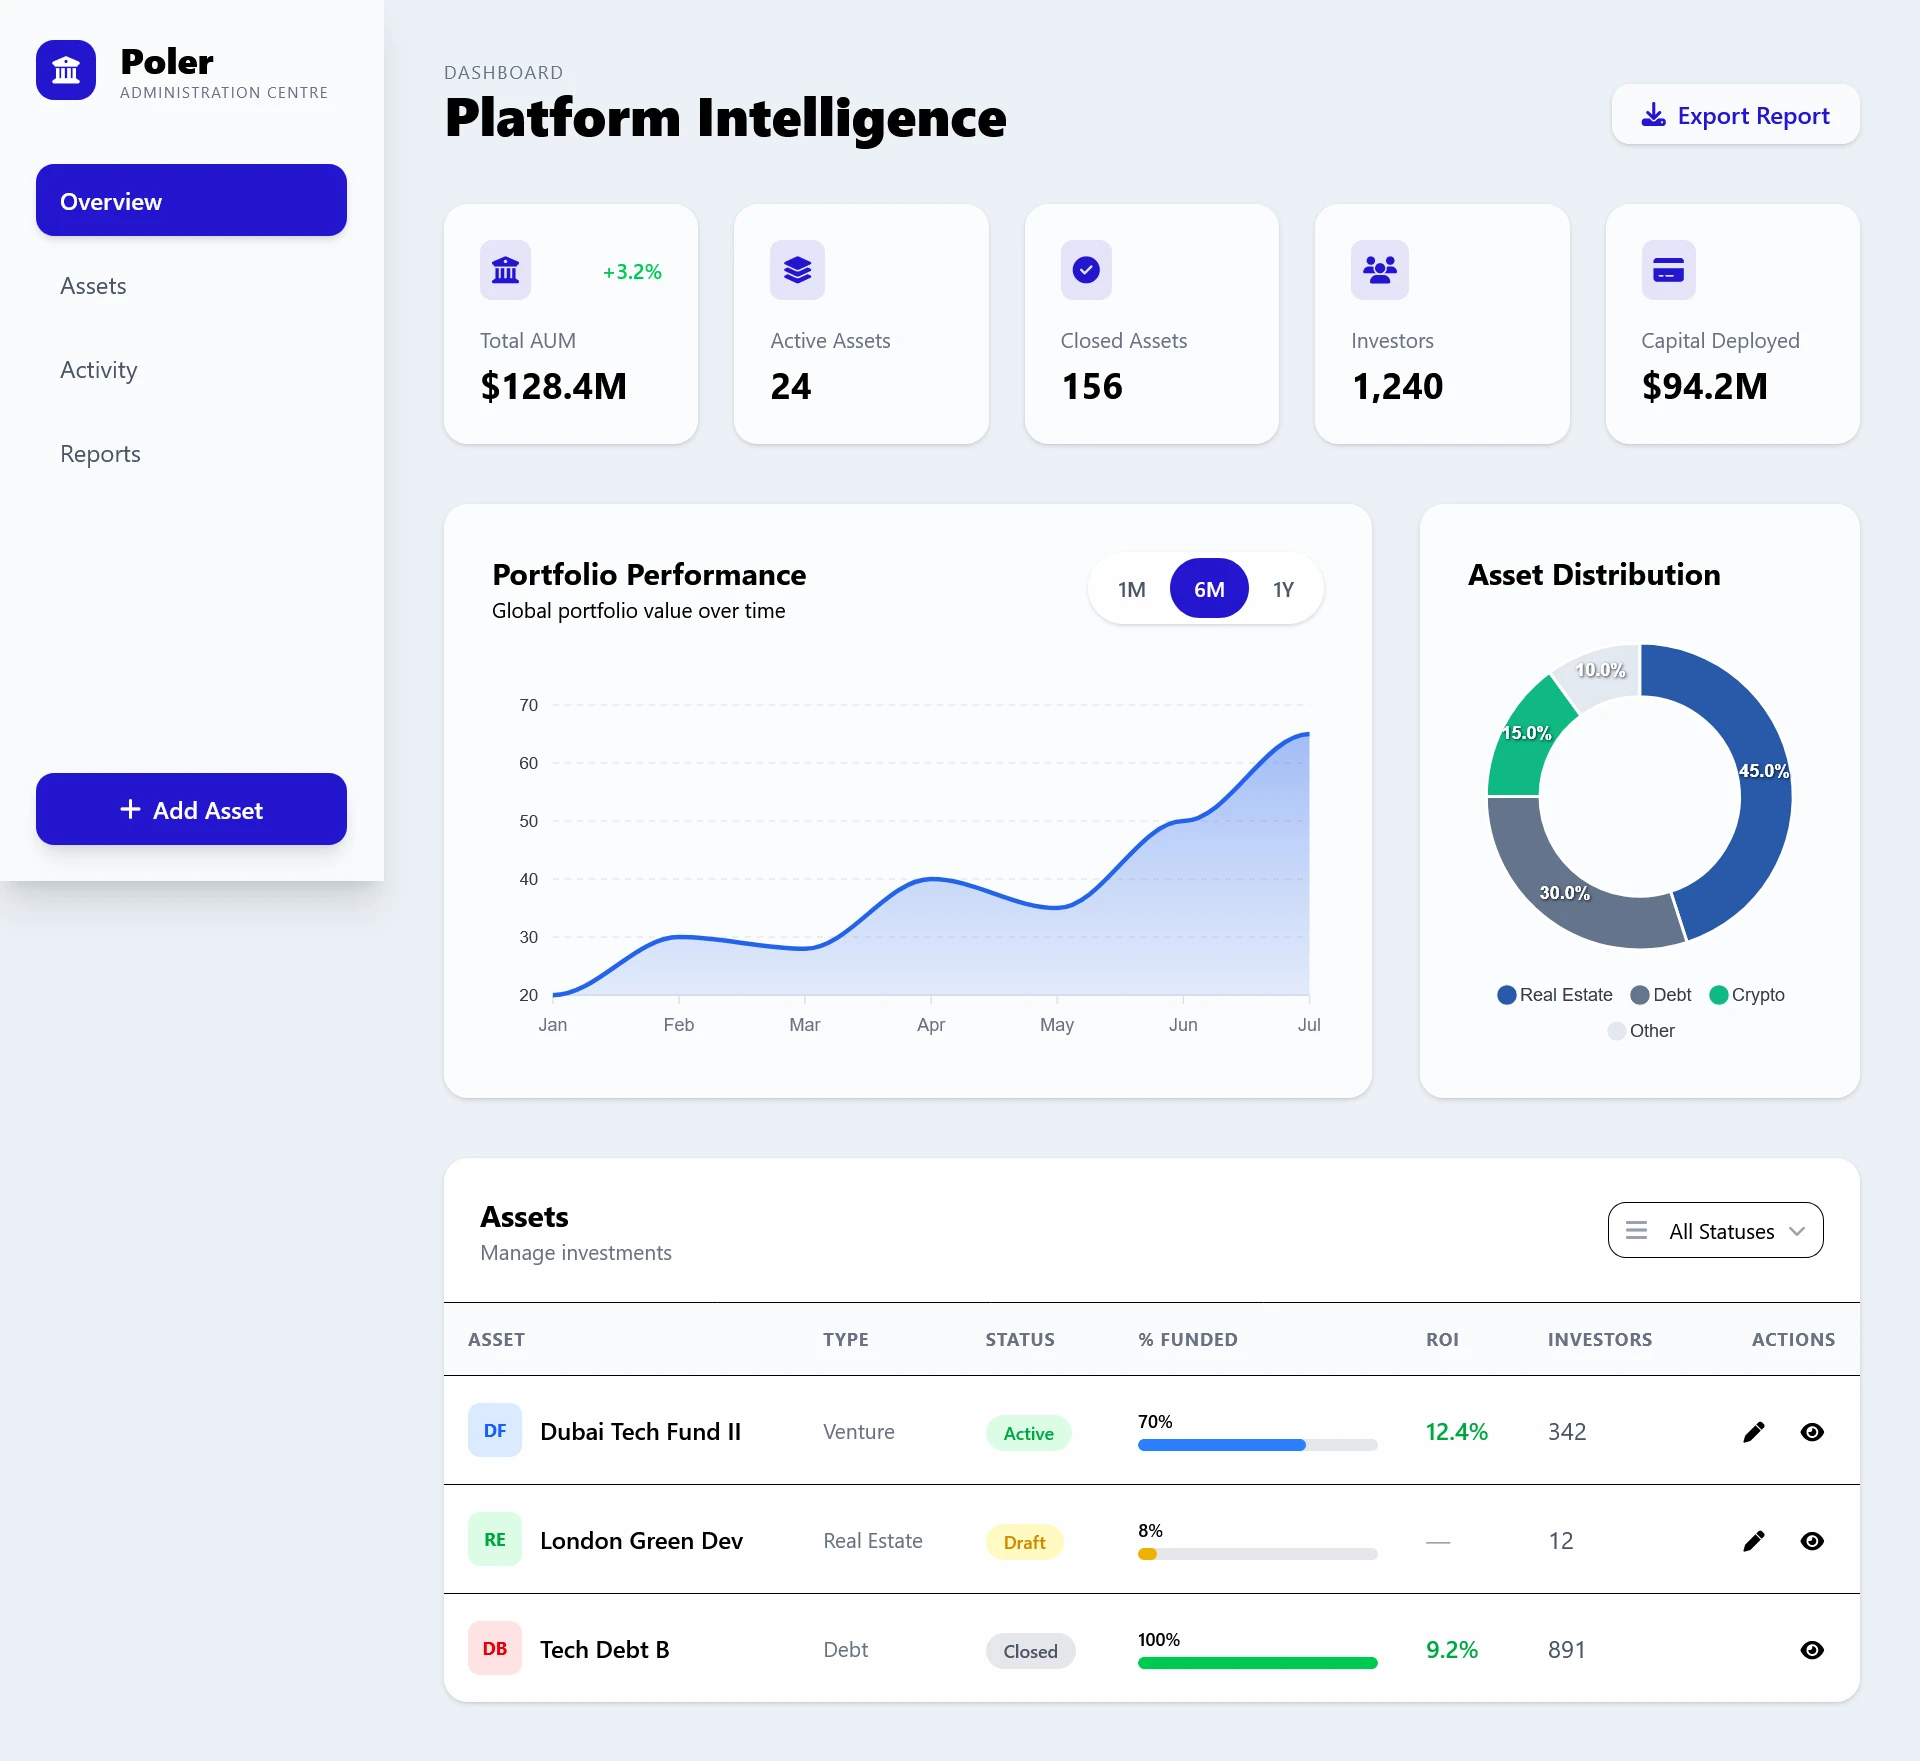
Admin Analytics Dashboard
I developed a secure admin dashboard for the Poler platform, designed to give administrators a clear overview of platform activity and performance. The dashboard provides analytics and reporting tools that help monitor growth, investment activity, and overall platform usage.
I built the frontend in Angular, turning provided designs into responsive, production-ready features with a clean and easy-to-understand user experience. The dashboard was designed primarily for desktop use and displays data through charts, graphs, and summary metrics, allowing admins to quickly understand how the platform is performing.
The dashboard includes analytics such as:
Total users on the platform
Investment activity over selected time periods
Number of assets available on the platform
General platform usage and growth metrics
CSV export functionality for reporting and analysis
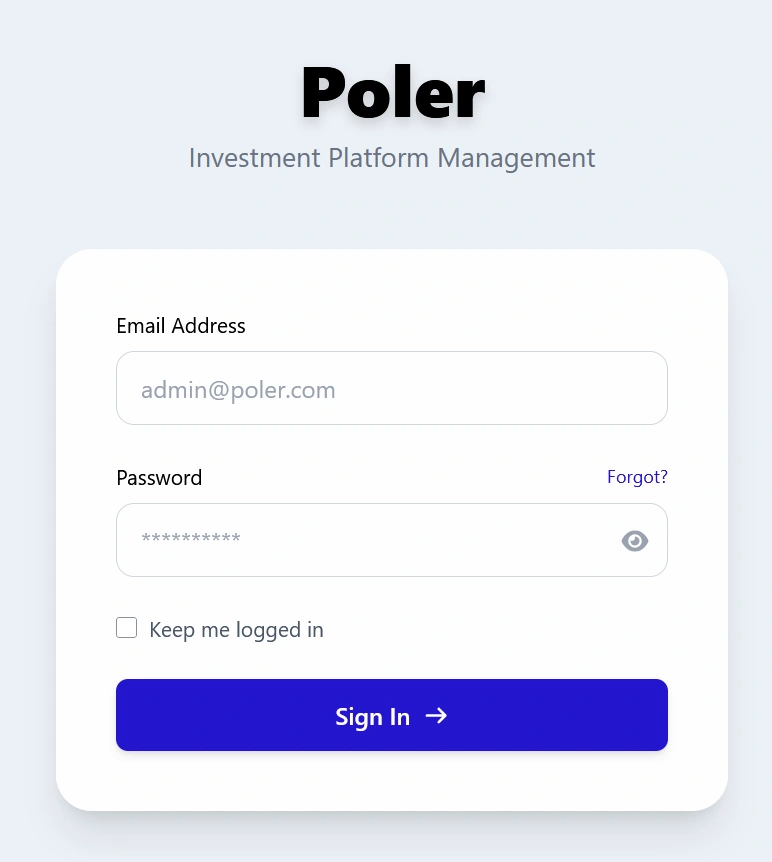
I connected the dashboard to secure backend APIs that provided platform analytics and reporting data. I also implemented role-based access controls and secure authentication to ensure sensitive information could only be accessed by authorised administrators.
I focused on keeping the frontend lightweight and maintainable by handling all data processing and calculations on the backend, allowing the dashboard to efficiently display large amounts of information without unnecessary complexity on the client side. I also implemented lazy loading for chart components to improve performance and reduce initial load times.
To keep the codebase scalable and maintainable, I built reusable UI and chart components that could be shared across different sections of the dashboard.
Key Contributions
Developed a secure admin analytics dashboard for the Poler platform
Built the frontend in Angular with a desktop-focused, production-ready user interface
Turned provided designs into fully functional dashboard features
Implemented secure authentication and role-based access control for admin users
Integrated charts and visual analytics for monitoring platform performance
Connected the dashboard to backend APIs for real-time platform data
Added CSV export functionality for analytics and reporting
Built reusable UI and chart components for maintainability and scalability
Implemented lazy loading for charts to improve frontend performance
Displayed investment activity, user growth, and asset analytics through interactive graphs and metrics
Built the frontend using Angular, Tailwind CSS, ApexCharts, and Material Icons
Worked within an existing backend architecture to extend platform tooling and administration features
Like this project
Posted Apr 3, 2026
Built a scalable Angular dashboard for managing financial data, with dynamic forms, reporting tools, and real-time insights via API integration.