
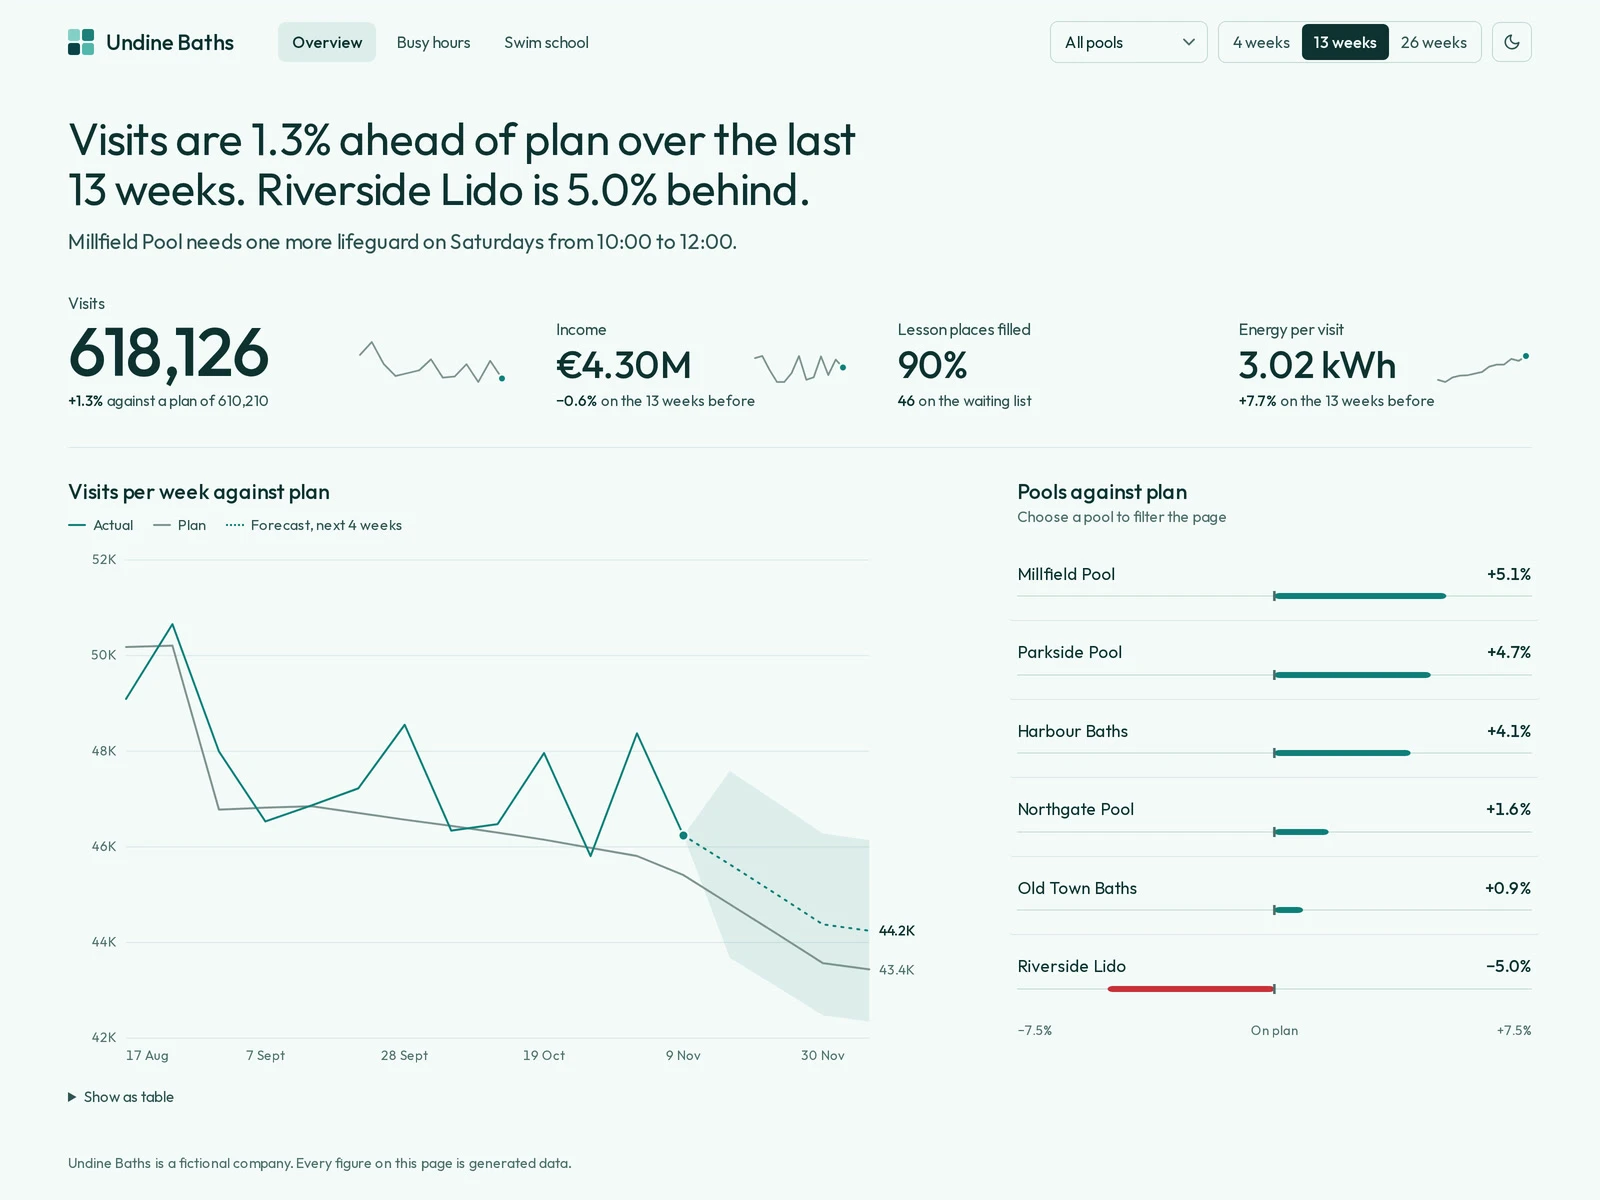
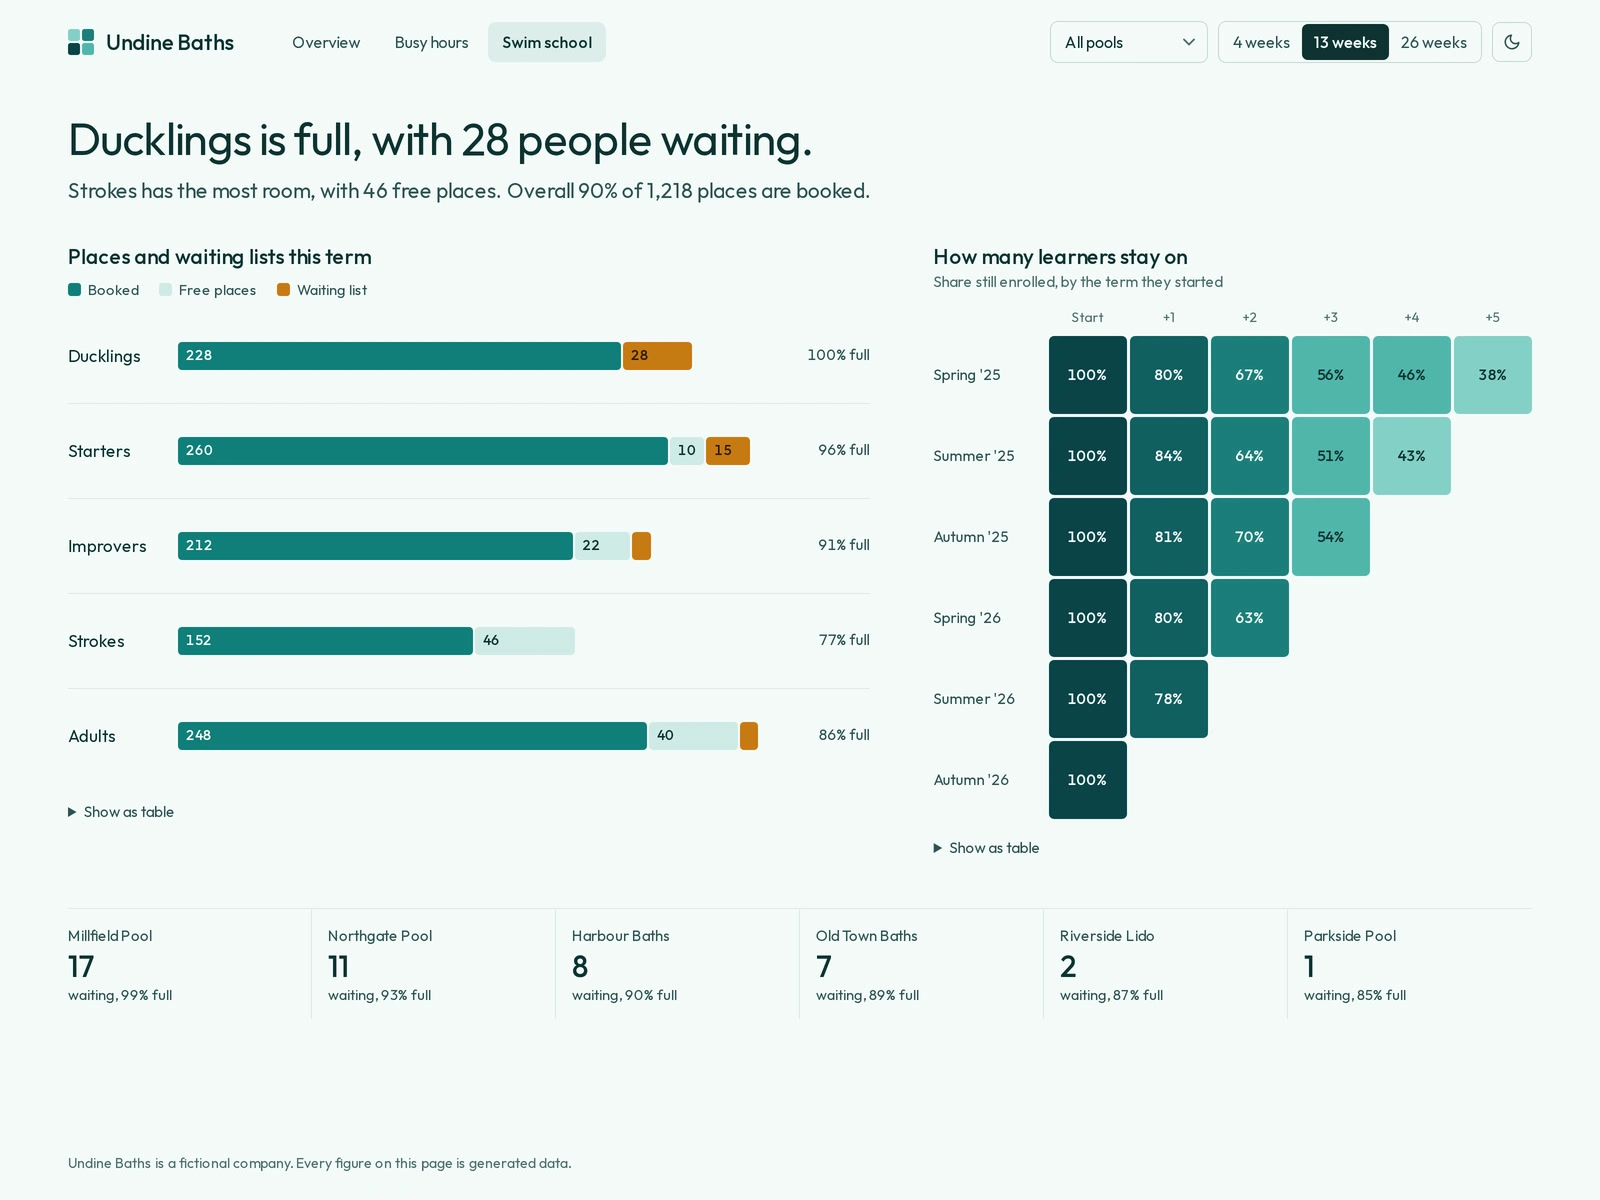
A working dashboard for a fictional group of six public pools. I built it from scratch on invented data, because real reporting stays private. It answers what a manager asks on a Monday: are we on plan, when is the water too full, and who needs another lifeguard.
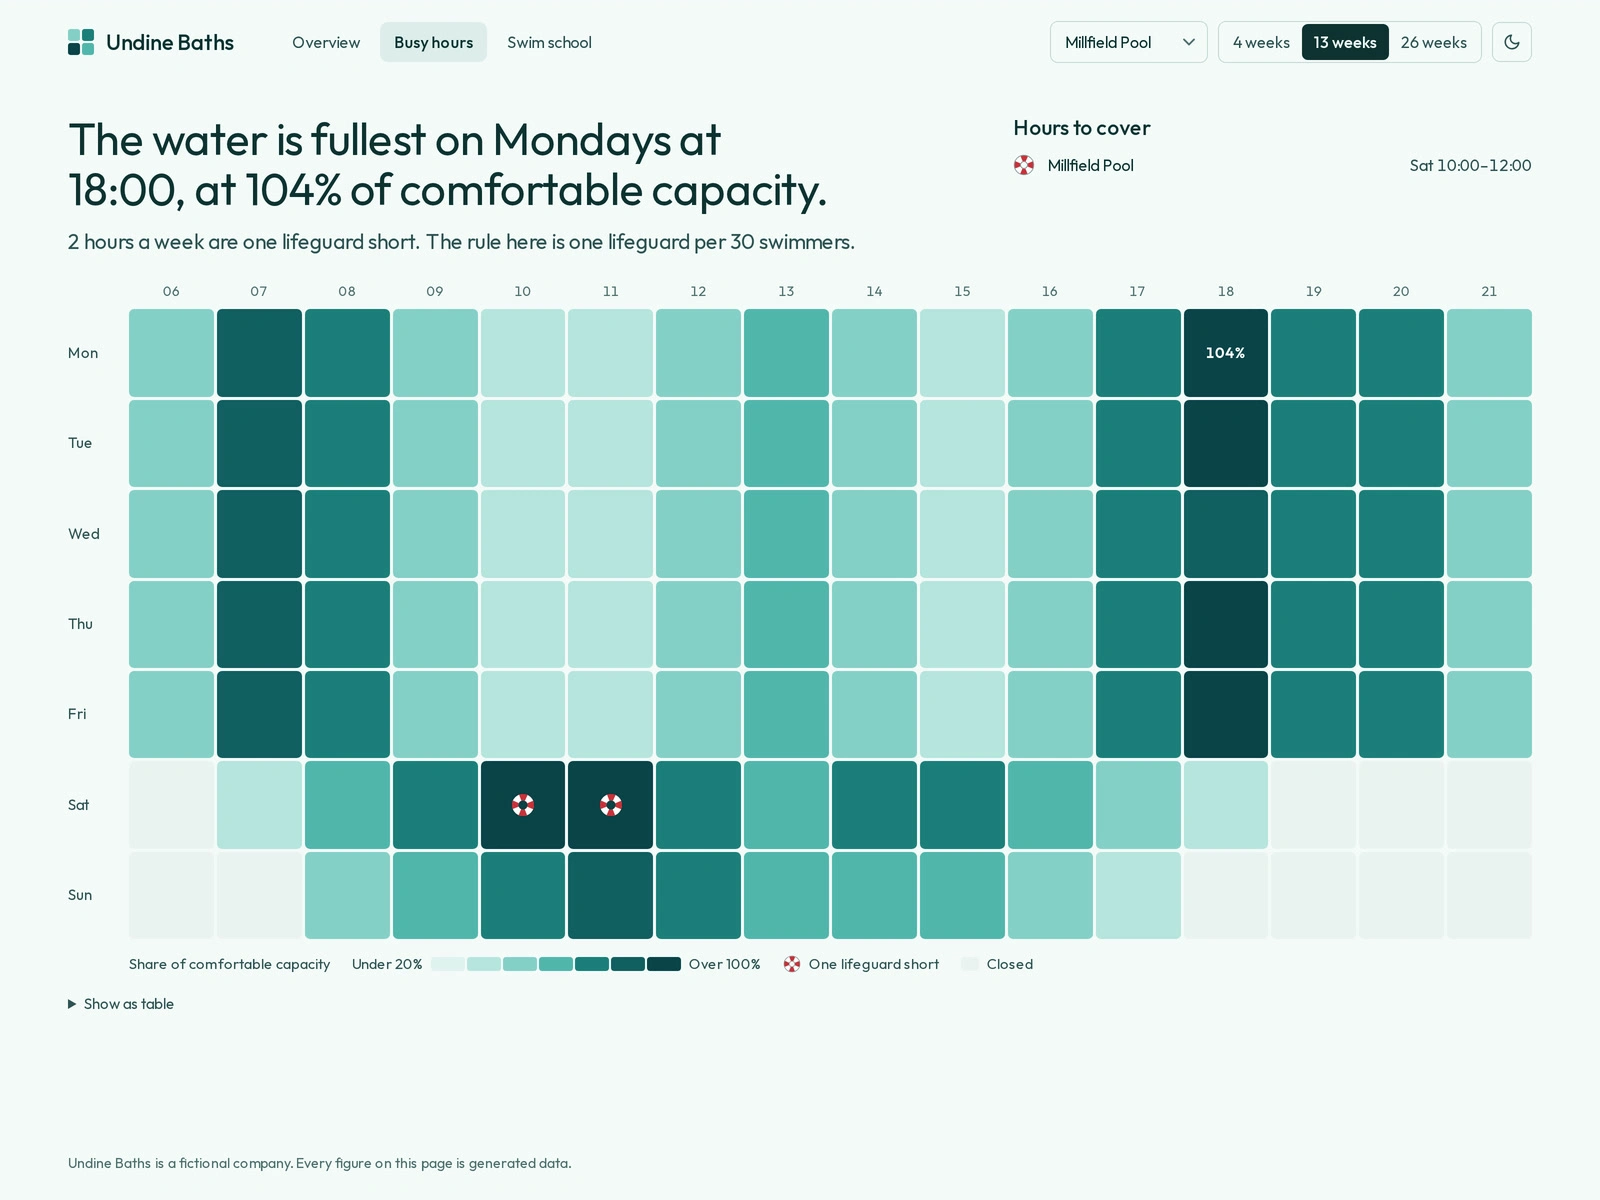
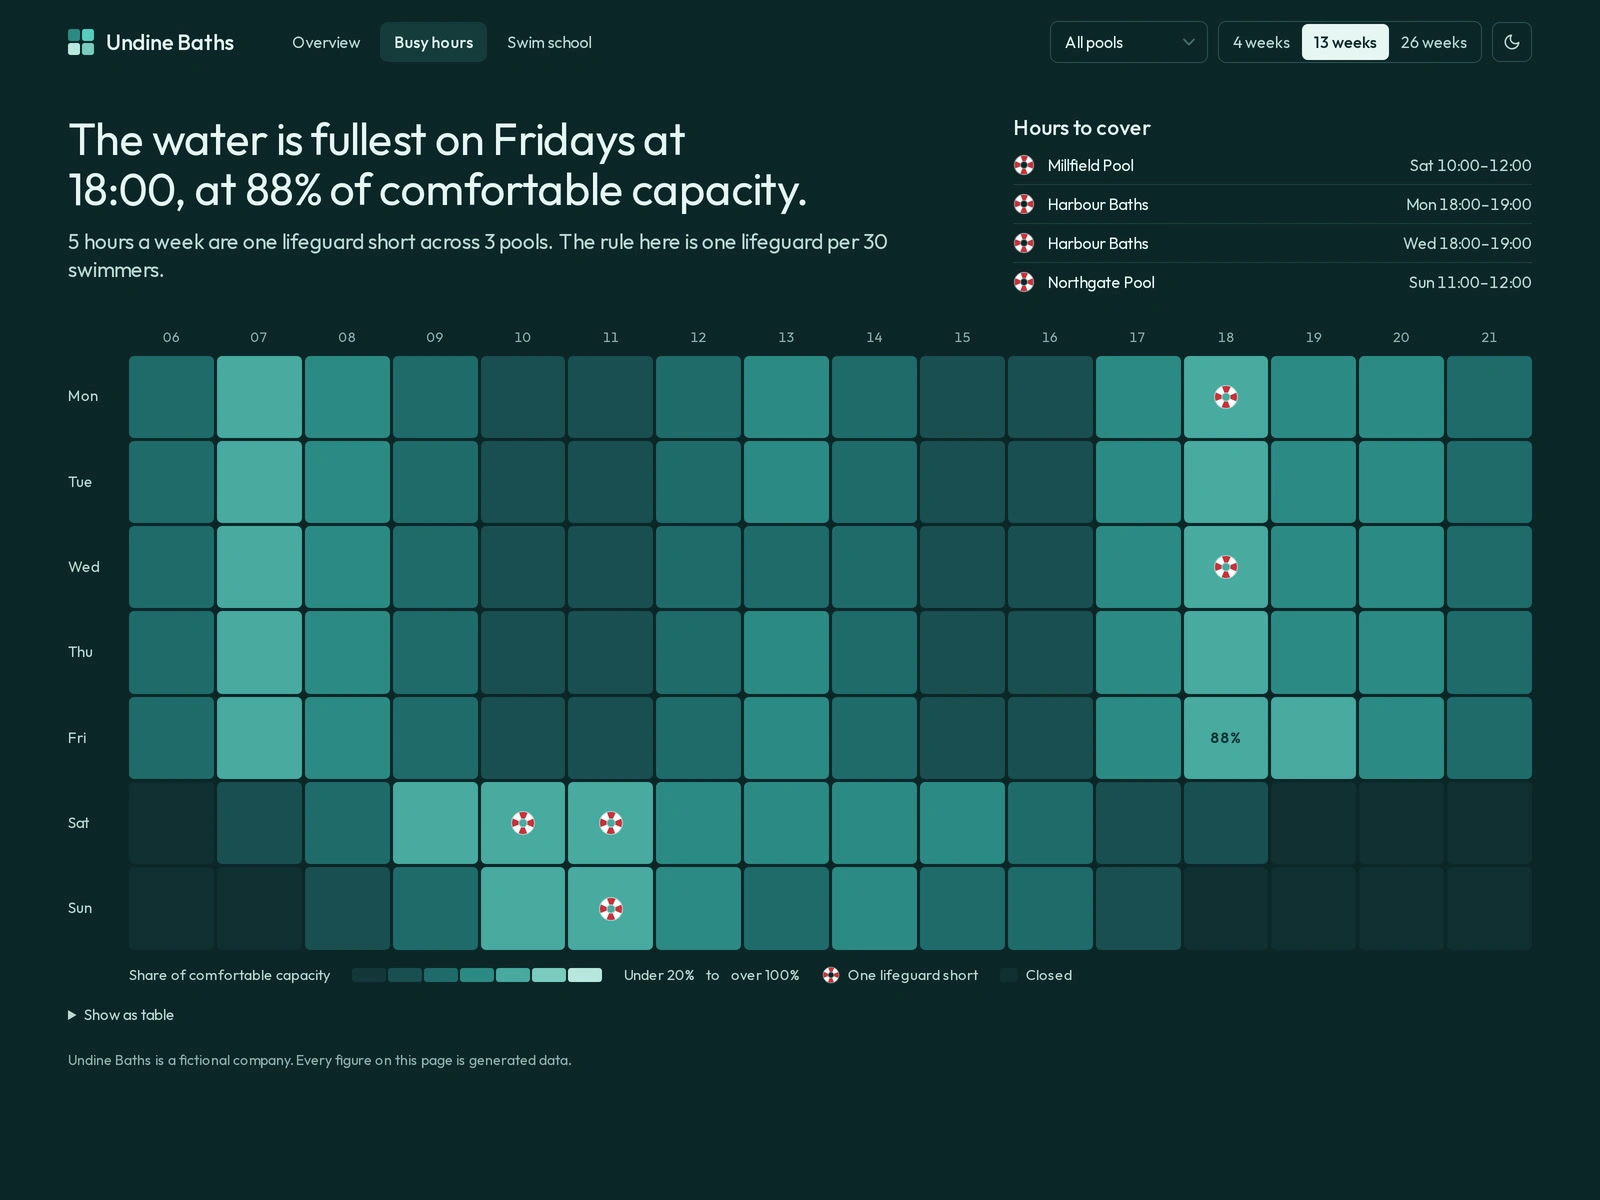
It opens with one sentence written from the data, naming the pool that is behind plan and the hours that need cover. The busy-hours page lays the week out as pool tiles, darker when fuller, with a lifebuoy on every hour that is short of a lifeguard.
Every number is computed from the raw hourly rows. A separate test recomputes them in Python and compares them with the real page for all 7 pool choices and 3 periods: 3,515 checks, none failed.
The company and its data are invented and the forecast is deliberately simple. It runs in any browser, with no dependencies, and you can try it through the link on this page.
0 likes · 0 views · Nov 21, 2026
Working dashboard for a fictional pool group: one sentence on what matters, the week as pool tiles, every number proven by 3,515 checks.

