Flask WebApp Deployment with CI/CD and Monitoring
Mani Karthik Gurram
Complete Guide: Flask WebApp with GitHub Actions, Docker, Azure Deployment & Monitoring
This repository contains a Flask-based web application with CI/CD pipeline configured through GitHub Actions, Docker, and deployment to Azure VM with prometheus, grafana monitoring
Getting Started
Clone the Repository
CI/CD Configuration
Secrets to Add in GitHub Repository
Go to your GitHub repo → Settings → Secrets and Variables → Actions and add:
Name Description DOCKER_USERNAME Your Docker Hub username DOCKER_PASSWORD Your Docker Hub password or token VM_HOST Public IP of your Azure VM VM_USER SSH username (usually azureuser) VM_KEY Your private SSH key
Note: Update VM_USER, VM_HOST, VM password accordingly
Note: Make sure - the content of public key matches with authorized-key section. If not, copy the content of public key (.pub) to authorized key section in VM
Set Up Azure VM
Create an Azure VM (Ubuntu)
Open port 22 (SSH) and 80 (HTTP) in Network Security Group (NSG)
SSH into VM and install Docker:
Logout VM and Login again
CHeck with below command
Test the Full Flow
Commit and push code → GitHub Action triggers
Image builds → pushed to Docker Hub
Azure VM pulls latest image → runs container
Open browser: http:// to see your app
Monitoring Setup
Step 1: SSH into your Azure VM
Step 2: Go to prometheus folder
Step 3: Create Prometheus config file
Observe file named
prometheus.yml: Importance of prometheus.yml:Its is main configuration file for prometheus
Prometheus doesn't magically know what to monitor - it needs this configure to define:
Which target(apps/container/hosts) to scrape
Howfrequently to scrape them
Tells prometheus what to monitor.
Thus file place crucial role. It helps See example from my prometheus folder
Step 4: Docker Network
Docker network helps the containers in docker to communicate with each, this docker network is used among all. It is used of service discovery, as containers can reach each other by name. Create docker network if not created. It is created in
Github Actions ci-cd pipeline. Check with this command.You will output like
If it is not created, create one
Step 5: Run Prometheus and Grafana in Docker
Step 6: (Optional) Install Docker Metrics Exporter
Prometheus needs metrics from Docker – install this exporter:
Step 7: Access Grafana on Browser
Open: http://<your-azure-vm-ip>:3000
Default login:
User: admin
Password: admin (you'll be prompted to change)
Confirm Everything Works
http://<vm-ip>:5000/metrics → Should show Flask app metrics
http://<vm-ip>:9090/targets → Prometheus should show flask-app:5000 and cadvisor:9323 as UP
http://<vm-ip>:3000 → Grafana dashboard
Step 8: Connect Prometheus as Grafana Data Source
In Grafana:
Go to Settings → Data Sources → Add Prometheus
URL: http://<az-vm-ip>:9090
Click Save & Test
Step 9: Import a Dashboard
Go to + → Import
Paste Dashboard ID: 193 (Docker metrics)
Click Load → Select Prometheus as data source → Import
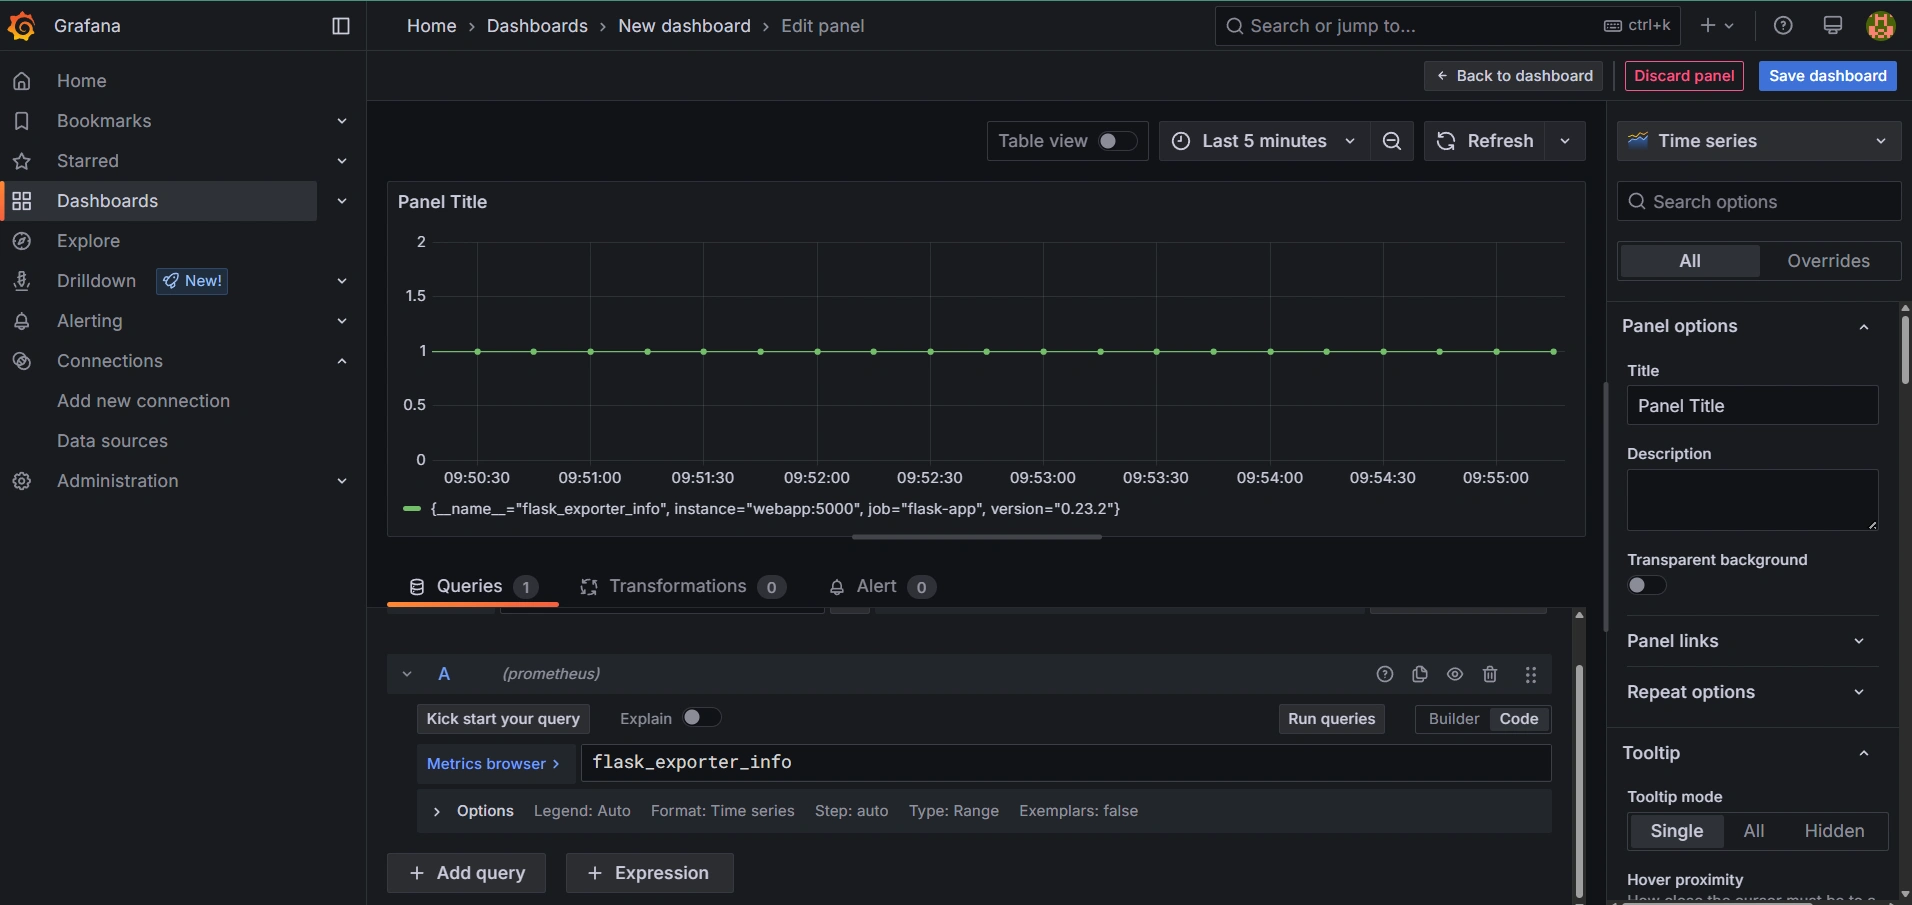
For Flask app Metrics
Go to Create → Dashboard → Add a panel
Enter metric like:
Customize and save the panel
Notes
Understanding Prometheus Configuration
prometheus.yml: This configuration file tells Prometheus what to monitor (targets) and how often (scrape interval)
The
scrape_interval defines how frequently Prometheus collects metrics (15s = every 15 seconds)The
scrape_configs section defines what services to monitor and where to find themThe
targets field specifies the host:port where metrics can be collectedAbout Exporters
Exporters are components that collect and expose metrics from various services in a format Prometheus can understand
cAdvisor (Container Advisor) is an exporter that collects container metrics from Docker
The exporter exposes Docker metrics on port 9323, which Prometheus then scrapes based on the configuration
Like this project
Posted Oct 6, 2025
Deployed Flask app with CI/CD, Docker, Azure, and monitoring tools.
Likes
0
Views
1