Ridership Recovery Analysis for MTA
Amy Tran
Ridership-recovery-of-the-Largest-NYC-Transportation-Network
Problem Overview
It has been nearly 4 years since the pandemic declared and by 2023, pandemic restrictions were largely lifted, and life had returned to normal. However, long-term impacts like health concerns and economic challenges are still felt in some parts of the world. It has a significant impact on transportation systems. MTA – Metropolitan Transportation Authority services, has experienced decreasing ridership due to lockdowns and work-from-home policies. The question is:
How has MTA’s total ridership evolved since the pandemic?
Has the MTA’s ridership fully rebounded to pre-pandemic levels, if not, what is the current rate of recovery?
Introduction
The dataset contains around 1,700 records of systemwide ridership and pre-pandemic baseline percentages across different MTA services such as Subways, Buses, LIRR, etc from 2020-2024.
Executive Summary
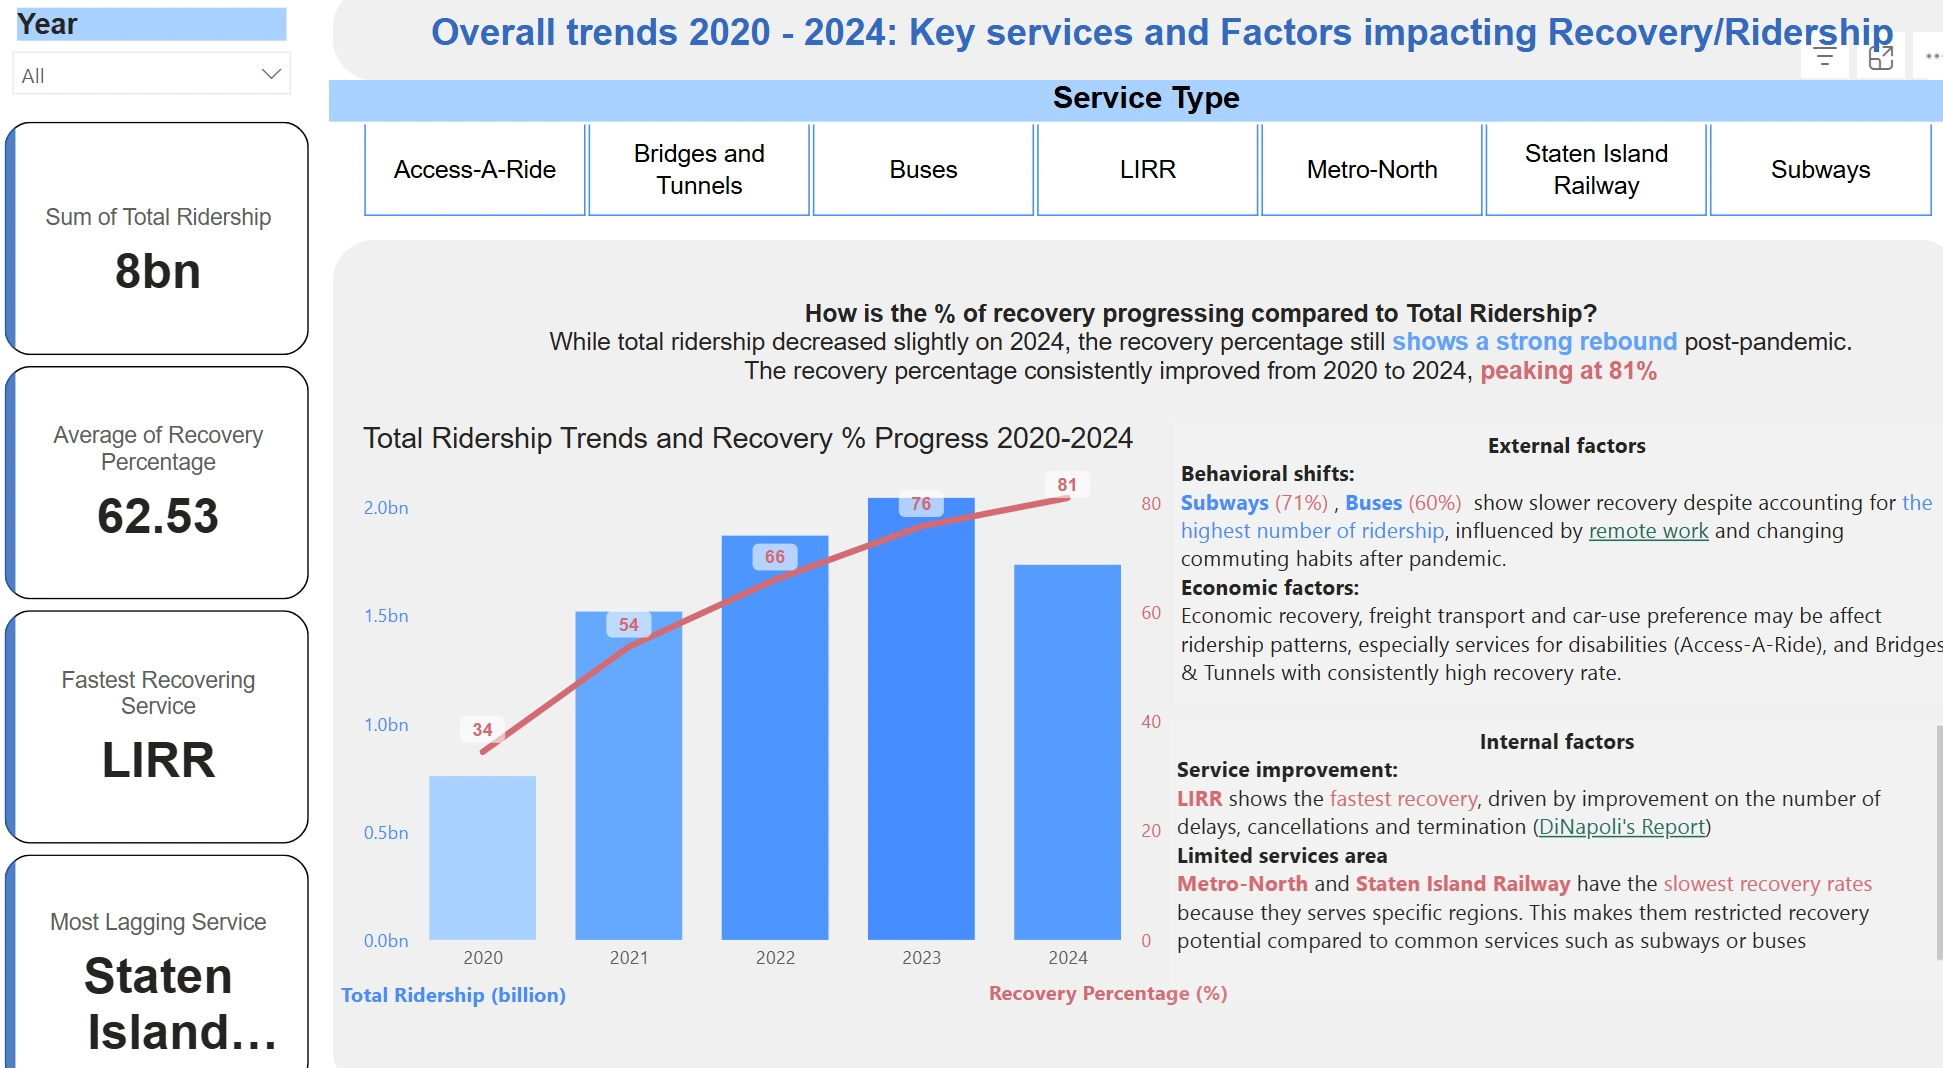
This analysis provides an overview of the current operational status of MTA services after pandemic, with a focus on number of ridership/trips and recovery metrics. Overall, the recovery percentage consistently improved by 62.53% on average from 2020 to 2024, peaking at 81%. While total ridership decreased slightly on 2024, the recovery percentage still shows a strong rebound post-pandemic. Across MTA service types, LIRR shows the fastest recovery, while Staten Island Railway has the slowest recovery
Insights Deep-Dive
1. Ridership and Recovery Progress Trends by Service Types
Access-A-Ride (AAR) and Bridges & Tunnels are the least likely to be impacted by pandemic with consistently high recovery rates, peaking at 120% and 101% respectively.
=> How can stakeholders optimize these services to meet the growing demand?: focus on improving infrastructure capacity and improving tolling systems to accommodate increased vehicle usage.
Subways and Buses show slower recovery rates by 71% and 60% respectively despite accounting for the highest number of ridership. This could be influenced by remote work and changing commuting habits after pandemic.
=> How can stakeholders adapt subways and buses service to accommodate new commuting habits, such as remote work? Introducing flexible schedules and pricing models such as fiscounts for off-peak travel. Increasing service frequency during busy times.
=> What can be done to make commuters feel safer and more confident using subways and buses? Focusing on cleanliness, better air quality and clear safety measures. Additionally, managing crowding and offering real-time updates can make the travelling experience more comfortable, encourage people to use public transport.
LIRR is the fastest service in rebounding back to usual ridership, peaking at 88% in 2024.
=> Why? The Long Island Rail Road has recovered more quickly, which is driven by improvement on the number of delays, cancellations and termination according to DiNapoli’s Report. It serves areas where driving alternatives are less convenient, making rail travel a preferred option. Additionally, LIRR’s infrastructure and direct service to key business hubs like Manhattan supported its recovery.
=> So what?: stakeholders can take advantage of its strong recovery by investing in service improvement such as increasing train frequency and onboard amenities.
Metro-North and Staten Island Railway have the slowest recovery rate on average by 51.08% and 37.81% respectively, which is led by limited services areas.
2. Temporal Analysis
Overall, weekends consistently exhibit the fastest recovery across the season, peaking at 73%. However, across the service type, ridership in weekends is lower than in weekdays.
In Autumn, the MTA services have the strongest rebound in recovery rate, followed by Winter.
LIRR (Long Island Rail Road) – Subways – Buses LIRR has higher recovery rate in weekend compared to that of Subways and Buses. This may led by leisure activities or long-distance travel in weekends to suburban getaway destinations
Recommendations
Enhance weekend services: increase the service frequency at weekends, given the higher recovery rates across the service types. Especially those with faster recovery rate such as LIRR, Bridges and Tunnels, AAR.
Understand service quality and upgrade accordingly: for example, consider investing in expanding or upgrading infrastructure for services with lower weekend like Staten Island Railway or Metro-North. This may require further analysis regarding current travel behaviour such as travel purpose, distance, cost, etc.
Adjust schedules for most popular service types like Subways and Buses: by using the temporal analysis regarding daily travelling patterns, MTA could effectively manage overcrowding, optimize for peak recovery and improve customer satisfaction.
Questions for stakeholders for further analysis
Do you have any specific targeted recovery rate for each service type? Are these targets adjusted for seasonal or geographical factors
For scheduling adjustment’s purpose, any benchmark for peak or off-peal times for each service?
For further forecasting models, which factors that you think most significantly influence recovery rates. For example, service frequency, fare price or demographic changes.
Should we consider external factors like local events, weather conditions or public holidays when analysing recovery trends
Like this project
Posted May 5, 2025
Analyzed MTA ridership recovery post-pandemic, showing a 62.53% average recovery from 2020 to 2024.
Likes
0
Views
1
Timeline
Jan 1, 2020 - Dec 31, 2024
Clients
Metropolitan Transportation Authority