Sentiment Analysis of Hotel Reviews
Tserundede Ejueyitchie

Sentiment Analysis 2' Using Matplotlib, NLTK And Pandas
9 min read
·
Apr 3, 2023
Sentiment analysis is a technique that uses natural language processing and machine learning algorithms to identify and extract subjective information from textual data. In the case of hotel reviews, sentiment analysis is used to analyze the sentiment of the reviews, which can be positive, negative, or neutral. In this project, our analysis is going to be based on hotel reviews.
Hotel reviews can make or break a hotel’s reputation in the hospitality industry. With the rise of online travel agencies, such as Expedia and Booking.com, more and more customers are leaving feedback about their hotel stays. These reviews provide valuable insights into the quality of the hotel’s services and facilities, which potential guests can use to make informed decisions. However, reading through thousands of reviews can be a daunting task, which is where sentiment analysis comes into play.
The first step in conducting sentiment analysis on hotel reviews is to gather the data. This involves collecting reviews from various online sources, such as TripAdvisor, Yelp, and Google Reviews. Once the data is collected, it is preprocessed to remove irrelevant information, such as website URLs and user names. The data is then cleaned by removing any punctuation marks, stop words, and non-English words. In this case, we will be using a downloaded dataset from TripAdvisor.
After the data is preprocessed and cleaned, the sentiment analysis process begins. There are various algorithms that can be used to conduct sentiment analysis, such as rule-based systems, machine learning models, and deep learning models. Rule-based systems use a set of predefined rules to classify the sentiment of the text, while machine learning models and deep learning models use training data to learn how to classify the sentiment.
The most commonly used algorithm for sentiment analysis is the Naive Bayes classifier. The Naive Bayes classifier is a probabilistic model that calculates the probability of a given text belonging to a certain sentiment class. The sentiment class with the highest probability is then assigned to the text.
Another commonly used algorithm for sentiment analysis is the Support Vector Machine (SVM) classifier. The SVM classifier is a machine learning model that finds the best boundary between the positive and negative sentiments in the data. The boundary is then used to classify new reviews as either positive or negative.
Once the sentiment analysis is conducted, the results are usually visualized using graphs and charts. These visualizations provide a quick and easy way to understand the sentiment of the reviews. For example, a pie chart could be used to show the percentage of reviews that are positive, negative, or neutral.
Lets dive in to our dataset and code base!
In this analysis we will be using the following python tools:
Pandas, one of the most widely used python open-source tools for data manipulation and analysis.
matplotlib is an easy-to-use comprehensive Python library for creating visualizations. It supports basic plots such as; line, bar, scatter, etc. It also supports plots of arrays & fields, statistical plots (like histogram, boxplot, violin, etc.).
NLTK ( Natural language Toolkit). A powerful text processing libraries for typical Natural Language Processing (NLP) tasks like cleaning, parsing, stemming, tagging, tokenization, classification, semantic reasoning, etc.
The first step is to import your various libraries for this analysis:
Lest import our dataset and see how it looks like!
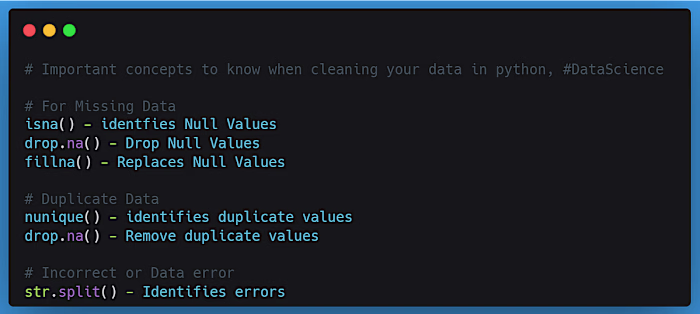
The next on our action would be to check for missing values. In any analysis, its advisable to check for missing values to know if it would affect your final report or not. the less missing values the better. In situations of few missing values its best to ignore and move on with the analysis except when its significant.
From the above its evident that the missing values are insignificant and also, the columns with missing values are not what we will be working with.
Next would be to select the needed column for this analysis. For this we will be using the ‘reviews.rating’, ‘reviews.text’ and ‘city ‘columns. These columns have the necessary details to carry out this analysis.
For the next step, we will be creating a subset
row_id and Response fields into a new dataframe, which is the input format required for by the SentimentIntensityAnalyzer class from “NLTK”. This will also clean up the text data by removing all non-alphabet characters and converting them to lower case.The code snippet below performs these two tasks and prints the top ten rows of the resulting dataframe. Copy this code snippet into the next cell of your jupyter notebook and run that cell.
Next, we are going to change “reviews.text” to “reviews”
Change all “reviews” to string..
Generation of sentiment polarity scores
For this we will be using the SentimentIntensityAnalyzer from VADER.
VADER Sentiment Analysis :
VADER (Valence Aware Dictionary and sEntiment Reasoner) is a lexicon and rule-based sentiment analysis tool that is specifically attuned to sentiments expressed in social media. VADER uses a combination of A sentiment lexicon is a list of lexical features (e.g., words) which are generally labeled according to their semantic orientation as either positive or negative. VADER not only tells about the Positivity and Negativity score but also tells us about how positive or negative a sentiment is.
VADER also generates a numeric score in the range of negative one (-1) to positive one (+1) to indicate the intensity of how negative or positive the sentiment is. This is called the polarity score and is implemented by the
polarity_score method of the SentimentIntensityAnalyzer class.Polarity score in the range of -1 to -0.5 typically indicates negative sentiment.
Polarity score greater than -0.5 and less than +0.5 typically indicates neutral sentiment.
Polarity score in the range of +0.5 to 1 typically indicates positive sentiment.
First, we are going to write a code to create a dataframe for staging the output of the SentimentIntensityAnalyzer.polarity_scores method.
The next few steps involve instantiating an object of the class
SentimentIntensityAnalyzer and running a for-loop to iterate the polarity_scores method over each row of input text dataframe df_subset. Another for loop is embedded with the earlier loop to write the sentiment polarity score for each sentiment type to an intermediate dataframe. The three sentiment type values are.neg for negative sentiment
neu for neutral sentiment
pos for positive sentiment
The Compound score is a metric that calculates the sum of all the lexicon ratings which have been normalized between -1(most extreme negative) and +1 (most extreme positive).
At the end of the for loop, clean the output dataframe by:
Deleting the dummy row from the output dataframe
Removing any duplicate rows that could potentially creep into the output dataframe
Filtering the output dataframe to only keep rows for sentiment type of compound
The code snippet below performs these tasks and prints the top ten rows of the resulting dataframe. Copy this code snippet into the next cell of your jupyter notebook and run that cell. Depending on the size of your input dataset and machine resources, this step may need a few minutes to complete.
Now, merge this output dataframe
t_df_cleaned with the input dataframe dfa using the field row_id. This dataframe merge operation in Python is conceptually similar to performing a join on two database tables in SQL.Visualization
Firstly, lets use the
describe method in pandas to generate statistical summary of values in the Sentiment_score field. These summary aggregates metrics like median, min, max, count, STD etc.STATISTICS
CHARTS
Using matplotlib, we will create the sentiment score charts. This wil be done using the rating.reviews column against the sentiment score. It will give us the sentiment behind each rating.
The plot reveals that reviewers within 4.75 ‘rating’ has the highest mean sentiment score, while reviews that within 1.45 ‘rating’ has the lowest mean sentiment score.
Next, will be mean sentiment score against sentiment type.
The chart reveals that reviewers with neutral views has the highest mean sentiment score.
Boxplot
A boxplot, also called a box and whisker plot, is a way to show the spread and centers of a data set. Measures of spread include the interquartile range and the mean of the data set. Measures of center include the mean or average and median (the middle of a data set). We are going to use seaborn seaborn to create the boxplot to get visualization on the sentiment spread across each rating.
This boxplot reveals interesting insights about how reviewers within each rating feel about the hotels in general.
The box for Rating 4.0 and 5.0 is among the tallest box, which indicates a wider spread in the sentiment scores of responses from this reviews. This spread is a sign of polarization within the rating, which means the reviewers have a balance feeling for both positive and negative sentiments about the hotels.
While box for rating 1.0, 2.0 and 3.0 has a shift of median to the negative sentiment. this means more reviewers have a strong sentiment feel about the hotels while the others have a negative feel about the hotels.
Final Notes
Hotel managers can use the results of sentiment analysis to improve their services and facilities. If the majority of the reviews are negative, the hotel management can take steps to address the issues raised in the reviews. For example, if several guests complain about the cleanliness of the rooms, the hotel management can increase the frequency of room cleaning and ensure that the housekeeping staff is properly trained. If the majority of the reviews are positive, the hotel management can use this information to market their hotel to potential guests.
In addition to helping hotel managers improve their services and facilities, sentiment analysis can also be used by customers to make informed decisions about which hotels to stay at. Customers can use the results of sentiment analysis to compare the sentiment of reviews for different hotels and choose the one that has the highest percentage of positive reviews.
In conclusion, sentiment analysis is a powerful tool that can be used to analyze the sentiment of hotel reviews. It provides valuable insights into the quality of the hotel’s services and facilities, which hotel managers can use to improve their operations. Additionally, customers can use the results of sentiment analysis to make informed decisions about which hotels to stay at. As the hospitality industry becomes increasingly competitive, sentiment analysis will become even more important in ensuring that hotels provide the best possible experiences for their guests.
Data set credits goes to Machine learning Repository, UCI.
Author: Kavita Ganesan and ChengXiang Zhai
Inspiration from Sanil Mahtre
Like this project
Posted Jun 16, 2025
Conducted sentiment analysis on hotel reviews using Python tools.
Likes
0
Views
1
Timeline
Apr 1, 2023 - Apr 3, 2023