Canopy Environmental Dashboard
Ata ul Mohsin
🔴 Problem
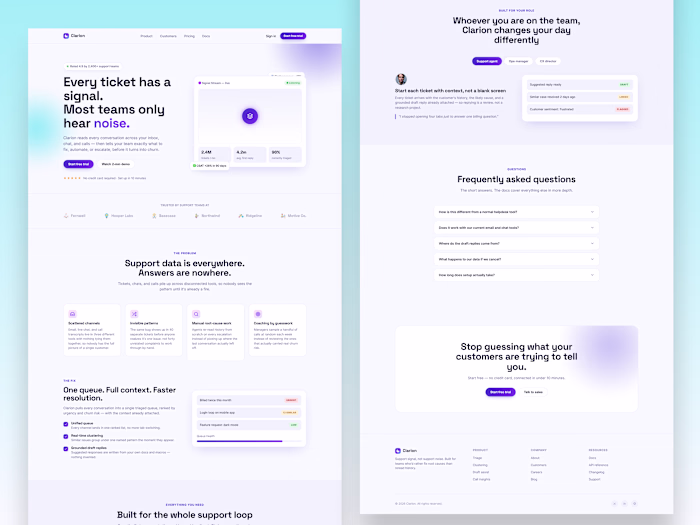
Environmental data is often scattered across complex tools, making it hard to understand ecosystem health, biodiversity changes, and climate impact in a clear and actionable way. Most dashboards lack clarity, context, and a human-centered approach.
🟣 Solution
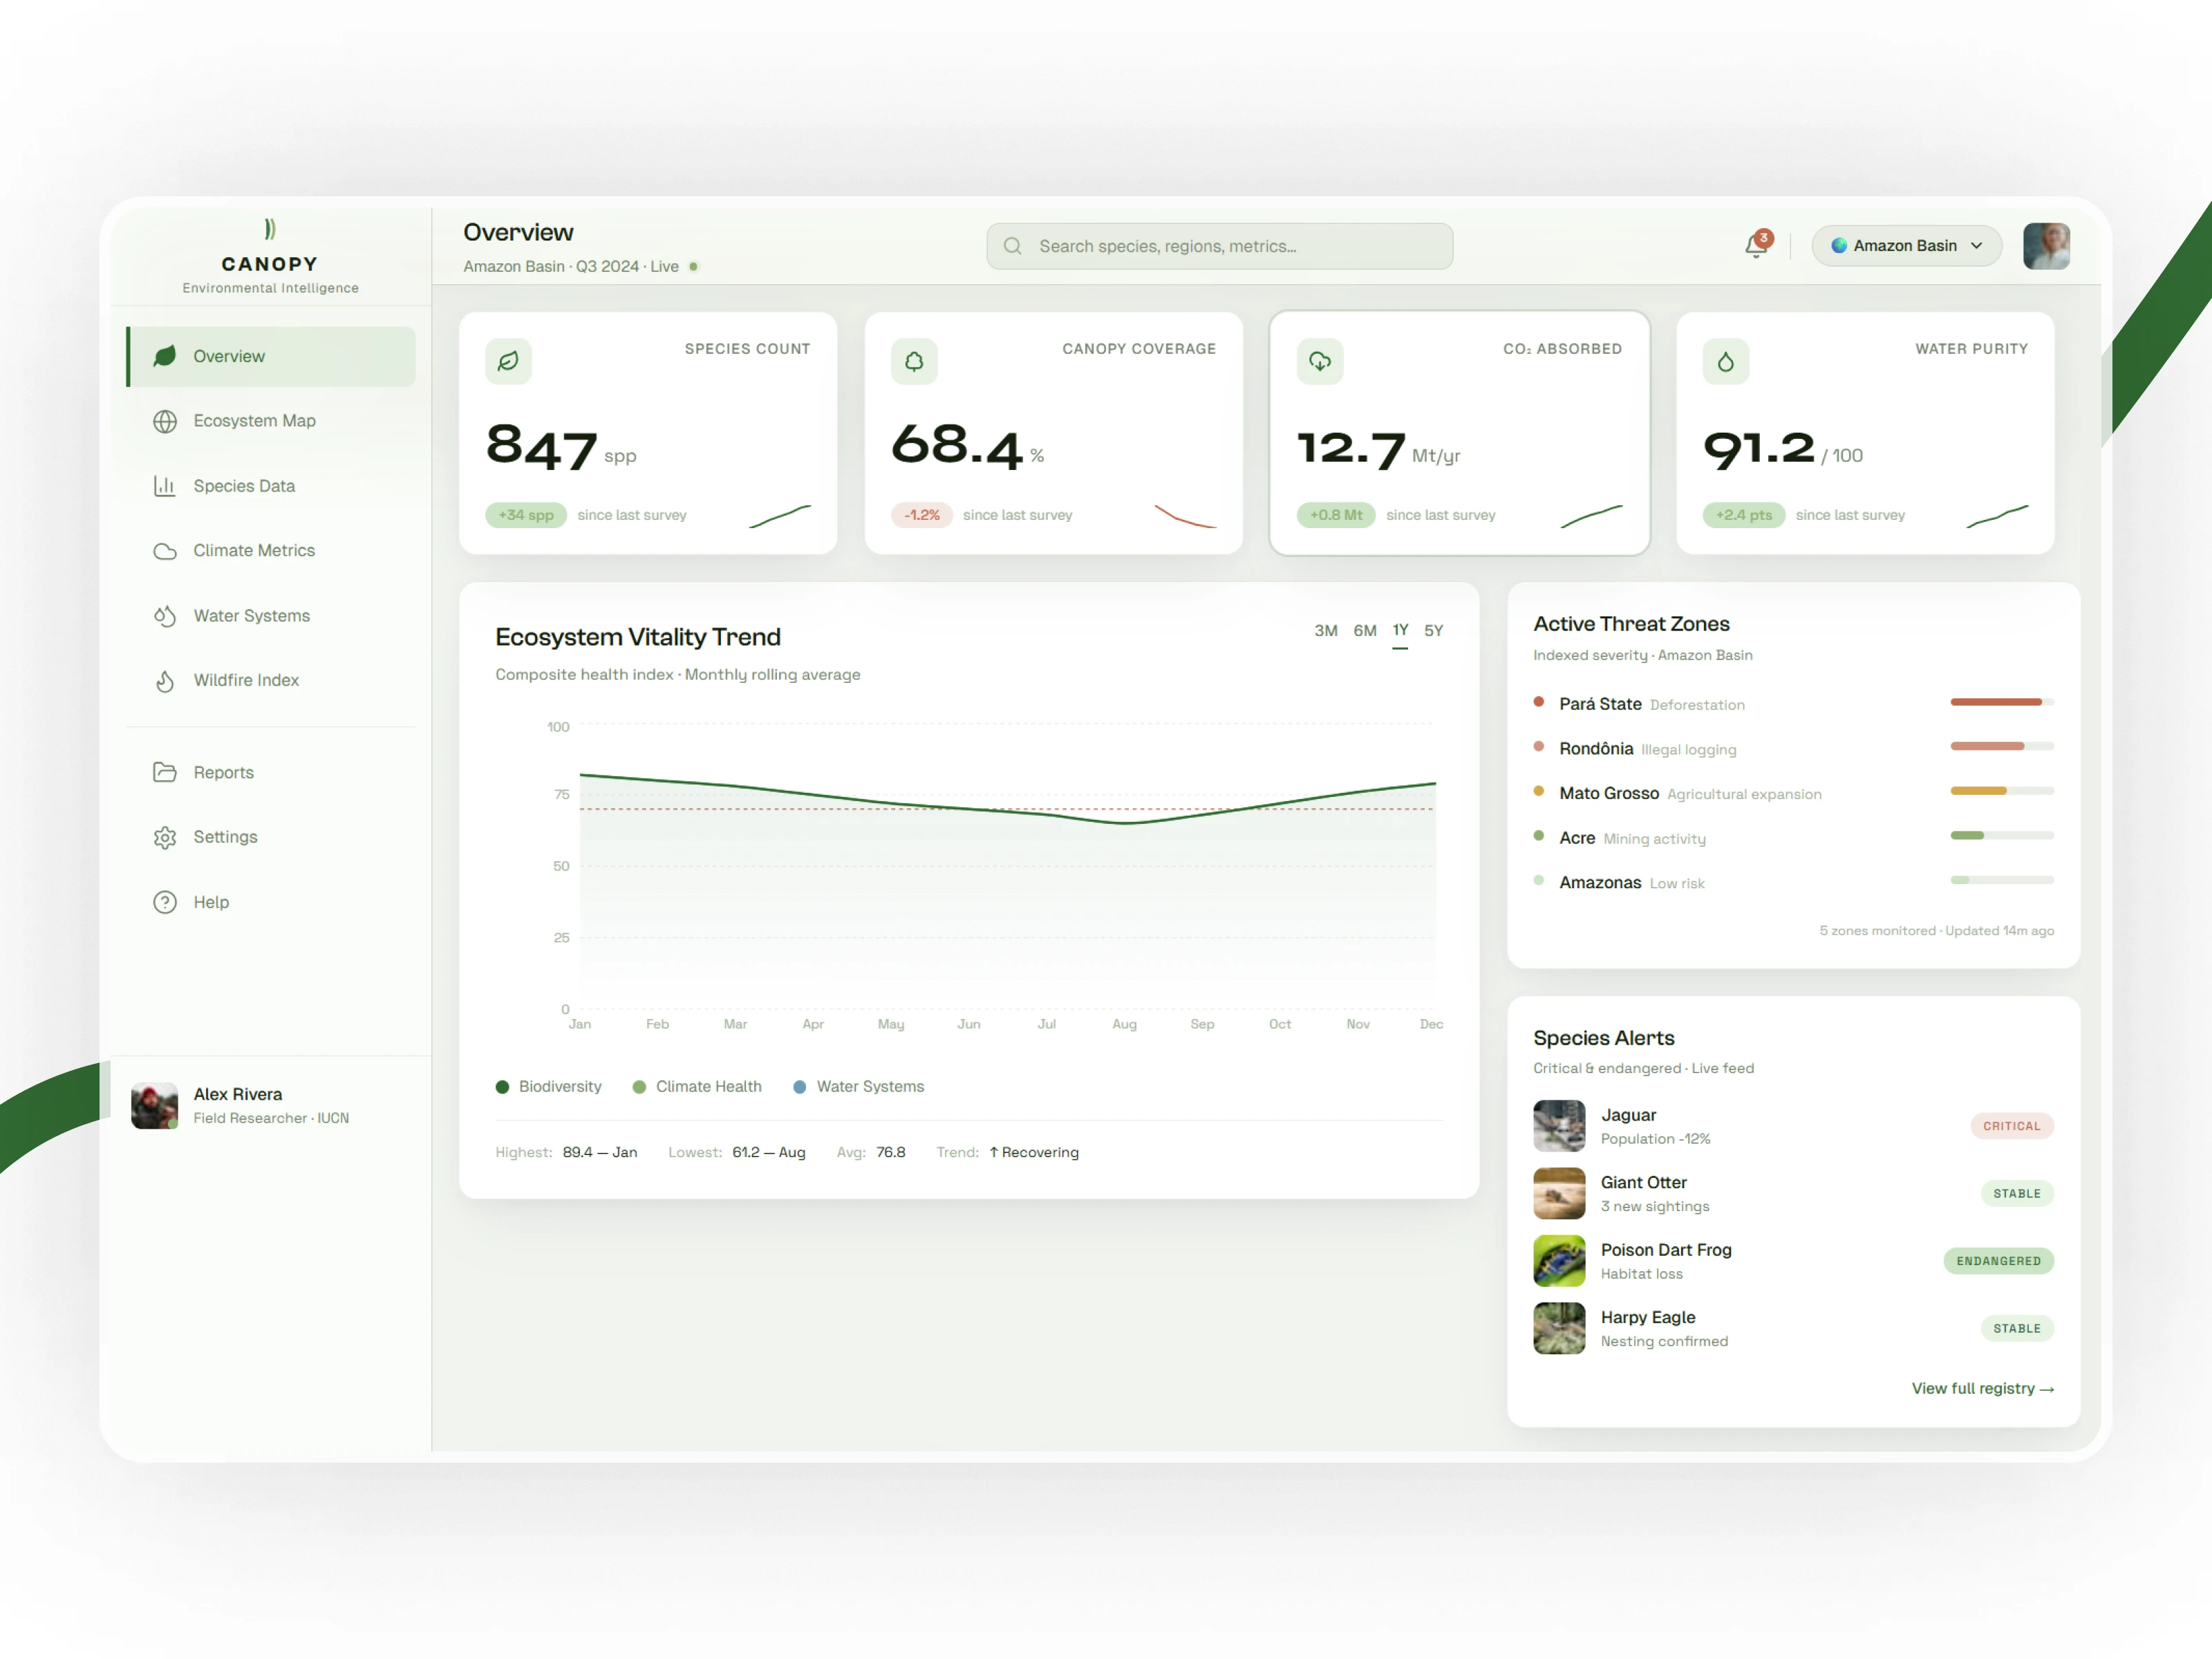
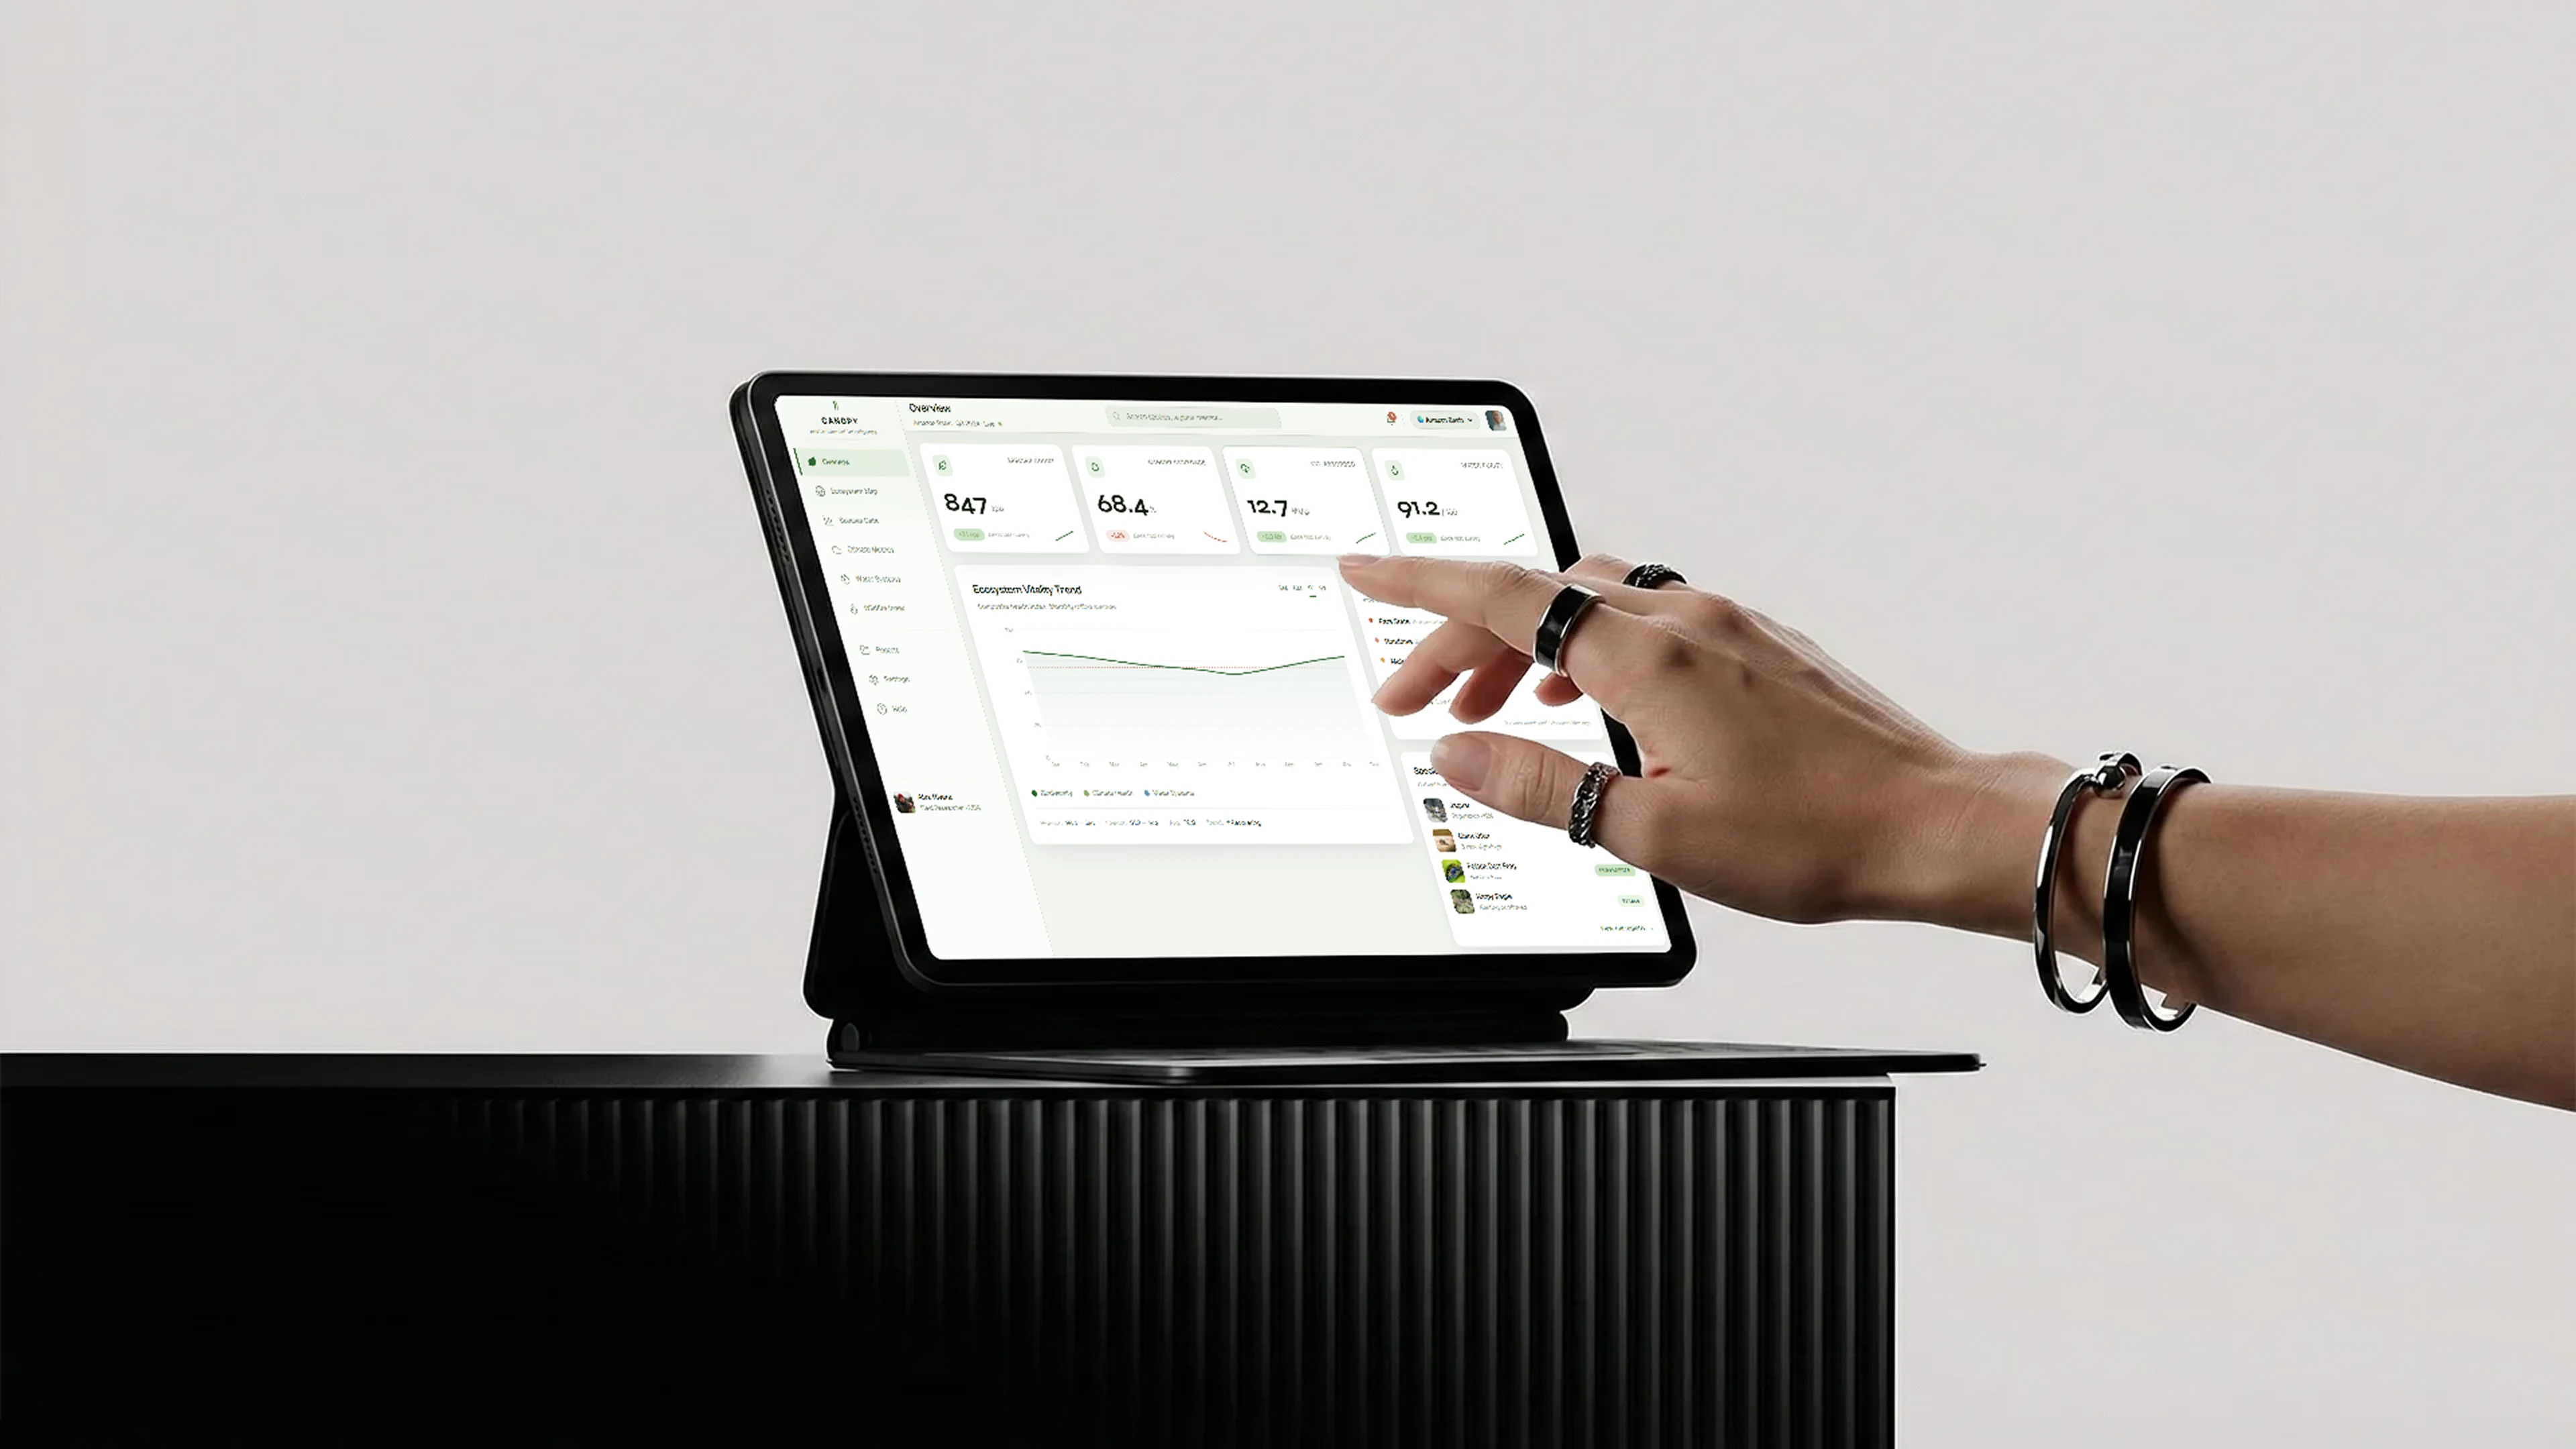
Canopy transforms environmental data into a calm, structured, and insight-driven dashboard. It visualizes biodiversity, climate, water systems, and threat zones in a unified interface designed for researchers, analysts, and environmental teams.
🟢 Result
Clear understanding of ecosystem health
Faster response to environmental threats
Better tracking of biodiversity and climate metrics
A more intuitive and human-centered data experience
🎯 Goals Achieved
Designed a nature-inspired, non-generic dashboard
Simplified complex environmental datasets
Balanced data density with visual calmness
Created a scalable system for research tools
Improved usability for real-world monitoring
⚡ Features
Biodiversity & ecosystem KPI system
Ecosystem vitality trend visualization
Threat level monitoring system
Species alert feed
Research station mapping
Climate data table
Field team activity tracking
Got a project to discuss?
Get in touch with us✌️
Our partners hire us to help with their:
→ Products (mobile and web apps)
→ Websites & Landing Pages (Webflow & Framer)
→ Motion design (Rive & AE)
→ Branding work
Let's chat! 👋
Like this project
Posted May 4, 2026
Designed a unified dashboard to enhance understanding of environmental data.
Likes
0
Views
4