Youseff Option Trade Reports Analysis
Gabriel Johnson
Youseff Option Trade Reports Analysis
Project Overview
This project focuses on analyzing Youseff's option trade reports to derive meaningful insights, identify trading patterns, and explore strategies that contributed to trading outcomes. The analysis will involve cleaning, organizing, and visualizing data from the raw Excel file to provide actionable insights.
Charts and Insights
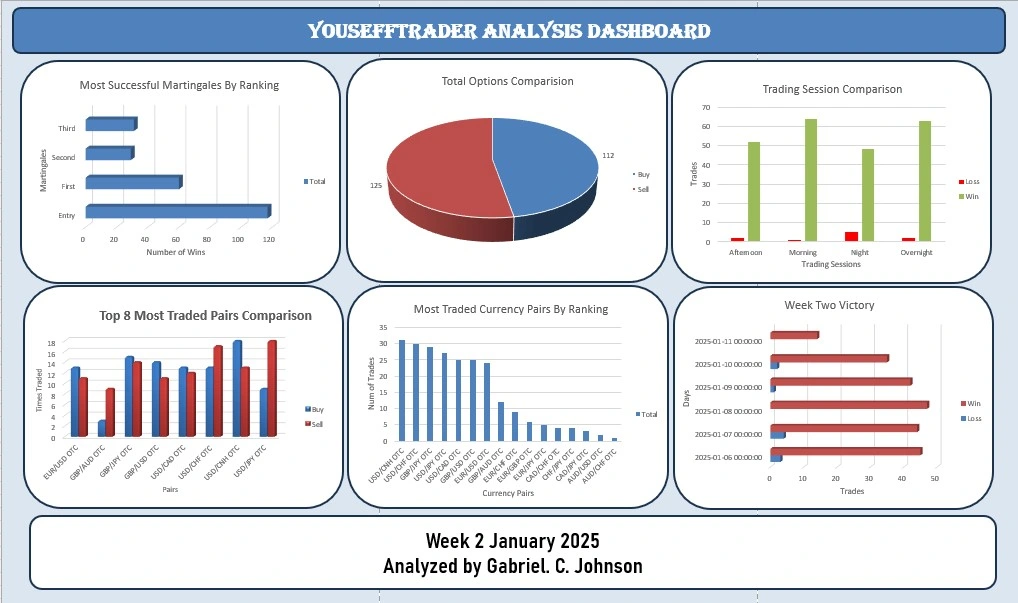
Dashboard Overview
Description: A comprehensive view of YouseffTrader's performance and trading trends for Week 2 of January 2025.
Total Options Comparison
Description: A breakdown of total Buy and Sell trades, showcasing the distribution of trading activity.
Most Successful Martingales By Ranking
Description: Ranking of the most successful Martingale strategies based on the number of wins.
Trading Session Comparison
Description: A comparison of trading session performance across different times of the day.
Top 8 Most Traded Pairs Comparison
Description: A bar chart illustrating the Buy and Sell distribution of the top 8 traded currency pairs.
Most Traded Currency Pairs By Ranking
Description: Ranking of currency pairs by trading frequency, showing the most traded pairs overall.
Week Two Victory Analysis
Description: A detailed analysis of daily trade victories during Week 2 of January 2025.
Goals of the Project
Understand the overall performance of trades.
Identify trends in trading activity over time.
Analyze the success rates and profitability of different strategies.
Present the findings through clear visualizations and summaries.
Tools and Libraries
The following tools and libraries will be used throughout this analysis:
Python: For data manipulation and analysis.
Pandas: To clean and preprocess the data.
Matplotlib/Seaborn: For visualizing trading patterns and results.
Jupyter Notebook: For interactive data exploration.
Excel: To view and cross-check raw data.
Step 1: Initial Data Exploration
Objective: The first step involves loading the raw data from the Excel file, understanding its structure, and identifying potential issues that need to be addressed before analysis.
Steps:
Import the raw Excel file into Python using Pandas.
Inspect the dataset to understand its columns, data types, and initial observations.
Look for missing values, duplicates, and formatting inconsistencies.
Document key observations from the raw dataset.
Code Example:
Here’s a sample script to load and explore the data:
Expected Outcome:
A clear understanding of the data structure (columns, rows, and types).
Notes on any cleaning/preprocessing steps required.
Loading this content connects you to GitHub Gist.
GitHub Gist privacy informationLike this project
Posted Apr 16, 2025
Analyzed Youseff's option trade reports to derive insights and identify trading patterns.
Likes
1
Views
2
Timeline
Jan 8, 2025 - Jan 9, 2025