EPM Cloud Planning
Alex M
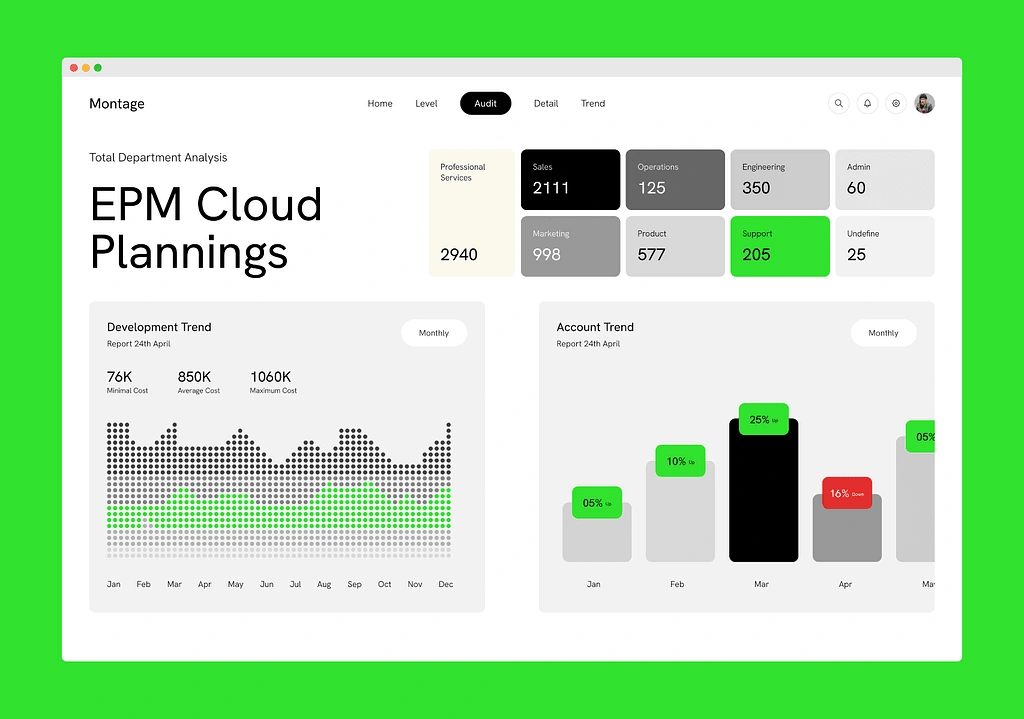
The dashboard presents an analytics interface that enables users to monitor and evaluate various departmental metrics and trends effectively. The visual hierarchy and clean layout ensure clarity and easy data interpretation.
Header Section
Navigation Bar: Includes links like Home, Level, Audit, and profile options for seamless navigation.
Main Title
Highlights the focus: EPM Cloud Plannings with a subheading for Total Department Analysis, establishing the purpose clearly.
Metrics Overview
Displays department-specific data (e.g., Sales, Operations, Support) in visually distinct cards with contrasting colors to emphasize critical stats.
Data Visualization Panels
Development Trend: A dot plot graph visualizing cost trends over the months, categorized into minimal, average, and maximum values.
Account Trend: Bar graphs highlighting monthly performance percentages, marked with green for growth and red for declines.
Design Attributes
Color Palette: Minimalist grayscale with green and red accents to signify trends and performance indicators.
Typography: Clean, sans-serif fonts for readability.
Layout: Grid-based structure for an organized and responsive design.
Purpose
This dashboard is tailored for business users or managers to gain actionable insights into departmental operations, financial trends, and performance metrics. The interactive and intuitive design ensures ease of use while maximizing data visibility.
Would you like suggestions for improvement or further details?
Like this project
Posted Nov 17, 2024
A clean EPM Cloud Planning dashboard with trend graphs, department metrics, and intuitive navigation. Highlights performance via color-coded insights.
Likes
0
Views
9