Your data, animated. A 30-second

Gabriel Gris

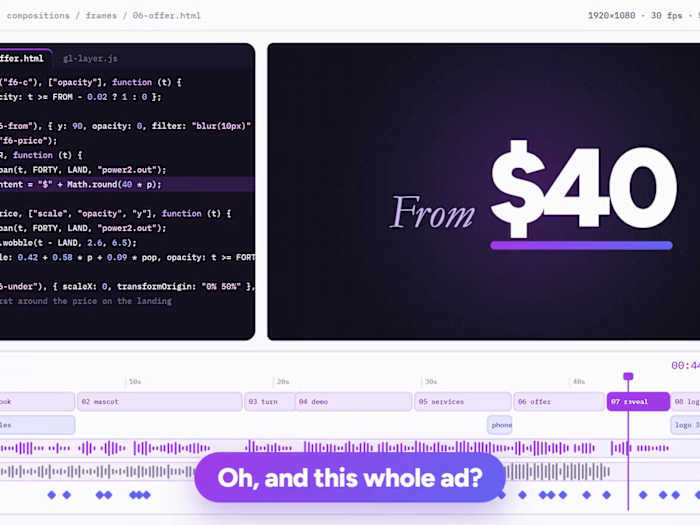
Your data, animated. A 30-second showcase of three ways to make numbers move: a bar chart race where the lead changes hands twice, a growth line whose MRR counter rides the tip of the pen, and a KPI dashboard where every number counts up with its bar. One rule throughout: one chart, one message. No pie charts, no gridlines, nothing a viewer can't read in three seconds. Every value on screen is computed from the dataset, so it never drifts from the source. Demo data, built in code with GSAP.
Like this project
Posted Oct 20, 2026
Your data, animated. A 30-second showcase of three ways to make numbers move: a bar chart race where the lead changes hands twice, a growth line whose MRR co...
Likes
0
Views
0