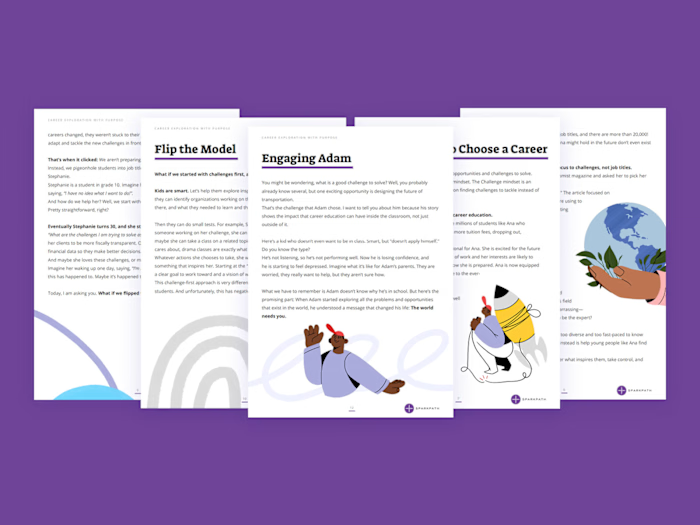
Vector Illustration Kit for AgTech User Documentation

Gloria Shugleva



When technology meets agriculture, the processes behind it can get surprisingly complex. Mapping fields, verifying farm data, monitoring land and forests, and navigating supply chains all involve information that isn't always easy to communicate visually.
For Meridia, I created a reusable illustration system designed to make these complex concepts more approachable and help users better understand the technology behind their platform.

The Challenge
Meridia needed a visual language that could support its user documentation and explain complex processes without relying on walls of text.
The illustrations needed to be:
Easy to understand at a glance
Consistent across different documentation and use cases
Flexible enough to represent different agricultural and mapping scenarios
Simple enough to work alongside UI and written content
The goal wasn't simply to create a set of nice-looking illustrations — it was to build a visual toolkit that the team could continue using long after the project was finished.

Finding the Right Visual Language
This was my first project working with an AgTech company, and I particularly enjoyed the freedom and trust that Meridia's team gave me throughout the process.
After reviewing the brief and exploring the subject matter, we quickly identified isometric illustration as the right direction.
The perspective naturally complemented the concept of mapping, landscapes, and spatial data, while allowing complex scenes to be broken down into simple, recognisable elements.
I established a system based on:
Isometric perspective + limited colour palette + modular elements + consistent proportions
This meant that every illustration could feel like part of the same visual world.
A System, Not Just a Set of Illustrations
One of the most important aspects of the project was making the illustrations modular.
By keeping the same perspective, proportions, colours, and visual rules throughout the kit, individual elements could easily be:
Reused across different documents
Combined to create new scenes
Adapted for different processes
Integrated into UI and marketing materials
Rearranged like visual building blocks
This gave Meridia's team much more flexibility than a collection of standalone illustrations would have provided.
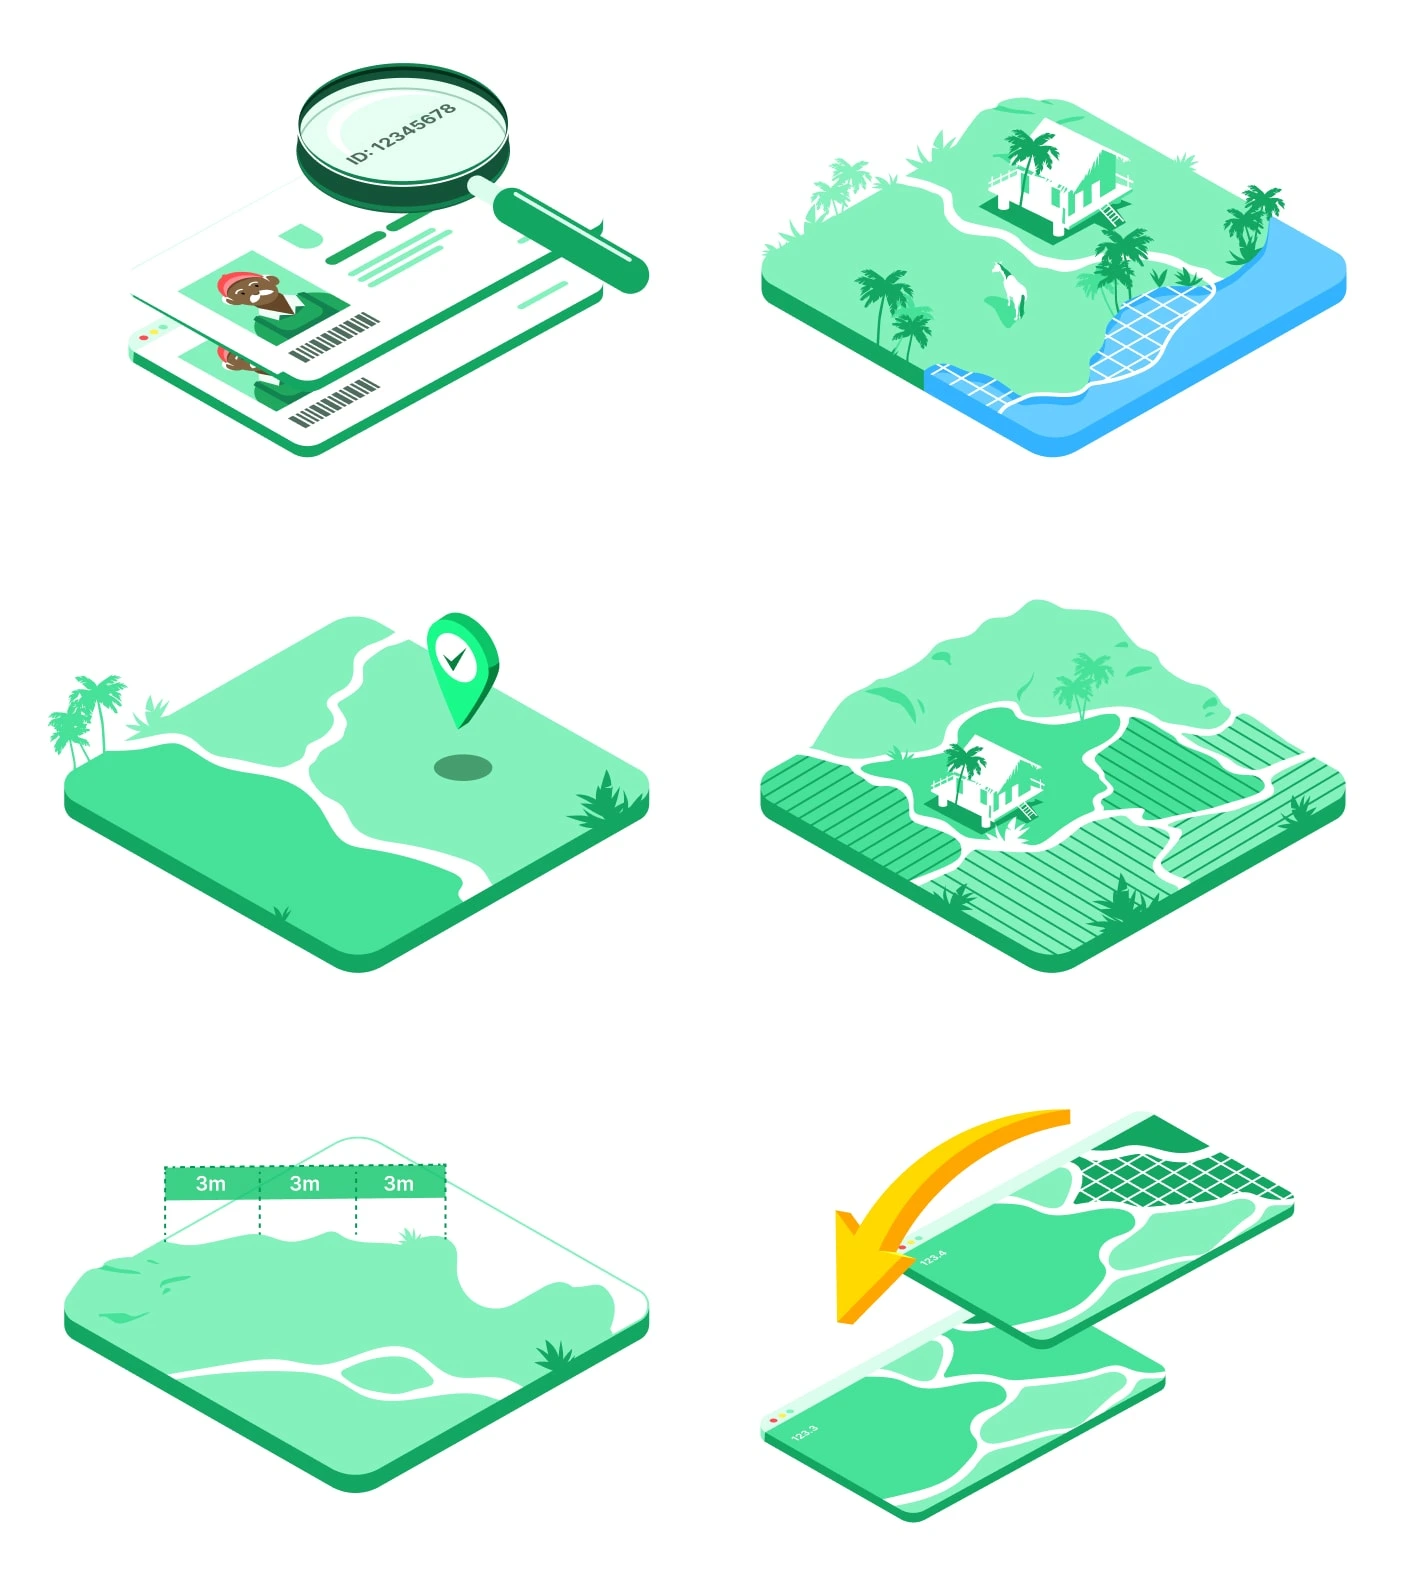
The Illustration Kit
The final system included 30+ custom vector illustrations and icons covering topics related to:
Agricultural fields
Land and forests
Mapping and geolocation
Farm data
Supply chains
Field verification
Agricultural technology
All assets were created as editable vectors, allowing the team to adapt and reuse them across different applications.

The Result
The project resulted in a cohesive illustration library that could turn complex AgTech concepts into clear, visual stories.
More importantly, the kit gave Meridia a scalable visual language that could grow with the product — allowing team members to create new combinations and applications without losing consistency.
A good illustration system shouldn't just explain today's product.
It should be ready to explain tomorrow's product, too.
About Meridia
Meridia is an AgTech company specialising in software solutions for field data within complex agri-commodity supply chains. After more than a decade of mapping and verifying farm data, Meridia combines real-world field experience with technology to provide solutions with global coverage
Like this project
Posted Jan 19, 2026
Making complex agricultural technology easier to understand — one illustration at a time.
Likes
0
Views
7
Timeline
Jan 19, 2025 - Apr 19, 2025
Clients
Meridia