
The brief I set myself: carbon and biodiversity monitoring is a very technical sale. The site has to feel alive and trustworthy before anyone reads a spec sheet. This is my own concept build in Framer, with placeholder content.
Hero: one floating island, one headline
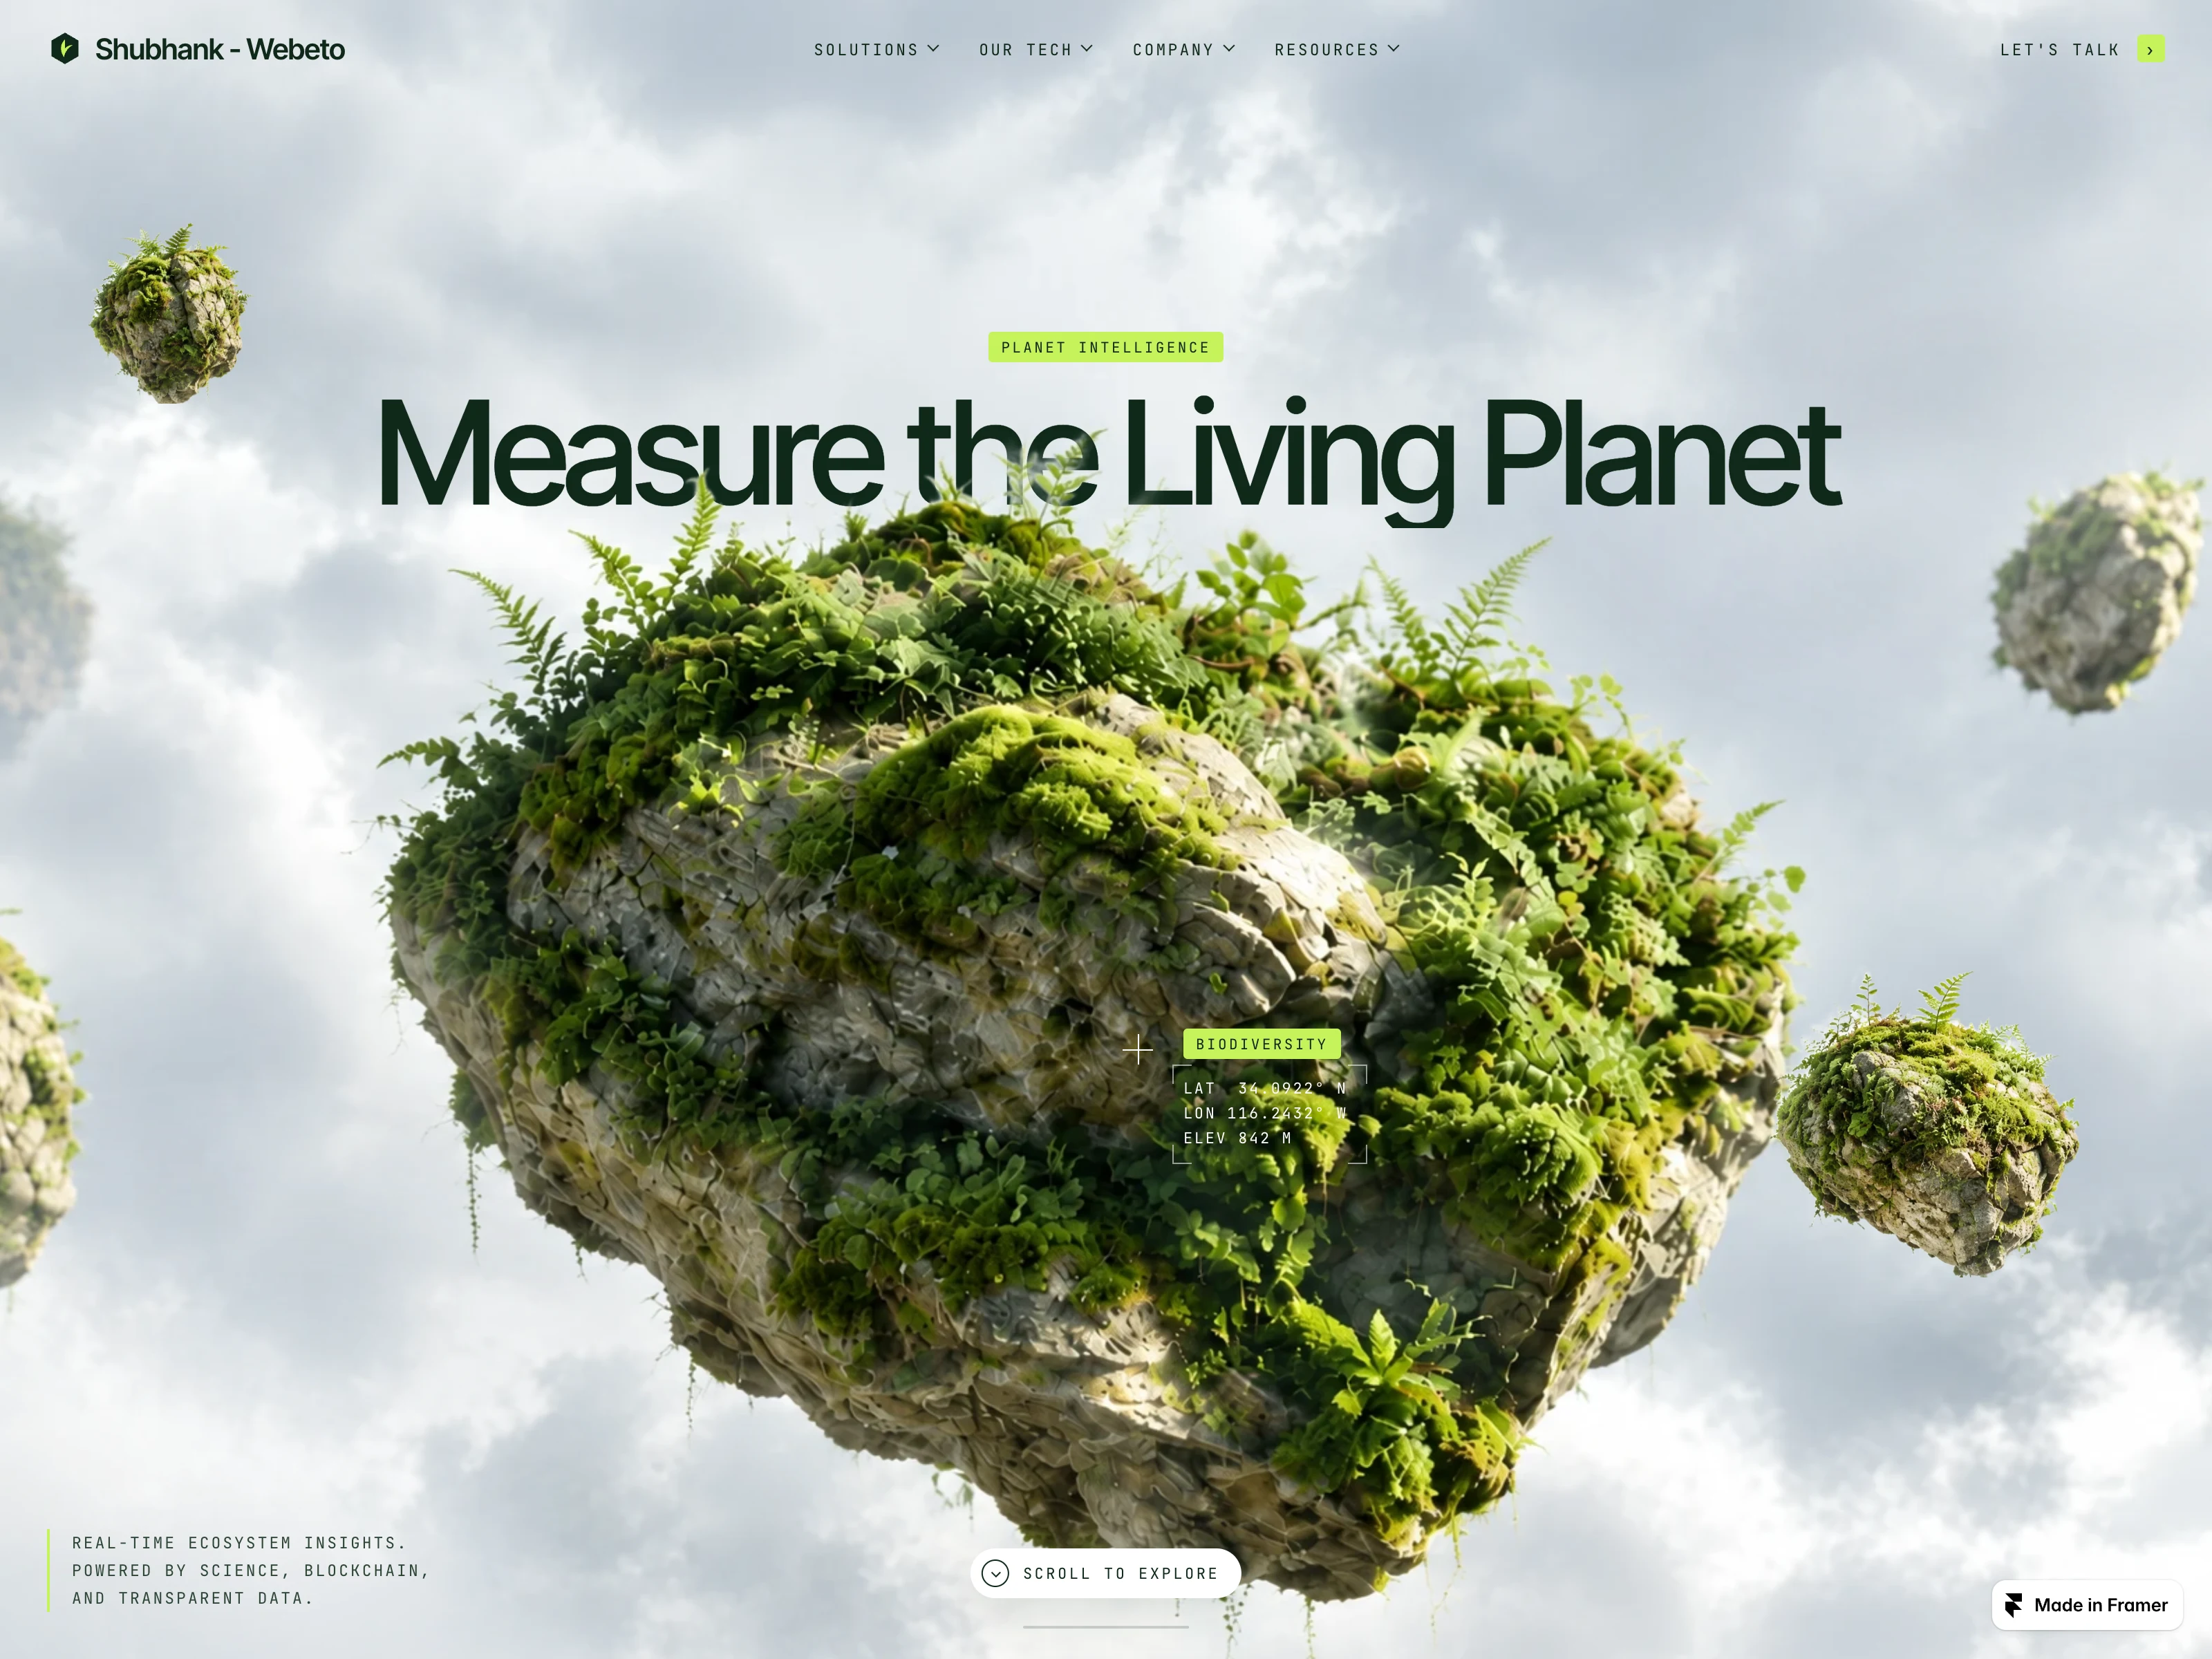
Hero section
One floating moss island over soft clouds with a single headline, "Measure the Living Planet", and a small coordinates tag, so it reads as real field data and not stock nature.
Solutions: three cards, one plain sentence each
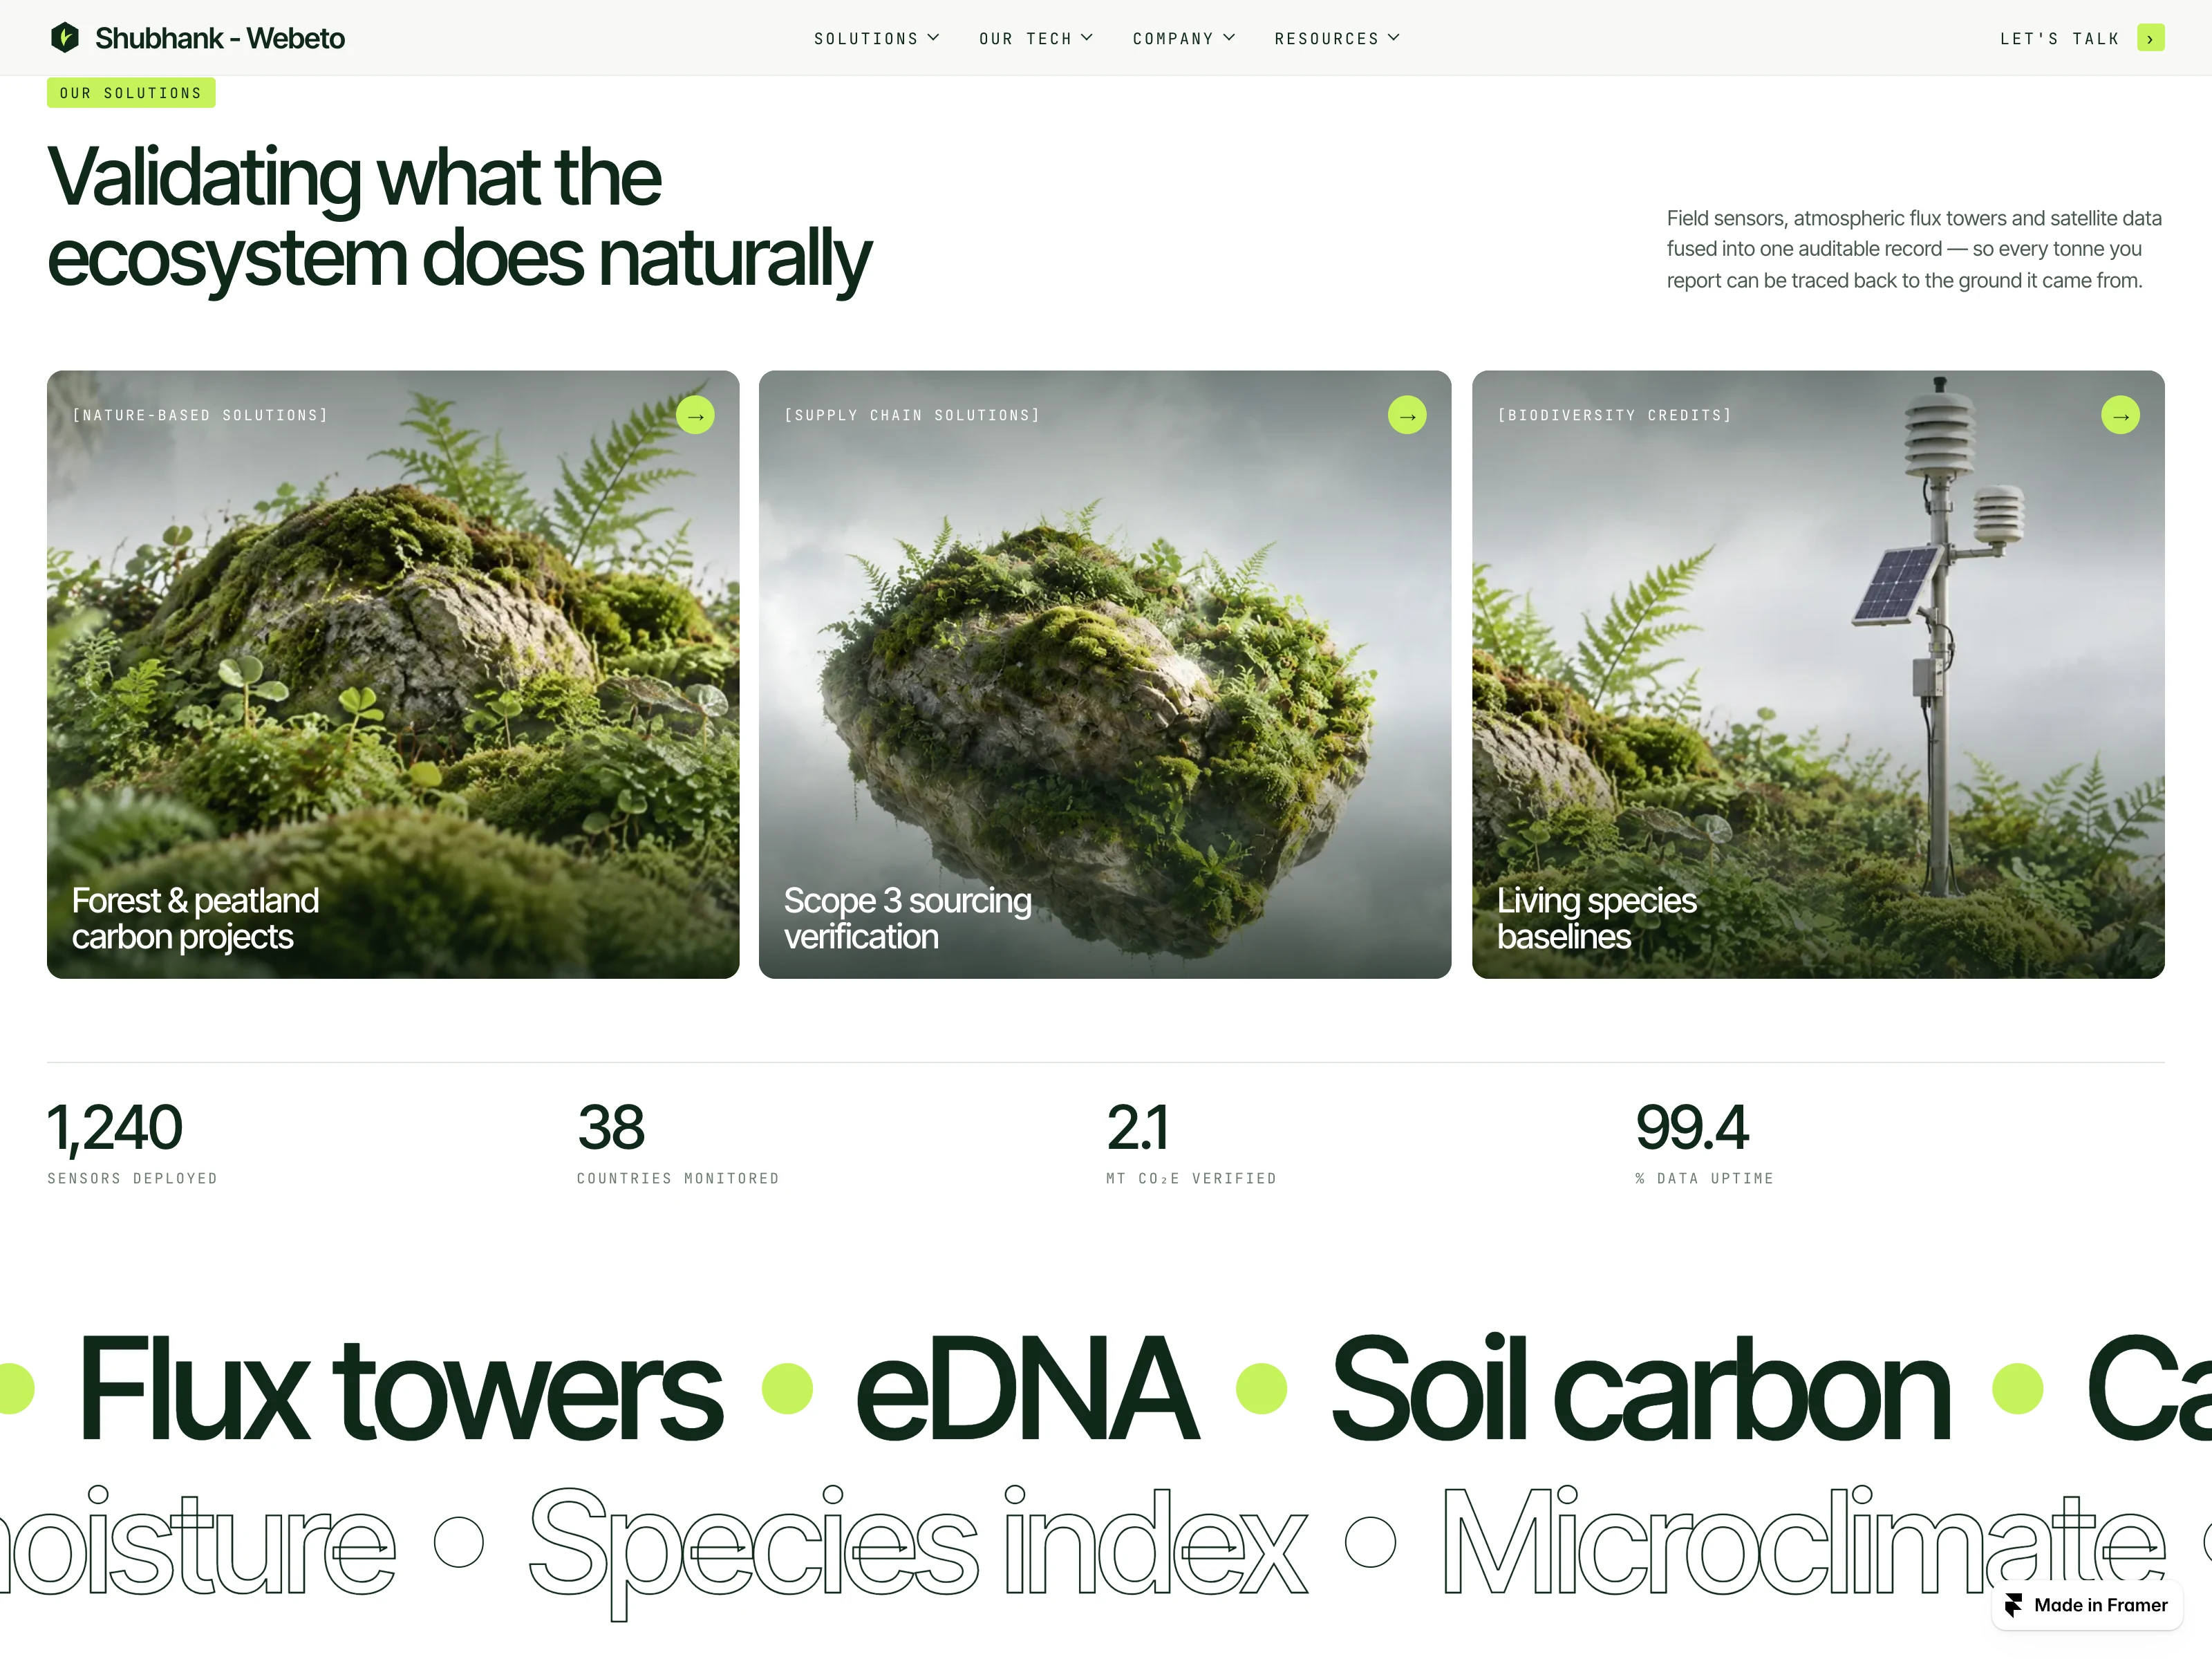
Solutions section
Three image cards (forest and peatland carbon, Scope 3 sourcing, biodiversity baselines), with count-up stats and a two-row ticker of signals (soil carbon, eDNA, canopy moisture) underneath.
Tech: a bento grid that feels live
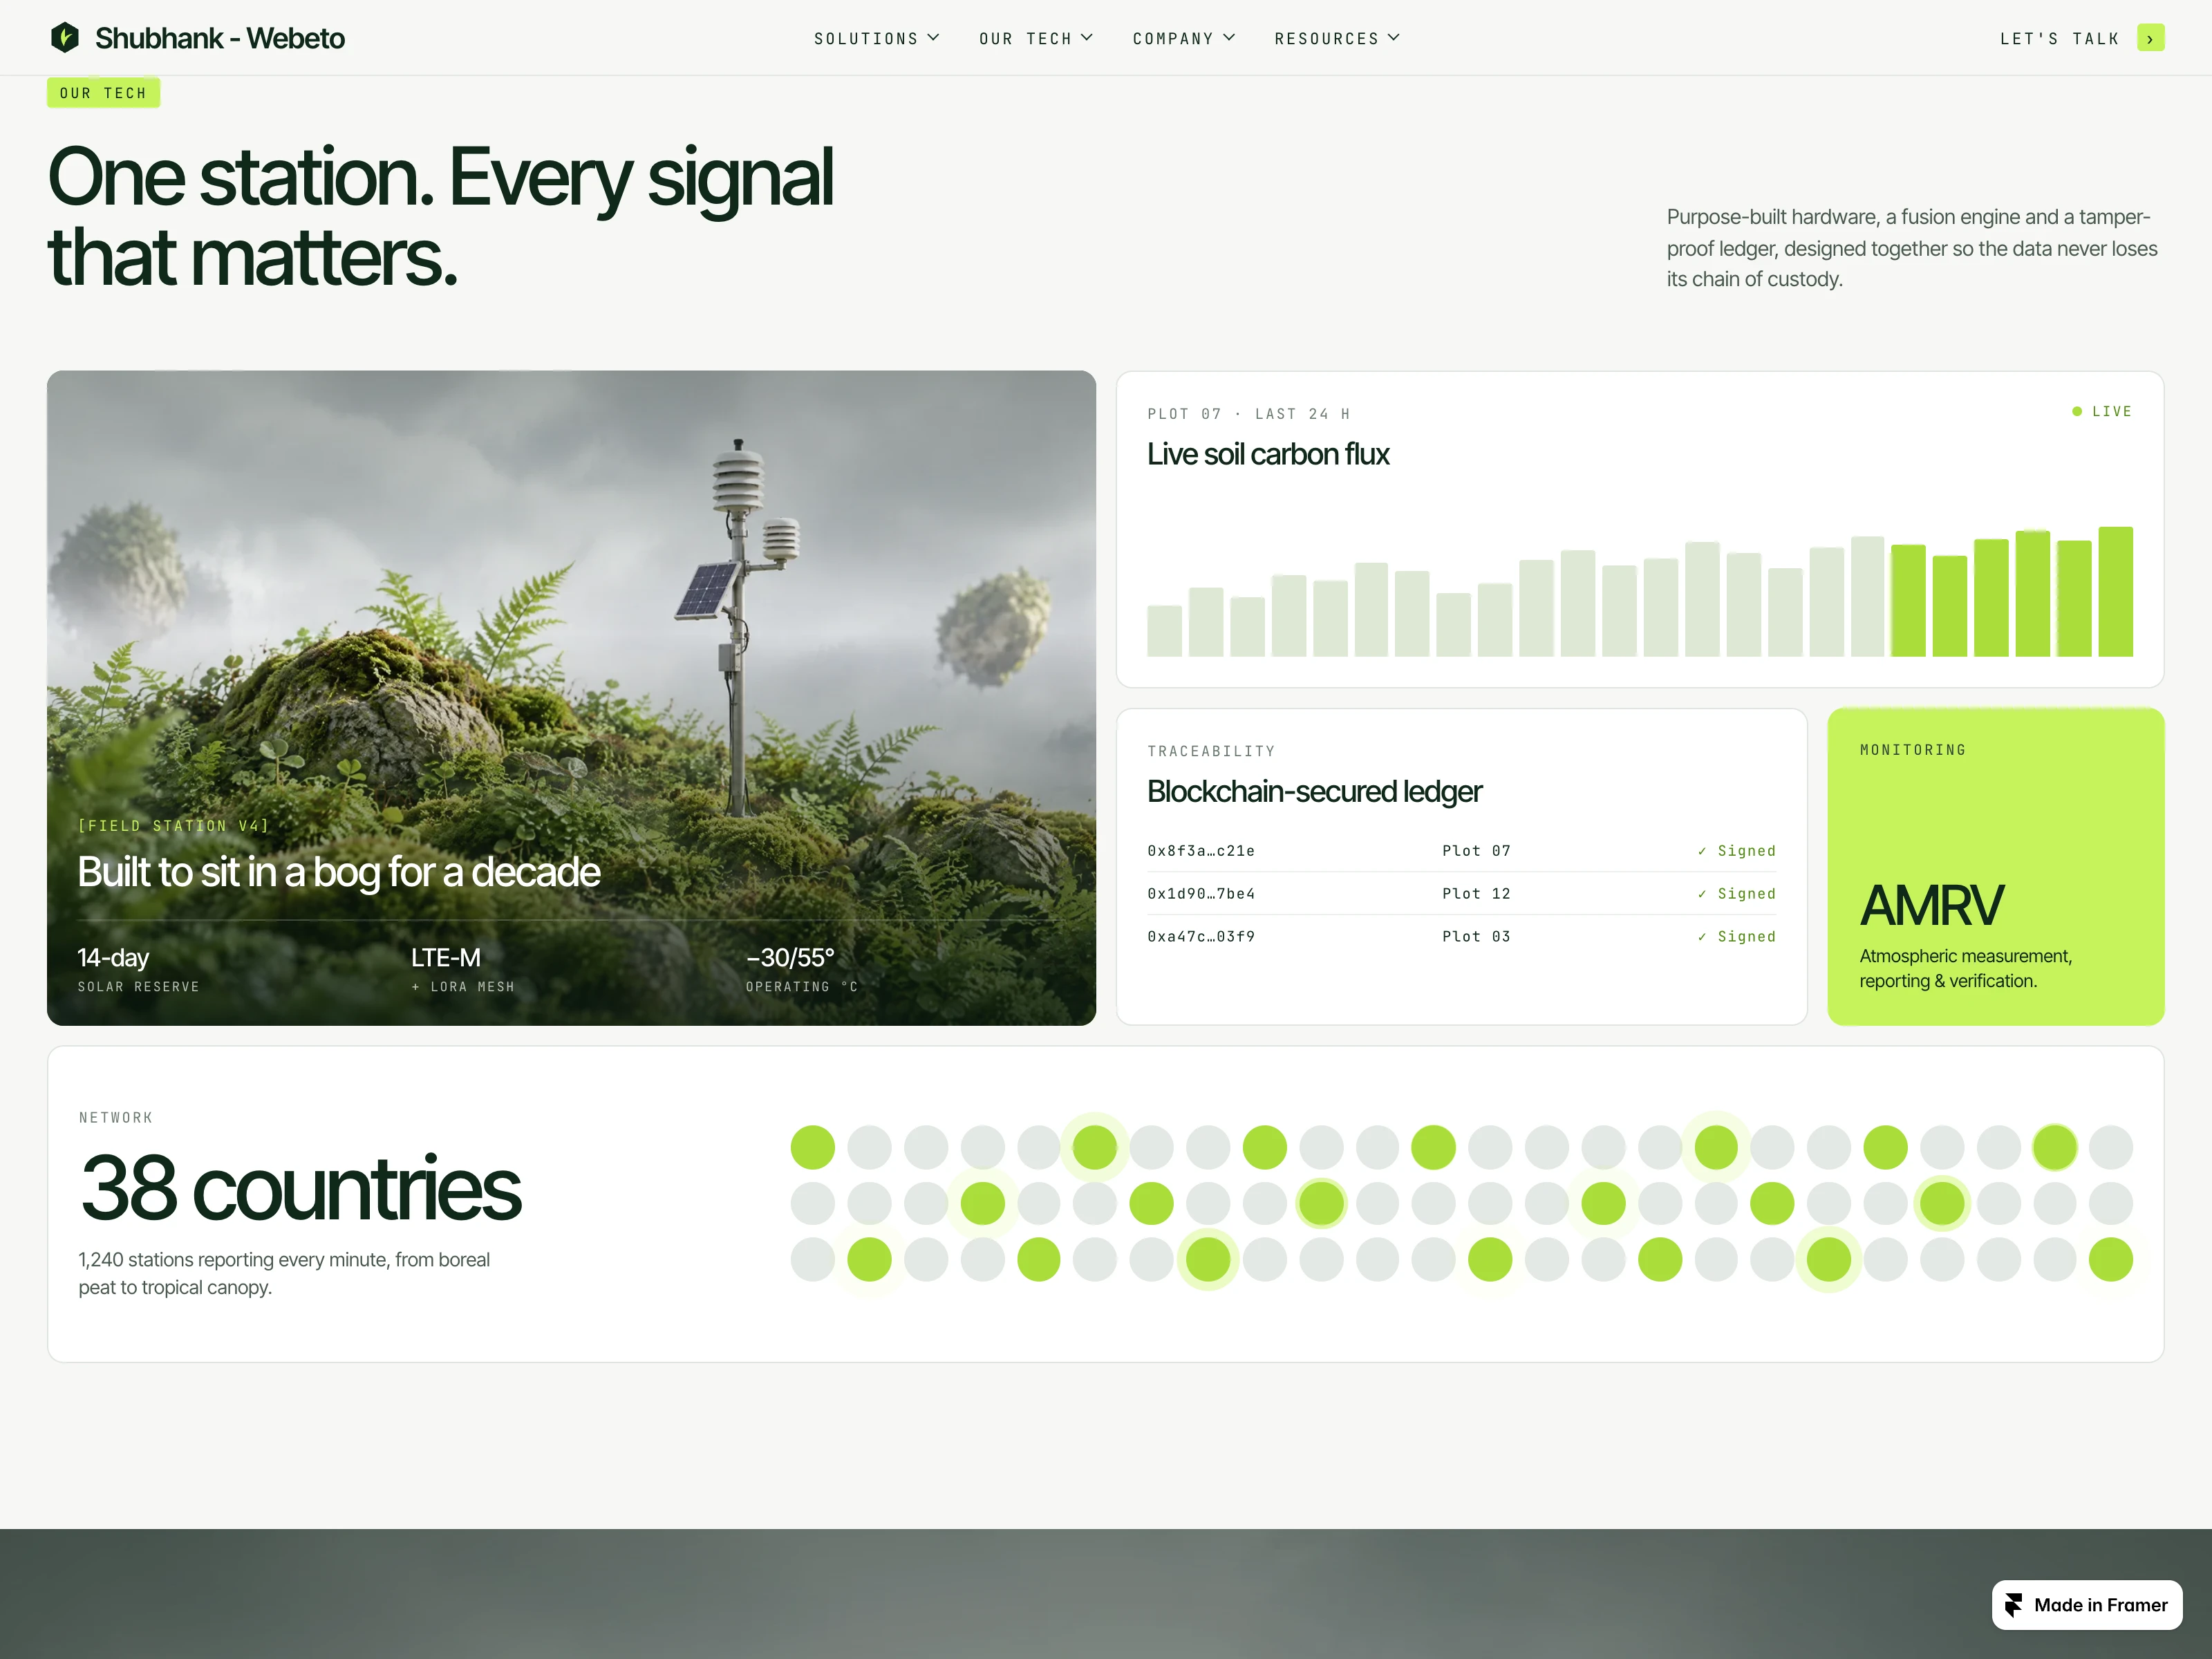
Tech bento section
A bento grid with the field station, a live soil-carbon bar chart, a signed ledger list and a lime AMRV card. Lime is used only for live or verified states.
How it works: Deploy, Measure, Verify, Report
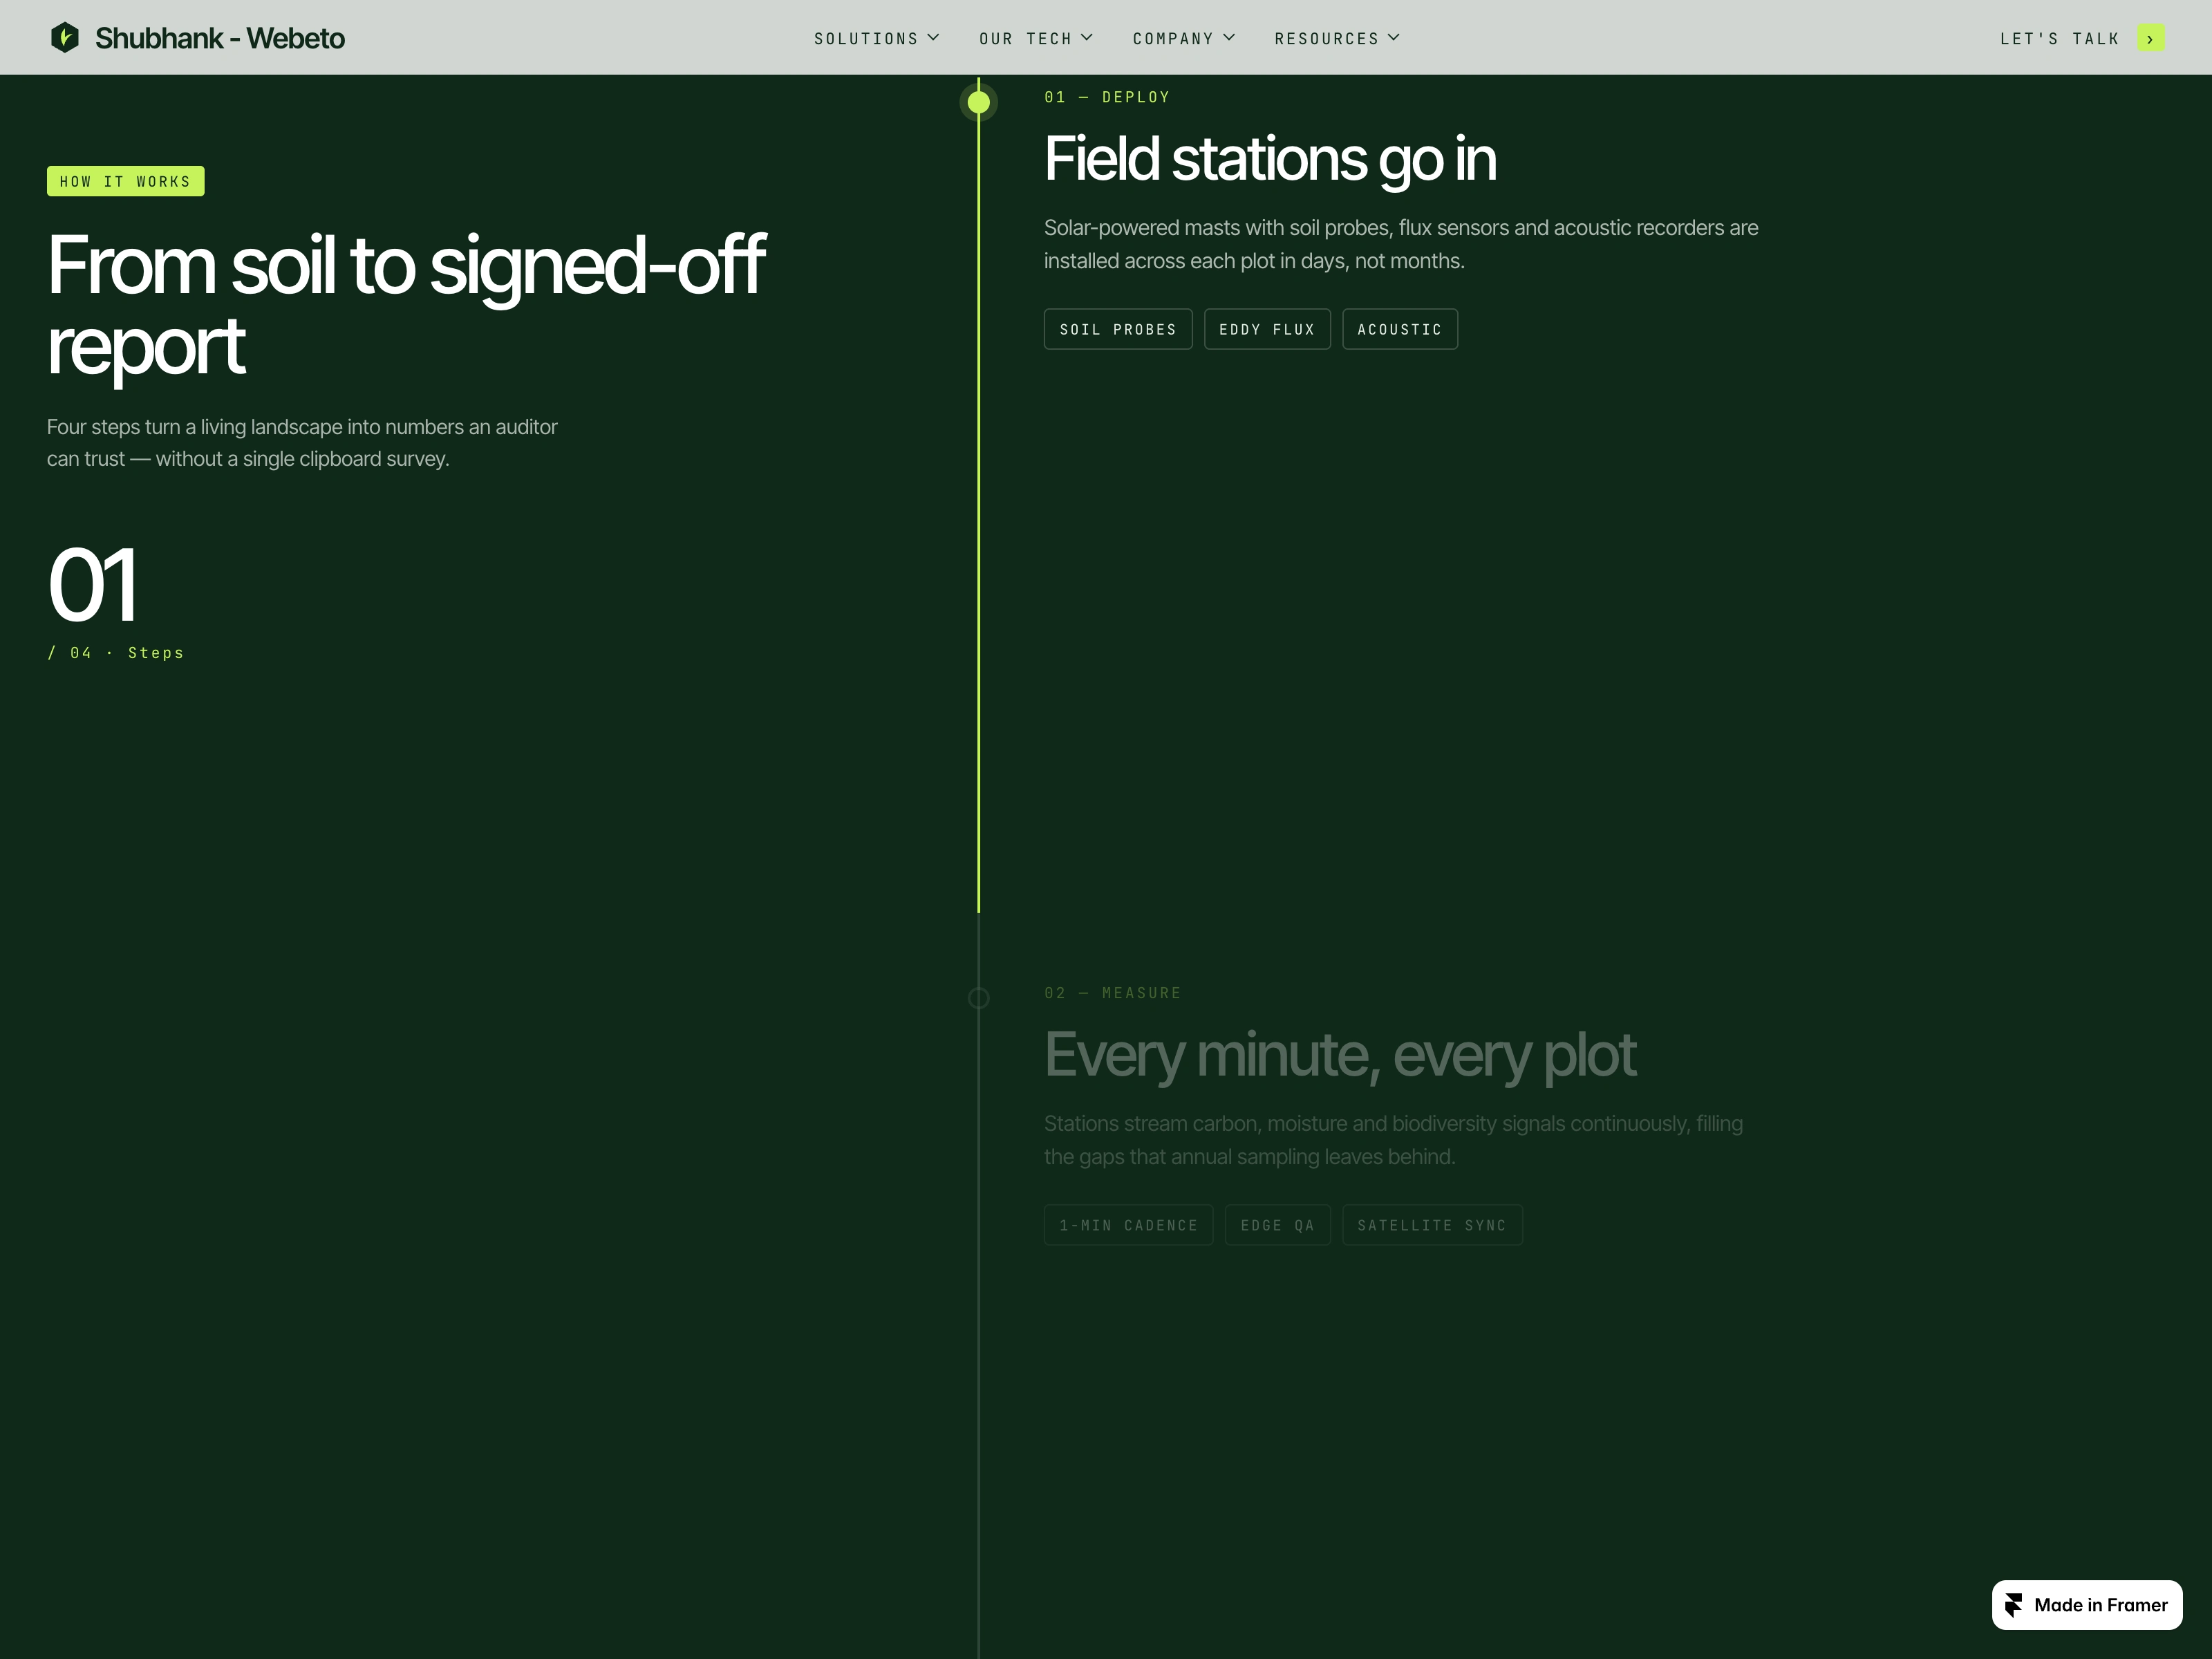
How it works section
A sticky four-step scroll. The step number and a thin progress line keep you oriented while the story moves from field station to signed-off report.
Motion, type and colour
Count-up stats and gentle parallax on the islands, all built with Framer effects and components, no custom code. Tight grotesk headlines, monospace labels for data, forest green and off-white with one lime accent.
Question for you
Would you keep the floating islands on mobile, or swap to a single static image?
1 like · 3 views · Nov 18, 2026
A Framer website concept for a climate-data company that measures carbon and biodiversity in the field: floating-island hero, bento tech, four-step scroll.


