Exploratory Data Analysis on Retail Sales Data
Akieni Wright

Exploratory Data Analysis (EDA) on Retail Sales Data
📅 Date: 22/02/2025 📝 Author: Akieni Wright 📊 Project Type: Data Analysis & Business Intelligence 🔍 Tools Used: MySQL & Power BI
Executive Summary
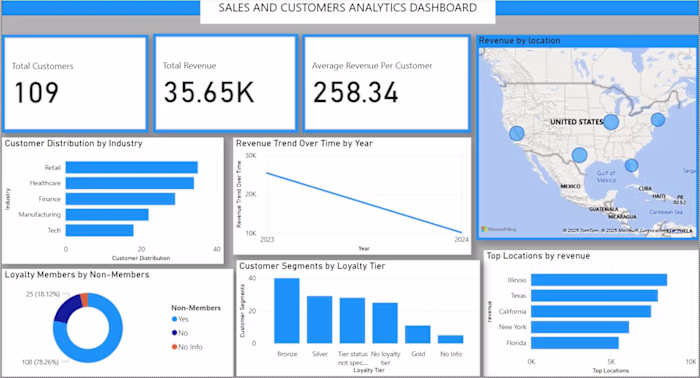
This project analyzes retail sales data to identify sales trends, customer behavior, and profitability across various regions and product categories. Using Python (Pandas, Matplotlib, Seaborn, NumPy, and SciPy), the analysis provides actionable insights to optimize sales strategies and improve profit margins.
📌 Key Questions Answered
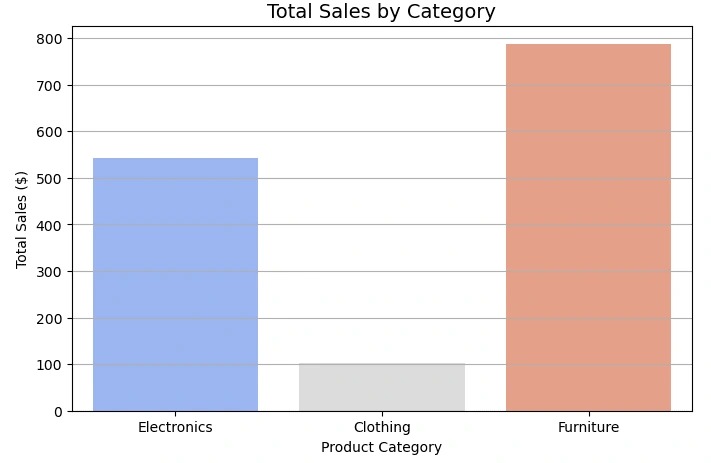
1. Which product categories generate the most revenue?
The analysis showed that furniture had the largest revenue
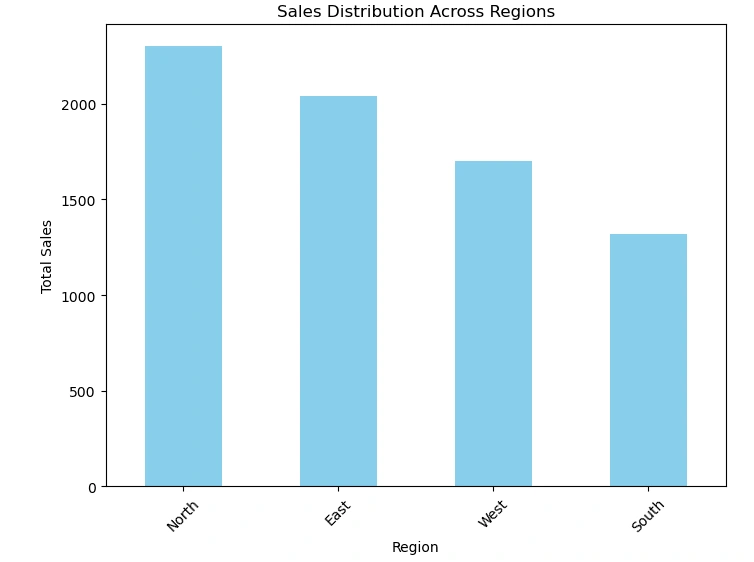
2. Which regions contribute the highest sales volume?
The north was shown the have the highest sales volume
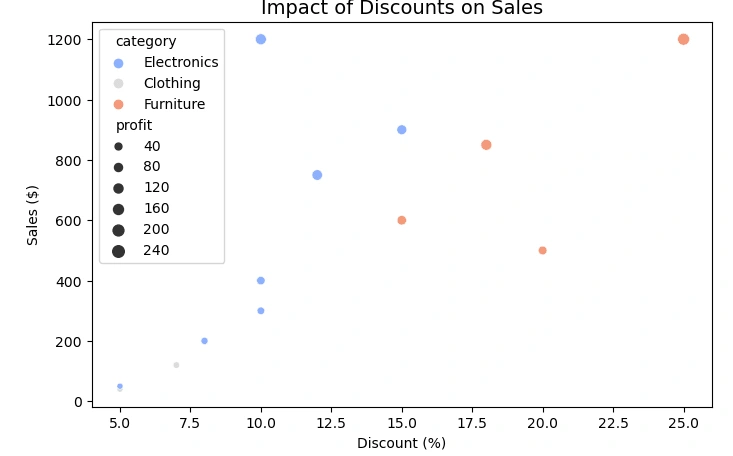
3. How do discounts impact profitability?
The analysis shows that discounts affected electronics the most then furniture and showing that it had little to no effects on clothing.
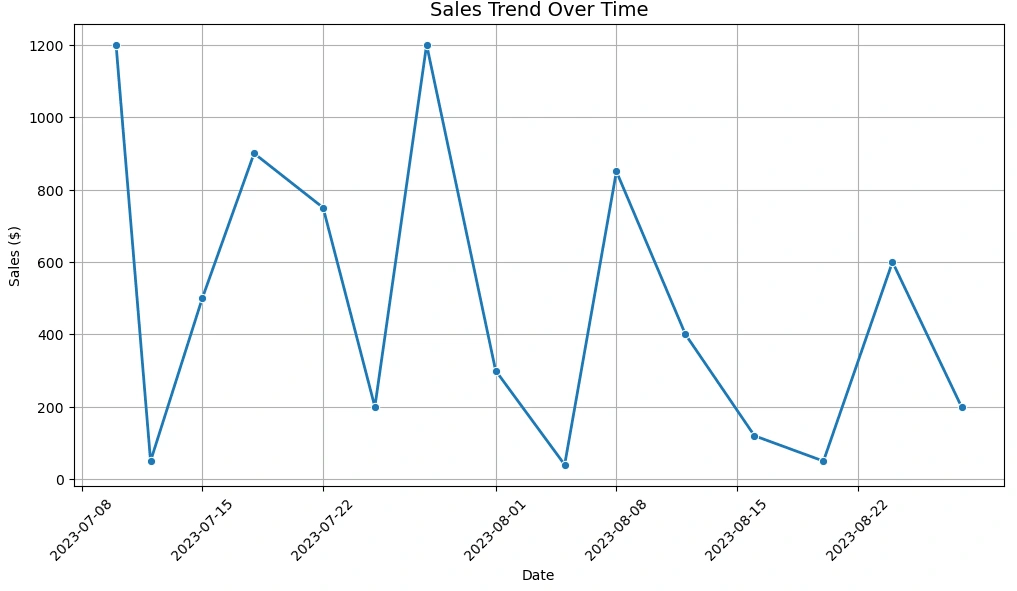
4. Are there any seasonal trends in sales performance?
Our analysis showed that moving from July into August we experienced a decrease in total sales.
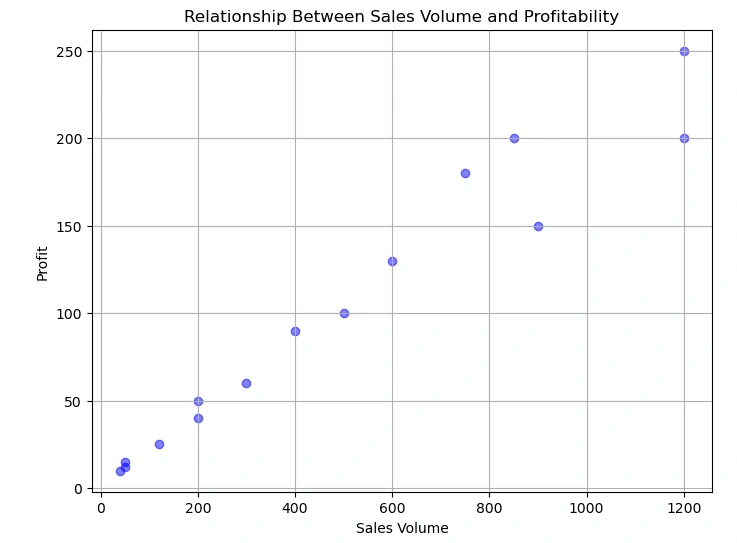
5. What is the relationship between sales volume and profitability?
The analysis shows that there is a linear progression indicating the more sales the higher the profitability.
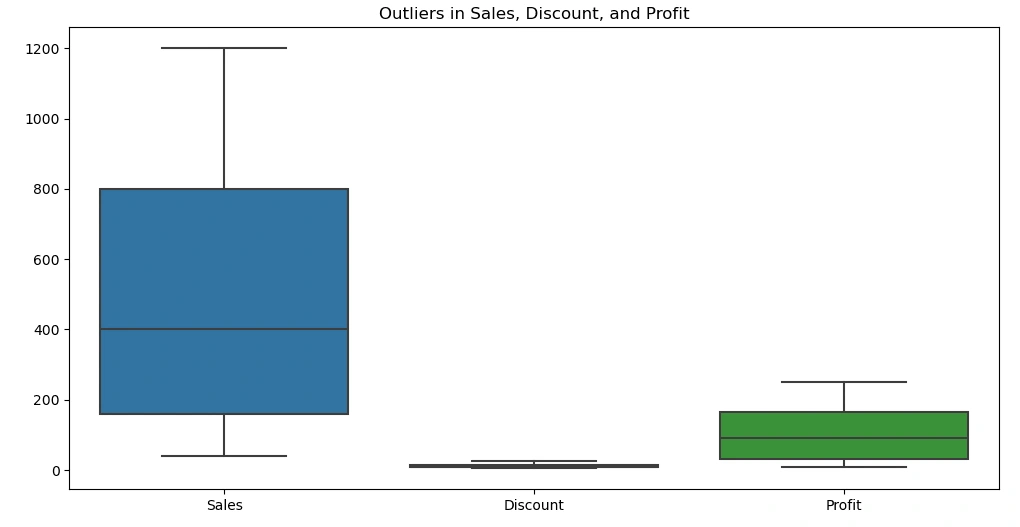
6. Are there any outliers in sales, discount, or profit values?
There were zero outliers in this analysis
7. Do specific product categories have consistently high or low-profit margins?
Category Avg Profit Clothing 25.21
Furniture 21.51
Electronics 20.55
8. What is the distribution of sales across different regions? The sales numbers are as follows:
Region Total Sales
North 2300
East 2040
West 1700
South 1320
Technologies Used
Python (Pandas, NumPy) for data cleaning and manipulation
Matplotlib, Seaborn for data visualization
Conclusion
Top Revenue and Profit Drivers: Furniture emerged as the highest revenue-generating product category, while clothing consistently yielded the highest profit margins. The correlation between sales volume and profitability is strong, indicating that higher sales positively impact profitability.
Regional Performance: The North contributed the highest sales volume, highlighting its significance as a key market. However, disparities exist across regions, with the South showing the lowest sales performance.
Impact of Discounts and Trends: Discounts significantly affected profitability, particularly for electronics and furniture, while clothing showed resilience. Seasonal trends revealed a dip in sales between July and August, suggesting a potential demand fluctuation during this period.
Recommendations
Focus on High Revenue and Profit Drivers: Prioritize marketing and stock availability for furniture to maintain revenue leadership. Additionally, leverage clothing's high profit margins by exploring premium pricing strategies or bundling.
Regional Sales Optimization: Develop targeted strategies to boost sales in the South and capitalize on the North’s strong market presence by introducing region-specific promotions or campaigns.
Manage Discounts Strategically: Reassess discount strategies, particularly for electronics and furniture, to minimize profit erosion. Consider implementing targeted discount offers for underperforming products or regions.
Address Seasonal Trends: Investigate the reasons behind the sales decline in late summer and introduce strategies like promotions or limited time offers to stabilize sales during these periods.
Like this project
Posted Apr 24, 2025
Conducted EDA on retail sales data to identify trends and improve strategies.
Likes
1
Views
14