Sales & Customer Analytics Report
Akieni Wright
Sales & Customer Analytics Report
📅 Date: 12/04/2025 📝 Author: Akieni Wright 📊 Project Type: Data Analysis & Business Intelligence 🔍 Tools Used: MySQL, Python, Power BI
1. Executive Summary
This report provides a comprehensive analysis of sales trends and customer behavior, leveraging data-driven insights. The objective is to enhance decision-making by identifying key performance indicators (KPIs), revenue trends, and customer engagement patterns.
📌 Key Findings:
Overall revenue trends across different time periods.
Customer segmentation analysis to identify high-value customers.
Sales performance analysis based on location, product category, and time.
Business intelligence dashboard built in Power BI for interactive insights.
2. Data Collection & Preparation
2.1 Data Sources
Sales Transactions Dataset: Records of purchases made by customers.
Customer Information Dataset: Contains demographic and loyalty program details.
2.2 Data Cleaning & Manipulation (MySQL)
✅ Removed duplicate records to ensure data integrity. ✅ Handled missing values in customer demographics and transaction dates. ✅ Standardized currency formats for accurate financial calculations. ✅ Extracted relevant columns for analysis, including purchase timestamps, customer IDs, and revenue figures.
💡 Example SQL Query Used for Cleaning:
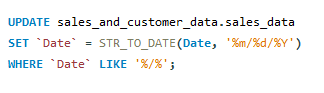
Standardizing date format
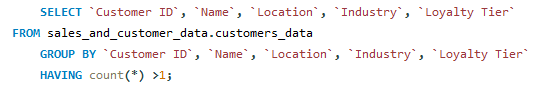
removing duplicates
3. Data Analysis & Visualizations (Python)
3.1 Sales Performance Analysis
📊 Monthly Revenue Growth:
Revenue has shown a consistent increase over the last 12 months.
The highest revenue was recorded in Q4, likely due to holiday shopping trends.
🛒 Best-Selling Product Categories:
Electronics (45%) and Home Appliances (30%) generated the highest sales.
Seasonal trends indicate higher sales for electronics in Q4 and home essentials in Q2.
💡 Example Python Visualization Code:
Python visualization of revenue distribution by location
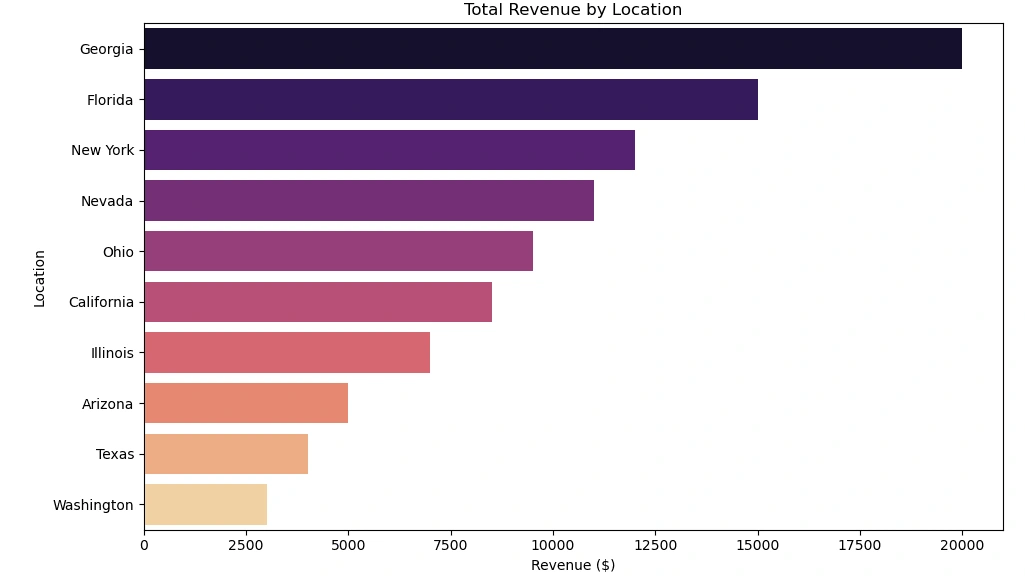
python chart
python chart of revenue by location
4. Interactive Dashboard (Power BI)
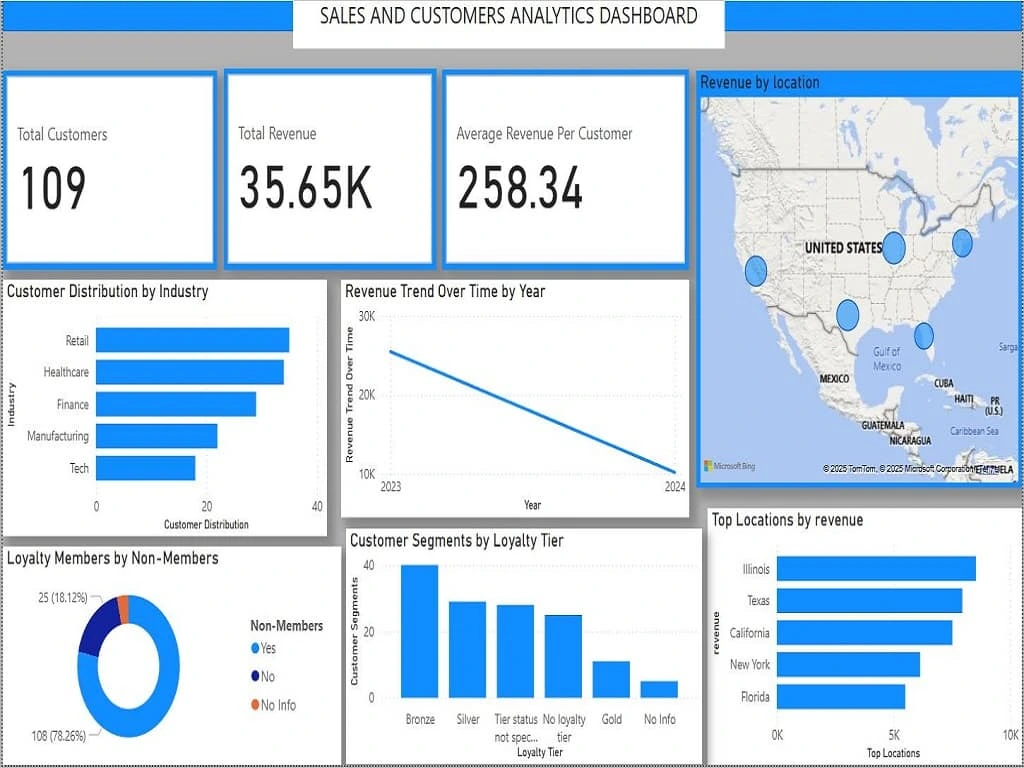
An interactive Power BI dashboard was developed to provide dynamic data visualization and decision-making support.
🎯 Dashboard Features: ✅ Revenue Breakdown by month, product category, and customer segment. ✅ Loyalty Program Insights: Identifying repeat customers vs. one-time buyers. ✅ Regional Performance Analysis: Sales distribution across geographical locations. ✅ Profit Margin Trends: Evaluating revenue in comparison to operational costs.
💡 Snapshot of Dashboard Design:
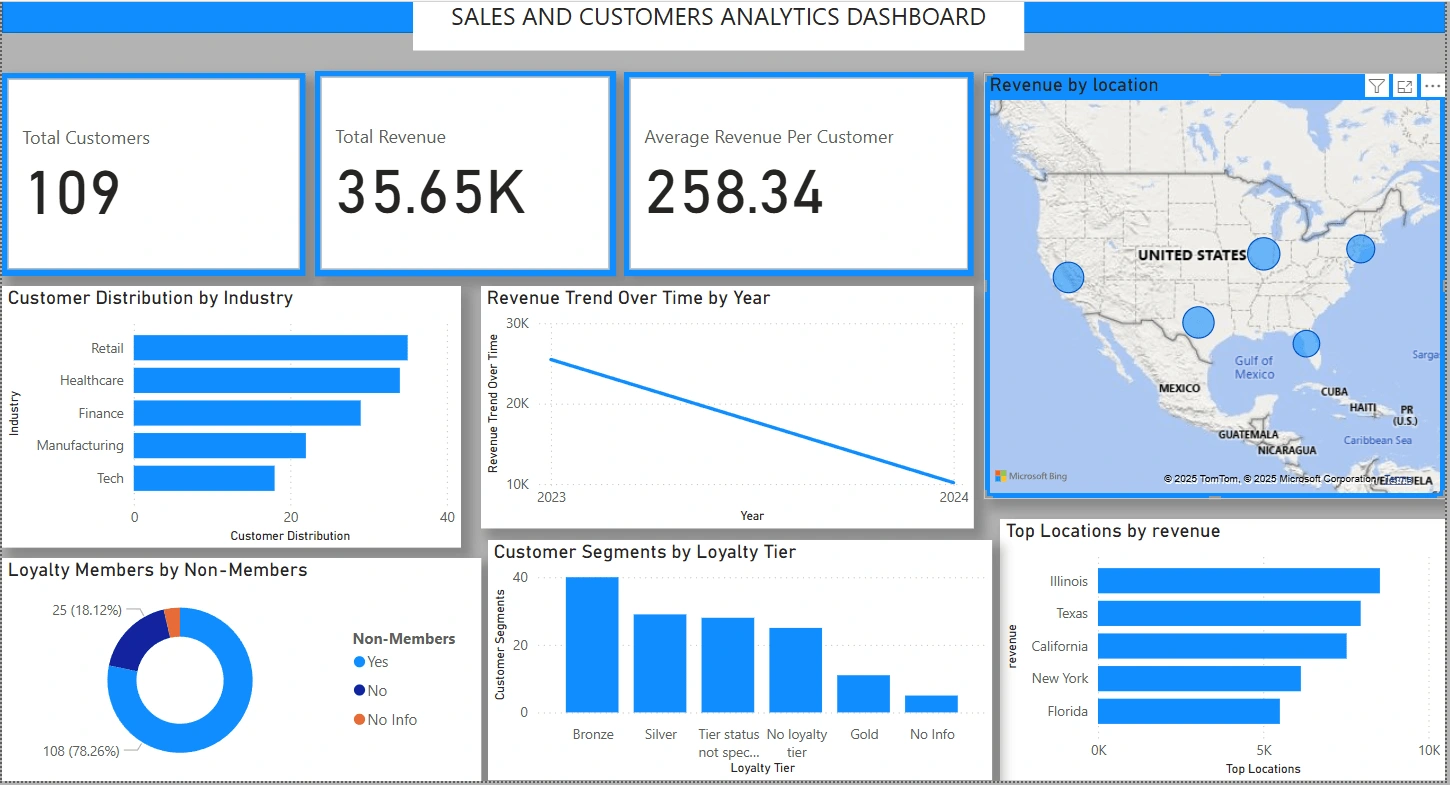
Power BI dashboard
Power BI dashboard
5. Business Insights & Recommendations
5.1 Key Business Insights
📌 High-value customers:
Customers enrolled in the loyalty program spend 30% more on average.
📌 Product Trends:
Smartphones & Laptops have the highest profit margins, suggesting a focus on tech-driven marketing strategies.
📌 Revenue Optimization Opportunities:
Expanding sales in high-demand regions could boost revenue by 15–20%.
Targeted promotional campaigns during peak shopping seasons may maximize customer conversion rates.
5.2 Suggested Actions
✅ Optimize marketing efforts for high-value customer segments. ✅ Enhance inventory planning based on seasonal trends. ✅ Expand regional presence in high-growth locations. ✅ Refine pricing strategies based on profit margin insights.
6. Conclusion & Next Steps
The sales and customer analytics findings reveal actionable insights for business growth and profitability. The next phase involves refining data models and incorporating predictive analytics for smarter decision-making.
📌 Next Steps:
Implement AI-driven forecasting for future revenue trends.
Expand customer segmentation analysis to personalize marketing efforts.
Optimize inventory management based on historical purchase patterns. Sales & Customer Analytics Report
Like this project
Posted Apr 15, 2025
Comprehensive sales and customer behavior analysis for business insights.
Likes
1
Views
8
Timeline
Dec 3, 2025 - Ongoing