Sales and Performance Analysis
Guinevere Tavares
I recently worked on a Sales and Performance Analysis project for a real estate client who needed better insights into their property sales data. They were having trouble identifying trends and understanding which properties were performing well because their data was scattered across multiple spreadsheets and wasn’t being analyzed effectively.
To help them, I consolidated all their sales data into a single, organized Excel file and used advanced techniques like pivot tables and VLOOKUP to analyze the data. This allowed the client to easily track sales performance by property type, location, and time period. They could now quickly see which properties were selling the fastest, which areas were the most profitable, and where they needed to focus their marketing efforts.
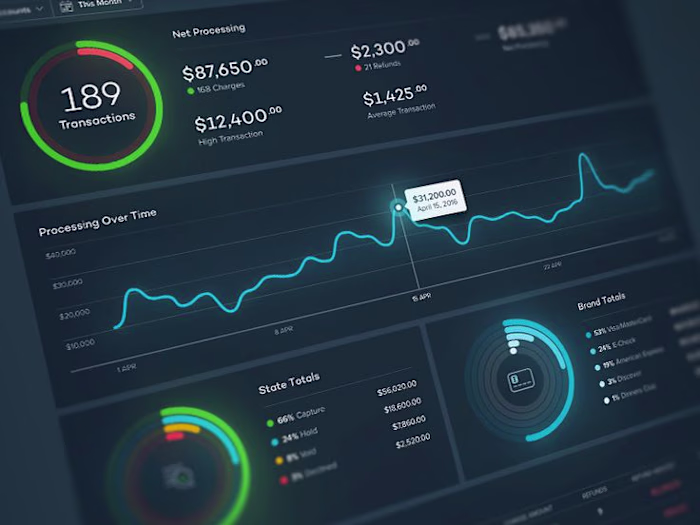
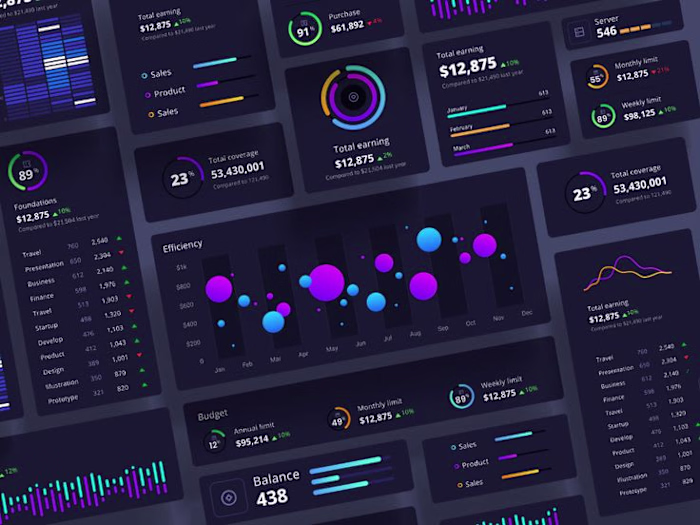
One of the biggest advantages the client gained was clear visibility into their sales trends. I created interactive dashboards that displayed key metrics, such as average selling price, time on market, and sales volume. These dashboards made it easy for the client to spot trends and make data-driven decisions, improving their overall sales strategy.
Another key deliverable was the monthly performance report template I designed. This template automated the generation of detailed reports, saving the client hours of manual work each month. Now, they could just input new data, and the report would update automatically, providing fresh insights at a glance.
The three key deliverables were:
Consolidated Sales Data File: A single, organized Excel file combining all property sales data for easy analysis.
Interactive Sales Dashboard: A dynamic dashboard with pivot tables and charts for real-time tracking of sales performance and trends.
Automated Monthly Report Template: A template that generates comprehensive sales performance reports with minimal effort, saving time and improving accuracy.
By the end of the project, the client had a powerful toolset that streamlined their sales analysis, helping them to optimize their marketing efforts and increase profitability.
Like this project
Posted Aug 24, 2024
Streamlined real estate sales analysis by consolidating data and creating an interactive dashboard—helping the client identify trends and boost profitability.
Likes
0
Views
18