India as a Blueprint for a Vegan World
Mayank Munjal
India's rich cultural landscape fosters a surprisingly high prevalence of vegetarianism. This, combined with an abundance of naturally vegan dishes, positions the country as a prime example for exploring a plant-based future. This project examines India's culinary heritage, focusing on vegan options and exploring easy substitutions.
Process
1. Concept Development:
Research and Inspiration: The project began by delving into the existing research on veganism in India, exploring cultural and religious factors that contribute to vegetarianism. Additionally, research into global vegan trends and challenges informed the project's focus.
Defining the Question: The central question driving the project was: "Can India Serve as The Blueprint for a Vegan World?"
Data Source Identification: Identifying relevant datasets was crucial. This involved finding resources that captured recipe details, cuisine types, and dietary classifications, specifically for both global and Indian cuisine.
2. Data Acquisition and Preparation:
The project utilized two datasets: a global cuisine dataset and a specifically curated Indian cuisine dataset.
1. Global Cuisine Dataset: The dataset, featured in a Kaggle playground competition titled "What's Cooking?", includes a training set (train.json) and a test set (test.json). The training set contains recipe IDs, types of cuisine, and lists of ingredients, while the test set includes recipe IDs and lists of ingredients.
2. Indian Cuisine Dataset: The data sources for this dataset include Wikipedia, Hebbar's Kitchen, and Archana's Kitchen. The dataset includes columns for the name of the dish, ingredients, type of diet (vegetarian or non-vegetarian), course (e.g., starter, main course, dessert), state of origin, and region.
3. Data Analysis:
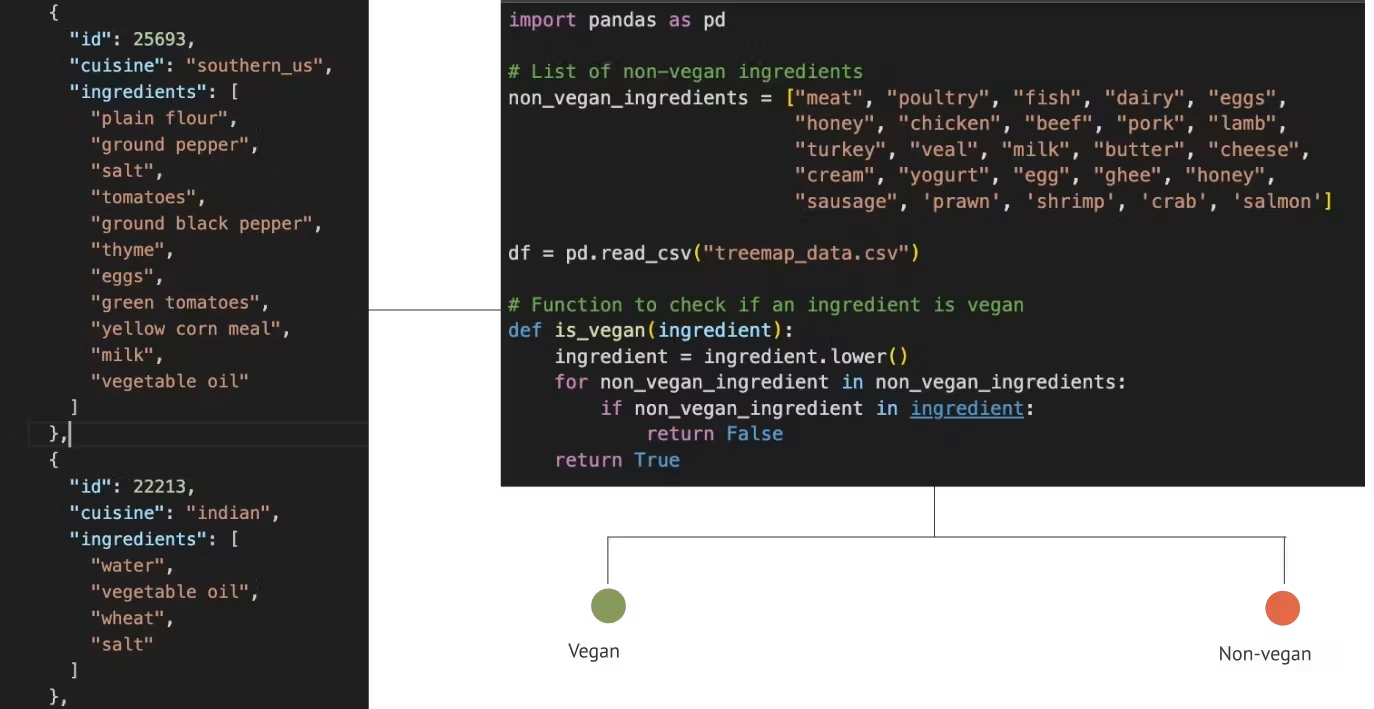
To test the hypothesis that Indian cuisine can serve as a blueprint for global veganism, the dataset of over 40,000 recipes was explored, and a sample of at least 800 recipes for several popular cuisines was taken. This sampling approach ensured that each cuisine was well represented while managing computational resources effectively.
Next, each recipe was classified as either vegan or non-vegan by identifying and filtering out non-vegan ingredients such as milk, meat, and butter.
Tools Used:
Python, D3, JavaScript
Design and Visualization
1. User Research:
The next step involved selecting the most impactful data visualizations to communicate the key findings. The following questions were considered to develop the wireframes and intitial prototype:
Who is the person, demographic, or processional group you are designing for. What do they know about your project already?
How is your audience reading your project. In what situation, modality, through which distribution channel, and in what context?
What does your project ask of your audience, what do they need to do (input, interact, act)?
What does your audience take away, instantly, after 1min, 5min of engagement?
Tools Used:
Figma, Flourish, Excel, Python, D3
2. Design Refinement:
Initial data visualizations were refined based on feedback and considerations like clarity, visual hierarchy, and audience understanding.
As the visualizations took shape, the overall narrative of the project was further refined. This involved crafting a clear message about India's potential as a vegan blueprint and the key takeaways from the data analysis.
By following these steps, the project transformed a raw data exploration into a visually compelling case study that highlights India's unique position in the global vegan movement.
Like this project
Posted May 29, 2025
Explored India's culinary heritage for vegan options, using data analysis and visualization tools.