Designing a Smarter Financial Dashboard for a Utility Company
Portfolio project

Introduction 🚀
Utility Group is a local company specializing in the provision and management of essential utility services, ensuring reliable delivery of energy, water, and other vital resources. Through modern technologies and efficient processes, the company aims to optimize operational monitoring and enhance financial reporting, enabling faster, data-driven decisions for sustainable resource management.
👉 View full case study here: https://bit.ly/3Q94x2z
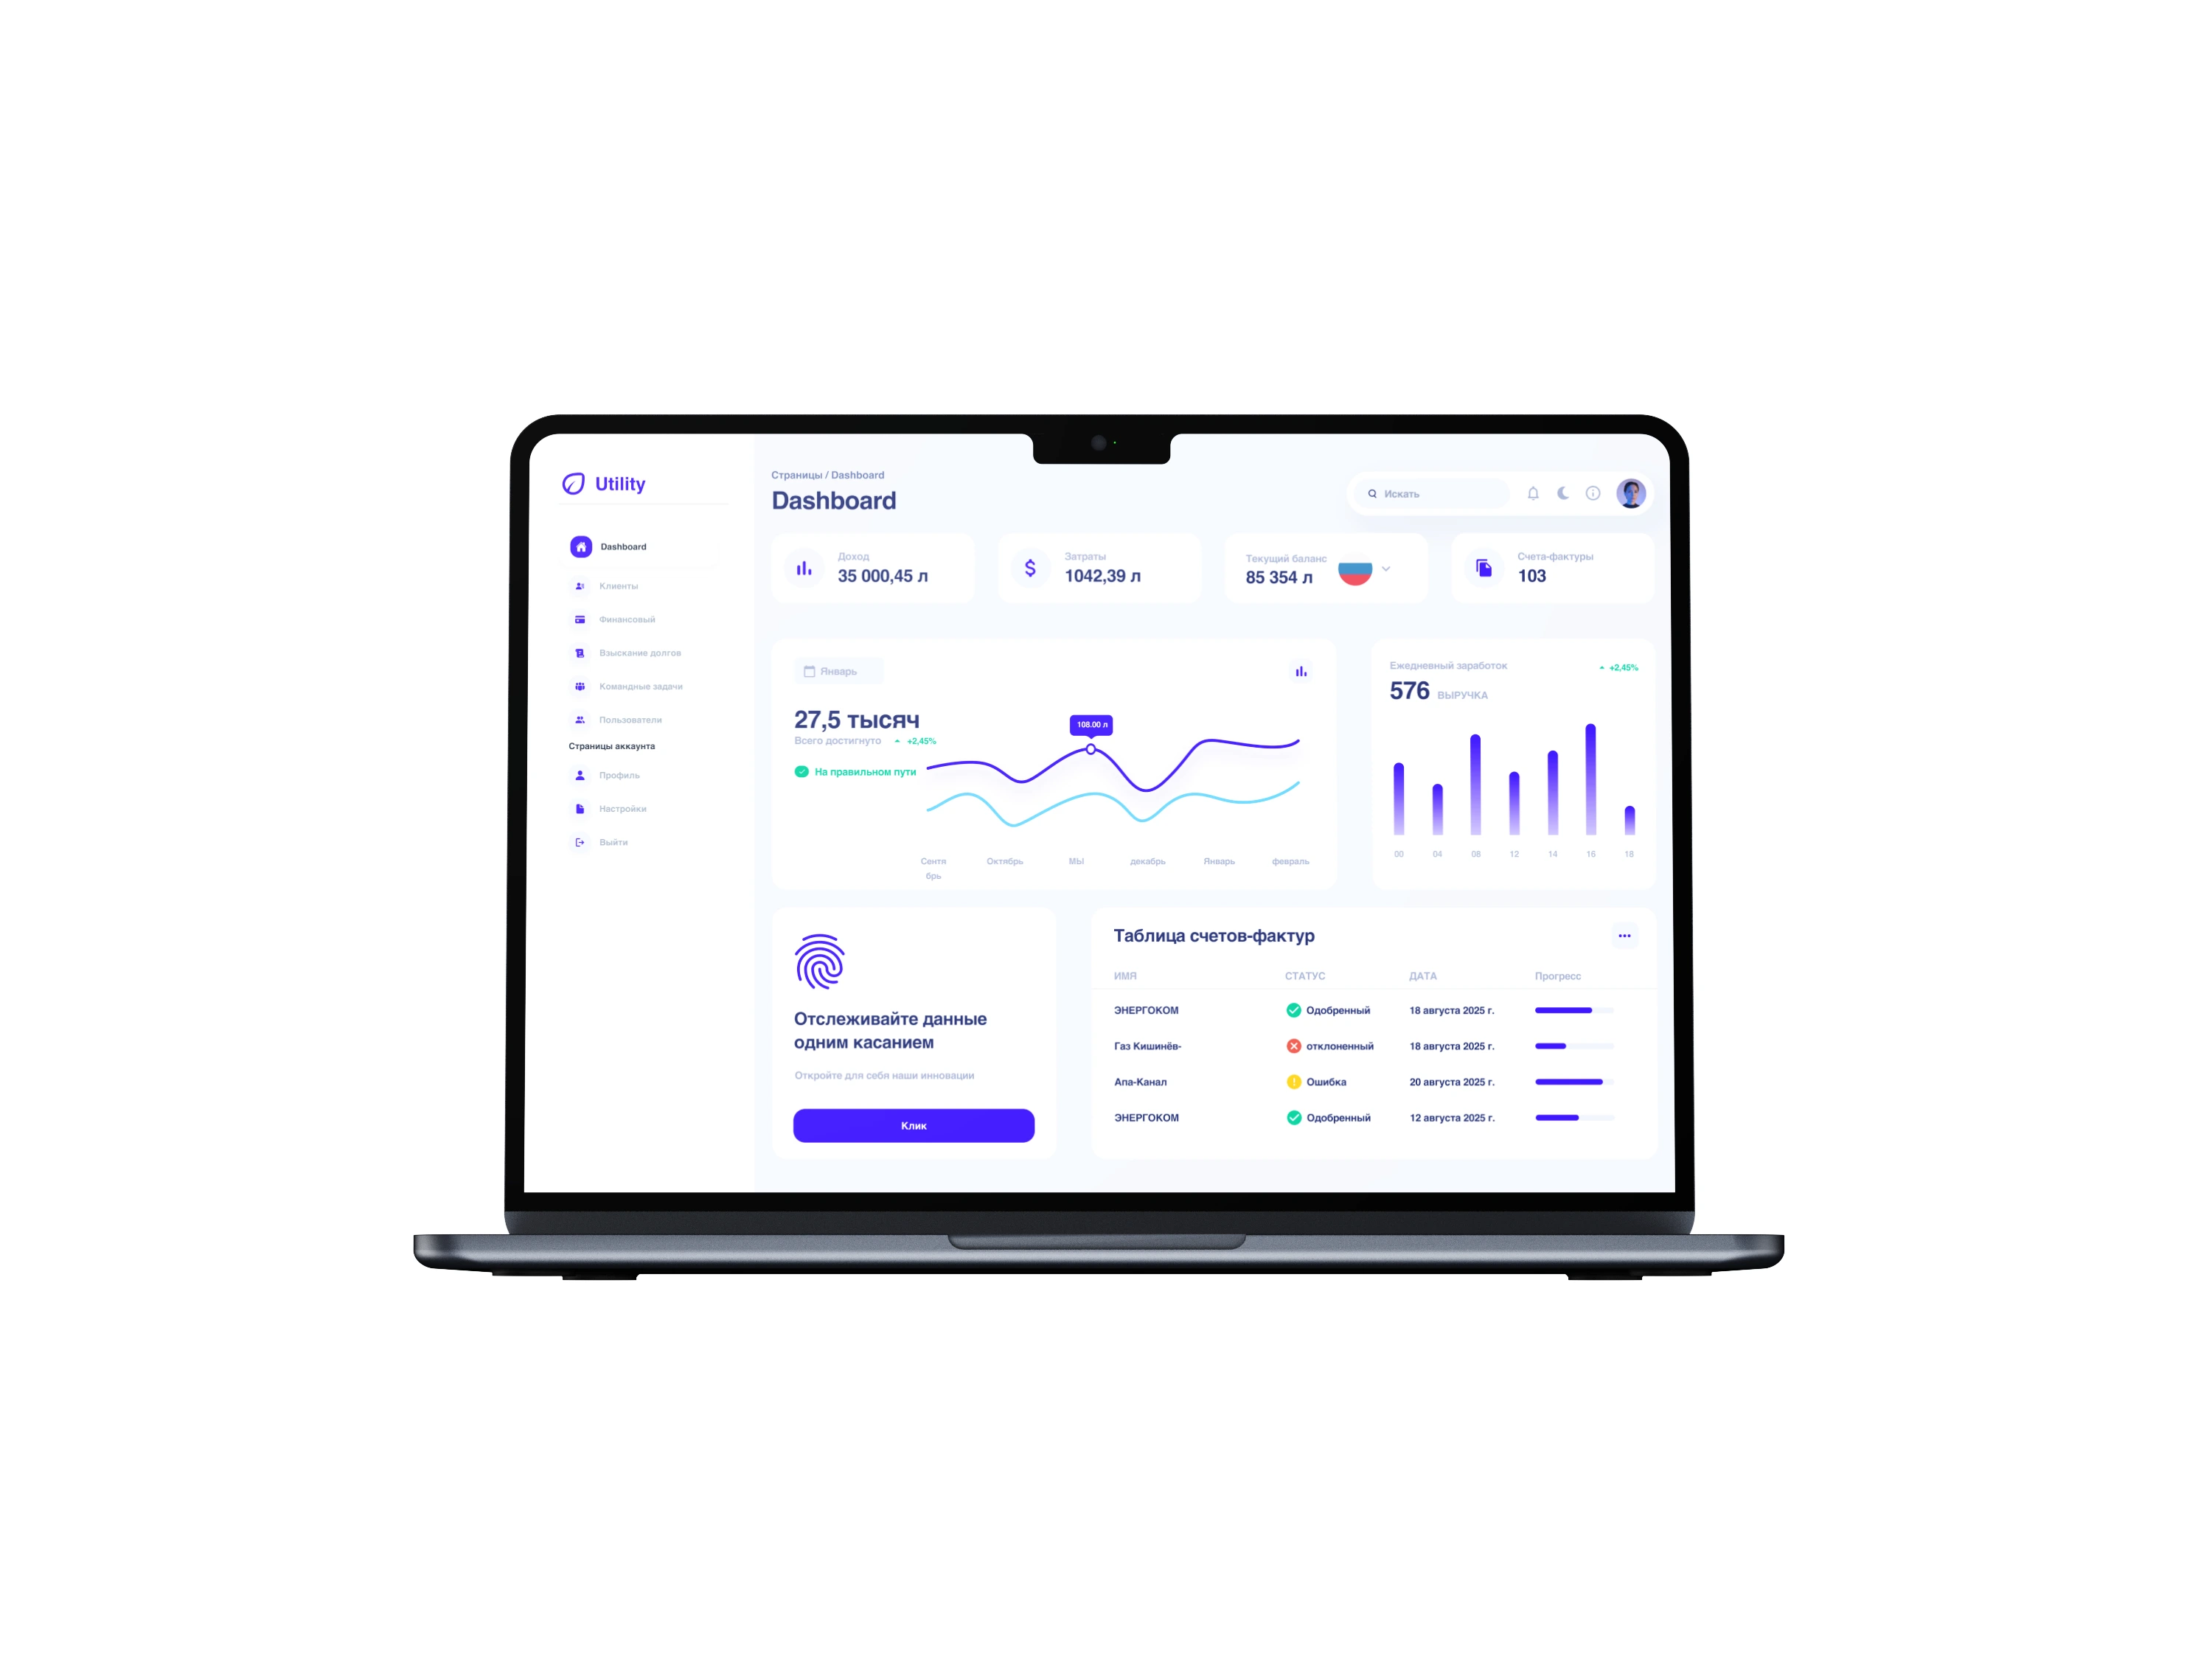
Introduction 🚀
Utility Group is a local company specializing in the provision and management of essential utility services, ensuring reliable delivery of energy, water, and other vital resources. Through modern technologies and efficient processes, the company aims to optimize operational monitoring and enhance financial reporting, enabling faster, data-driven decisions for sustainable resource management.
Problem ⚠️
The Utility Group lacked a centralized and efficient method for visualizing and tracking its key financial indicators. Reports were generated manually from multiple sources, making it difficult for management to have a real-time overview of revenues, expenses, and outstanding payments. This led to slower decision-making and reduced operational efficiency.
Goal 🎯
The goal was to provide management with clear, actionable insights into revenues, expenses, and outstanding payments, ultimately improving operational efficiency and supporting faster, data-driven decision-making
My role 🧑💼
In this project, I worked as the UX/UI Designer. I was responsible for analyzing the company’s internal workflows, identifying user needs, and defining the information architecture for the financial dashboard. My tasks included creating wireframes, designing a clean and intuitive UI, and preparing a style guide to ensure visual consistency. I also developed interactive prototypes and collaborated closely with the development team during the handoff process to ensure accurate implementation.
My Process 🔄
My design process for this project began with researching the company’s reporting workflows and identifying key pain points. I then defined the information architecture and created wireframes to map out the layout. Once validated, I designed a clean, data-focused UI and built an interactive prototype for feedback. Finally, I prepared a style guide and collaborated with the development team to ensure a smooth and consistent implementation.
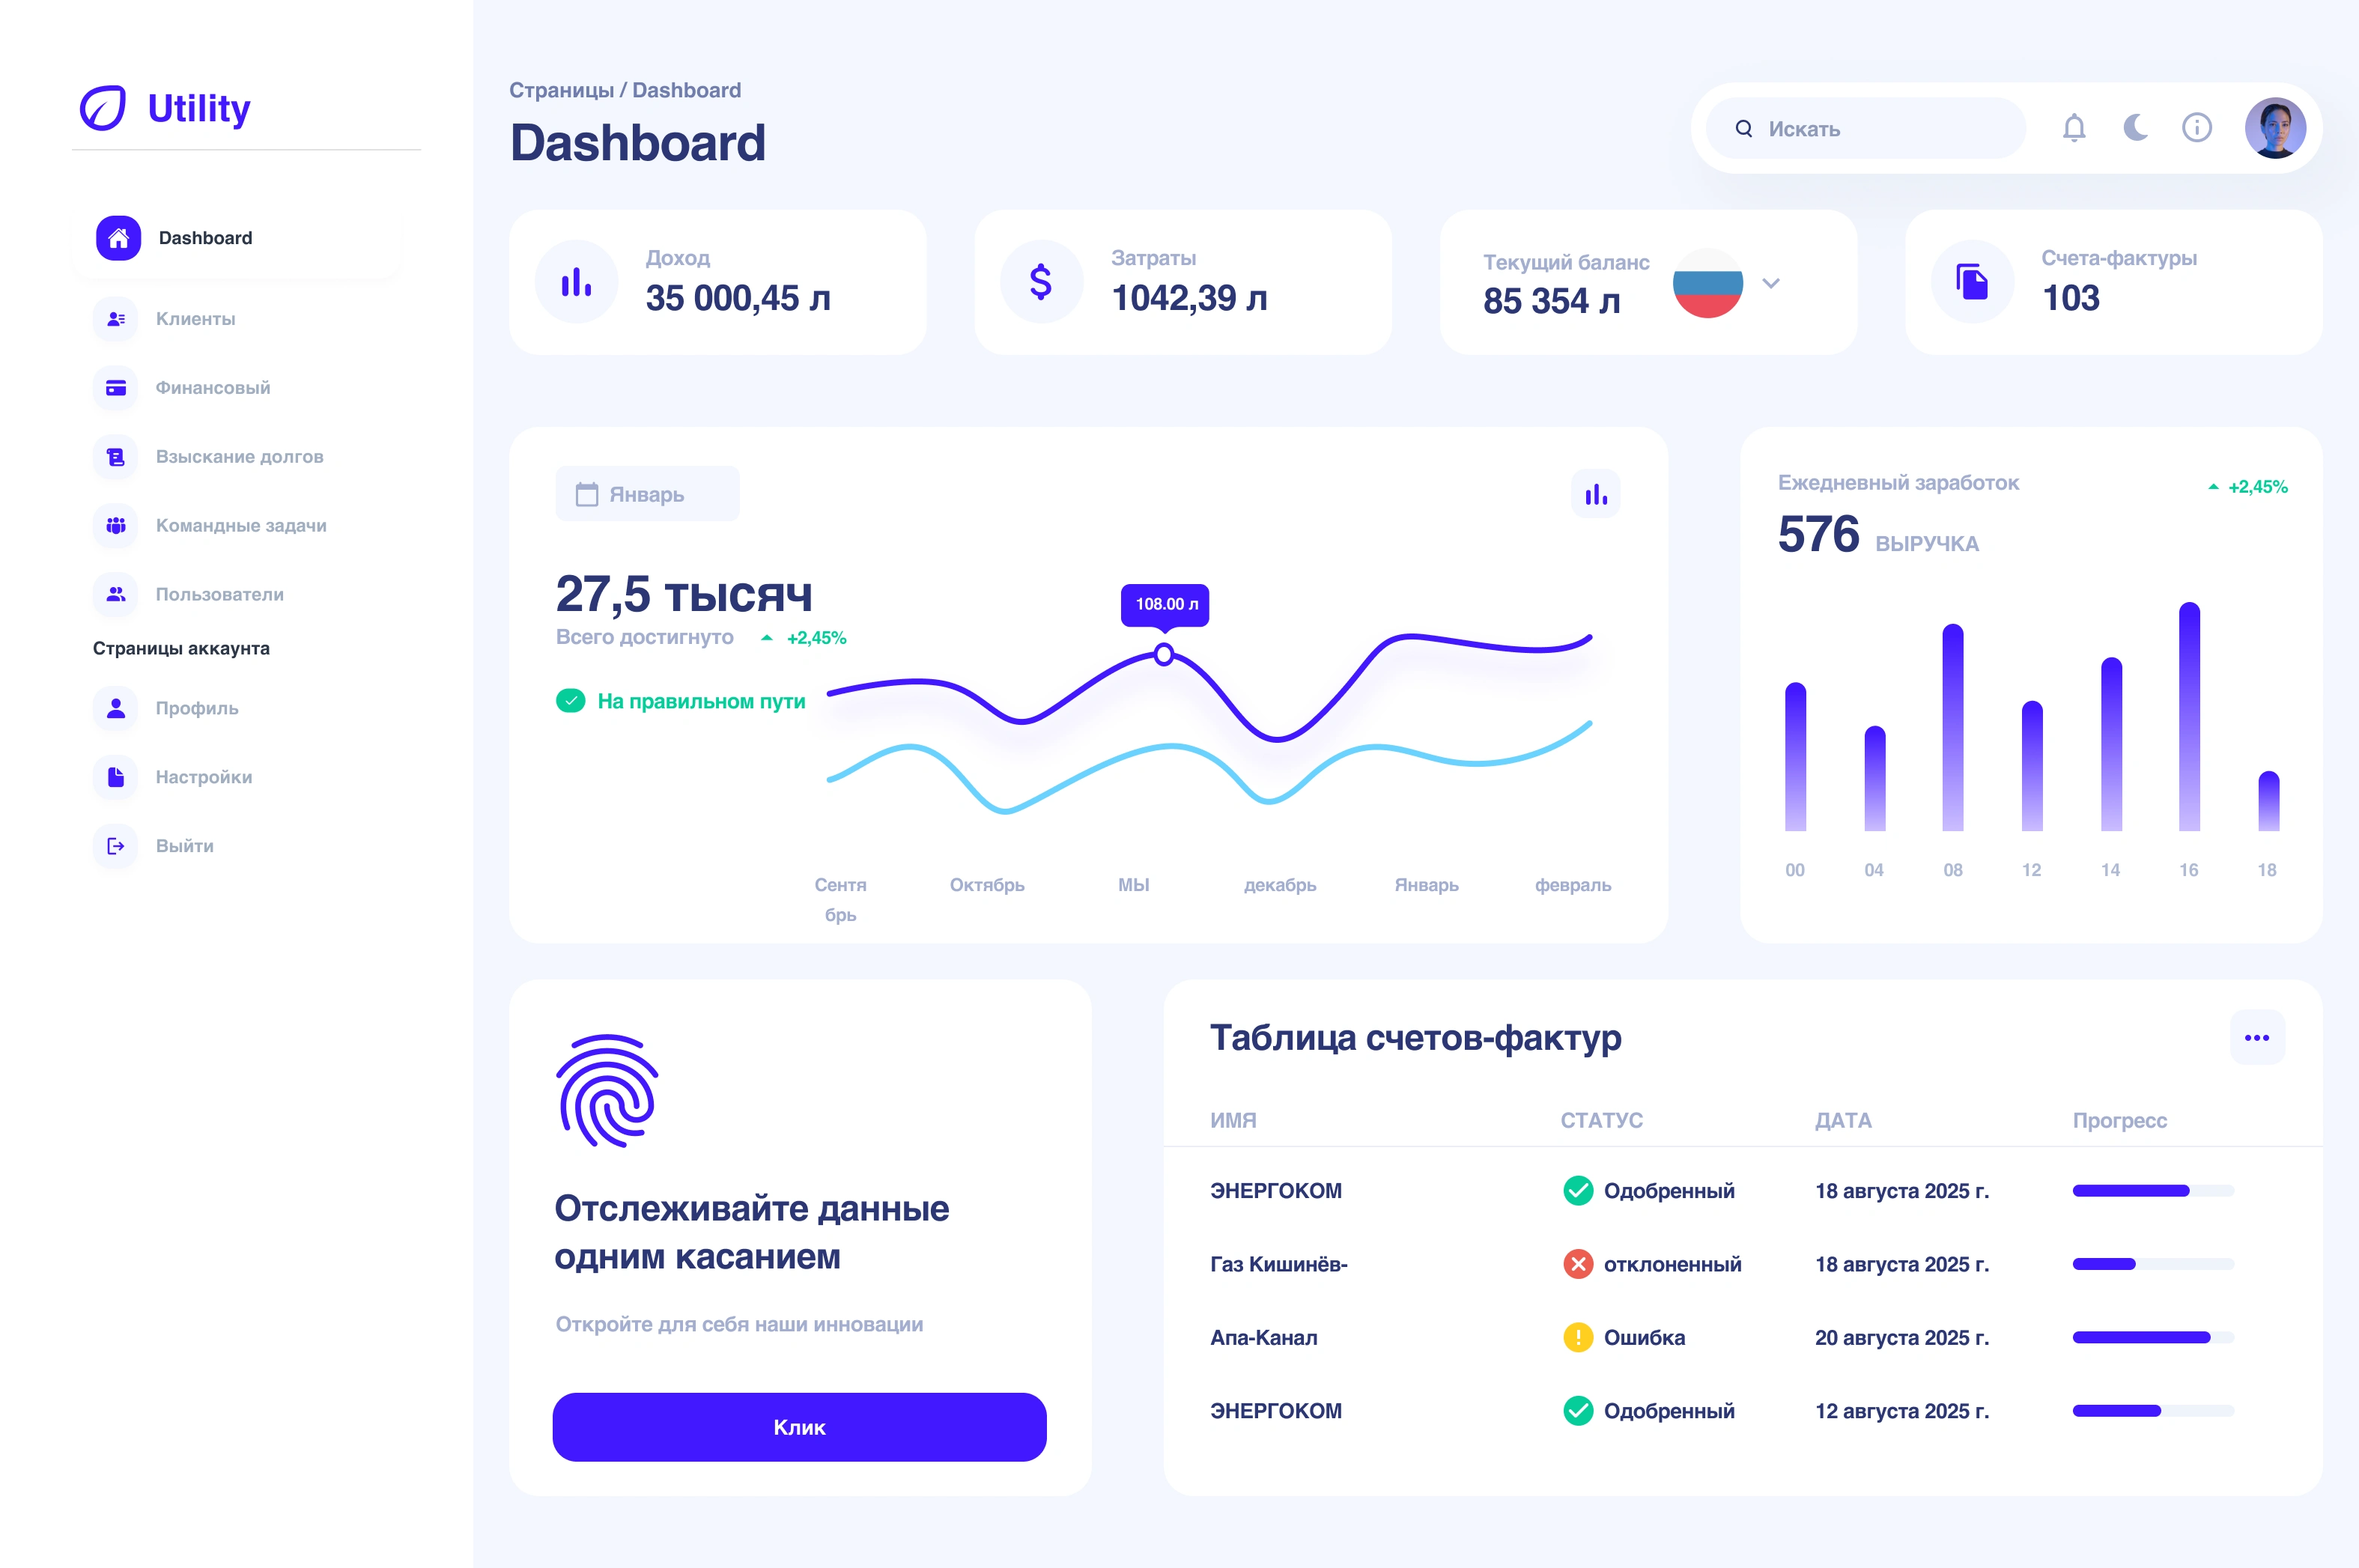
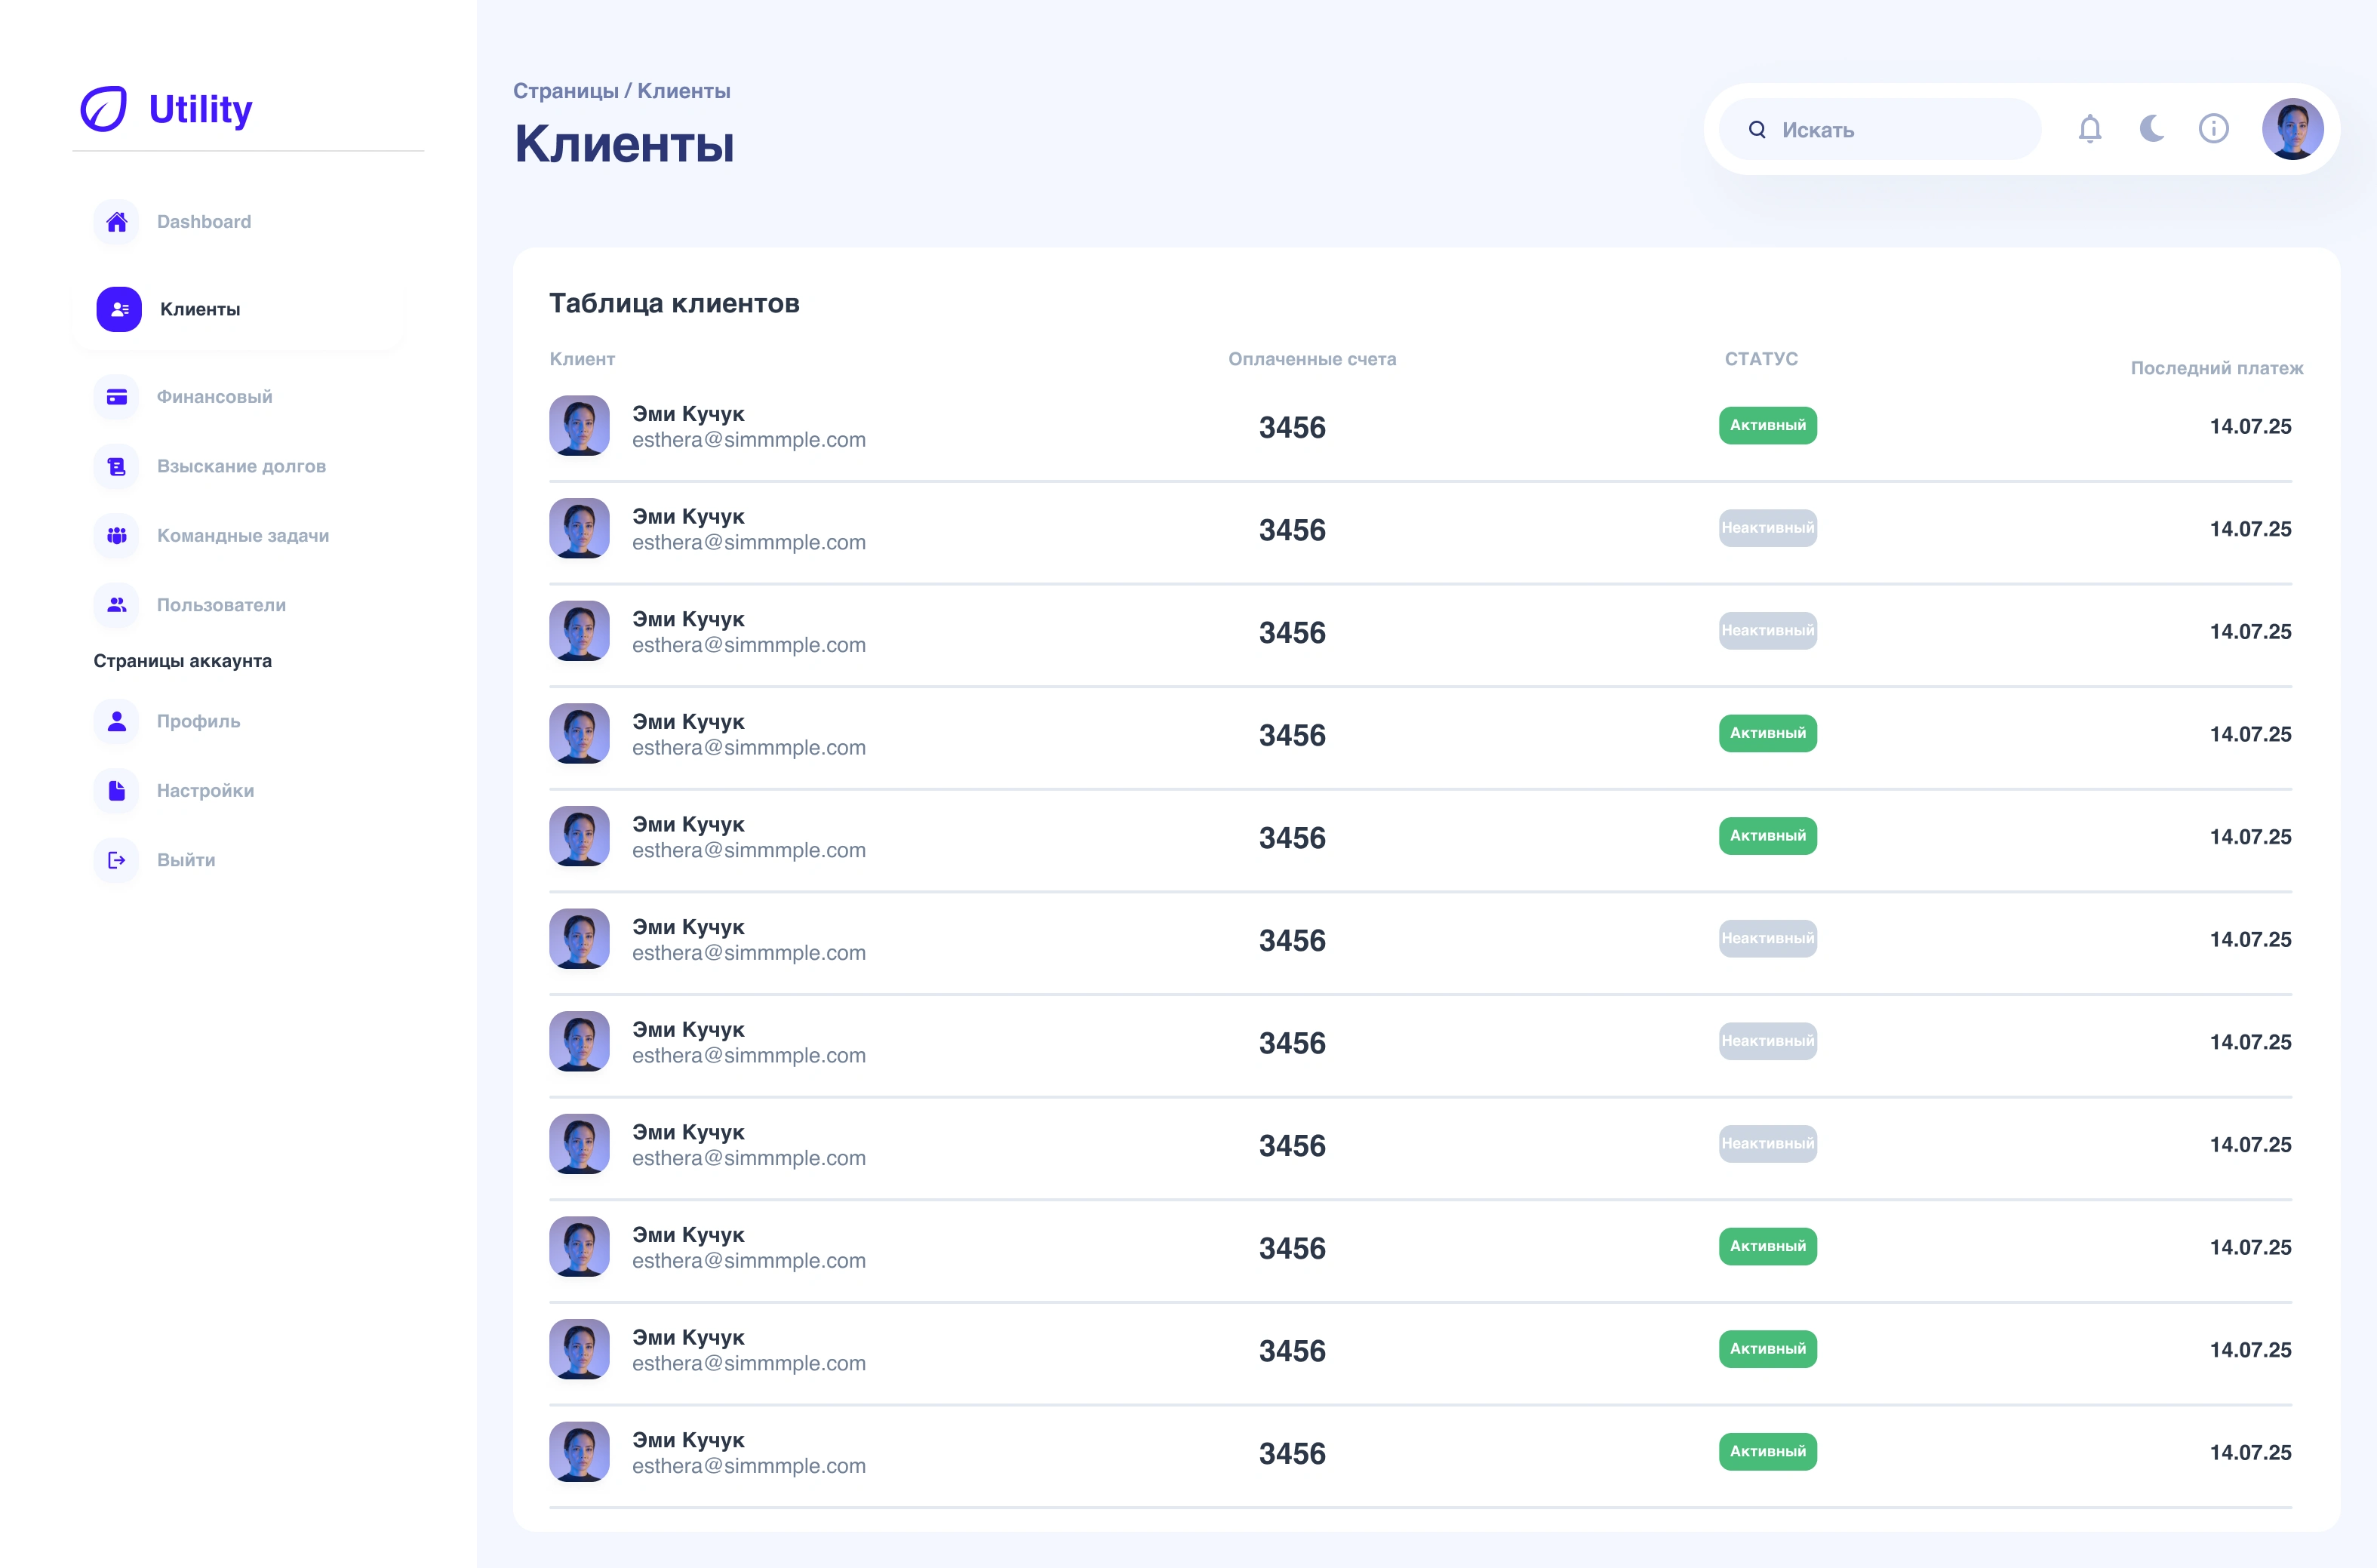
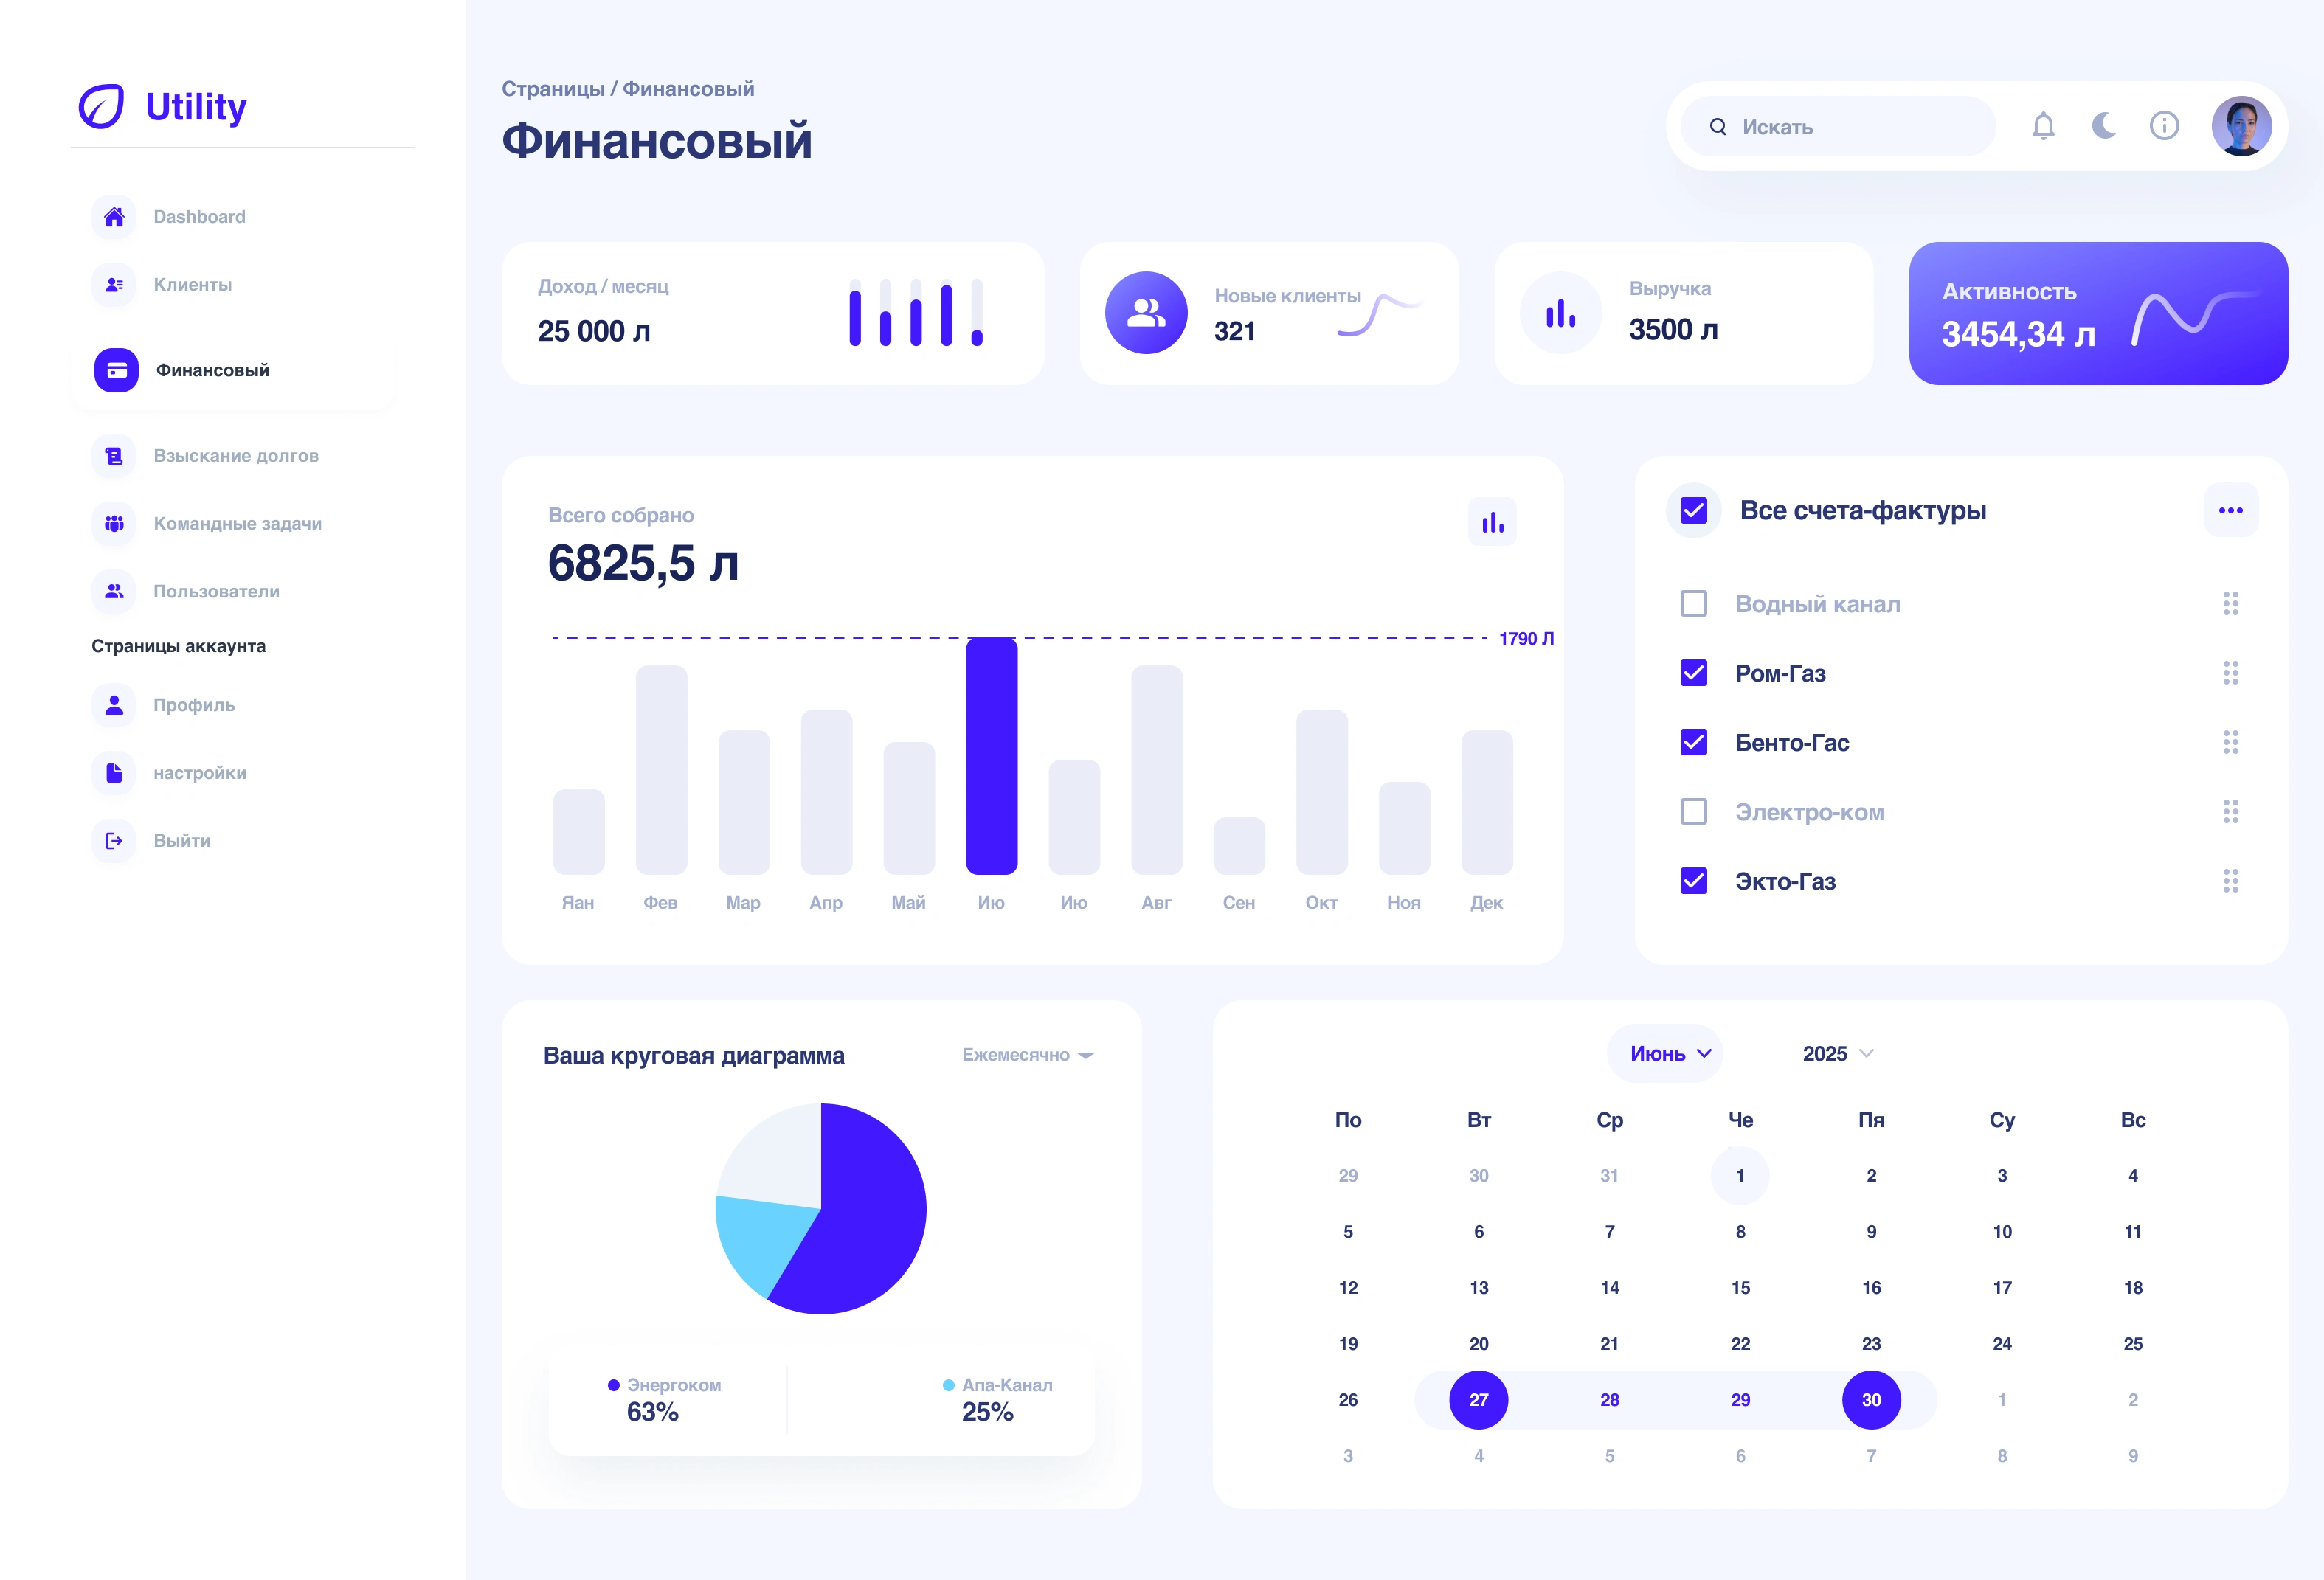
UI Design 🎨
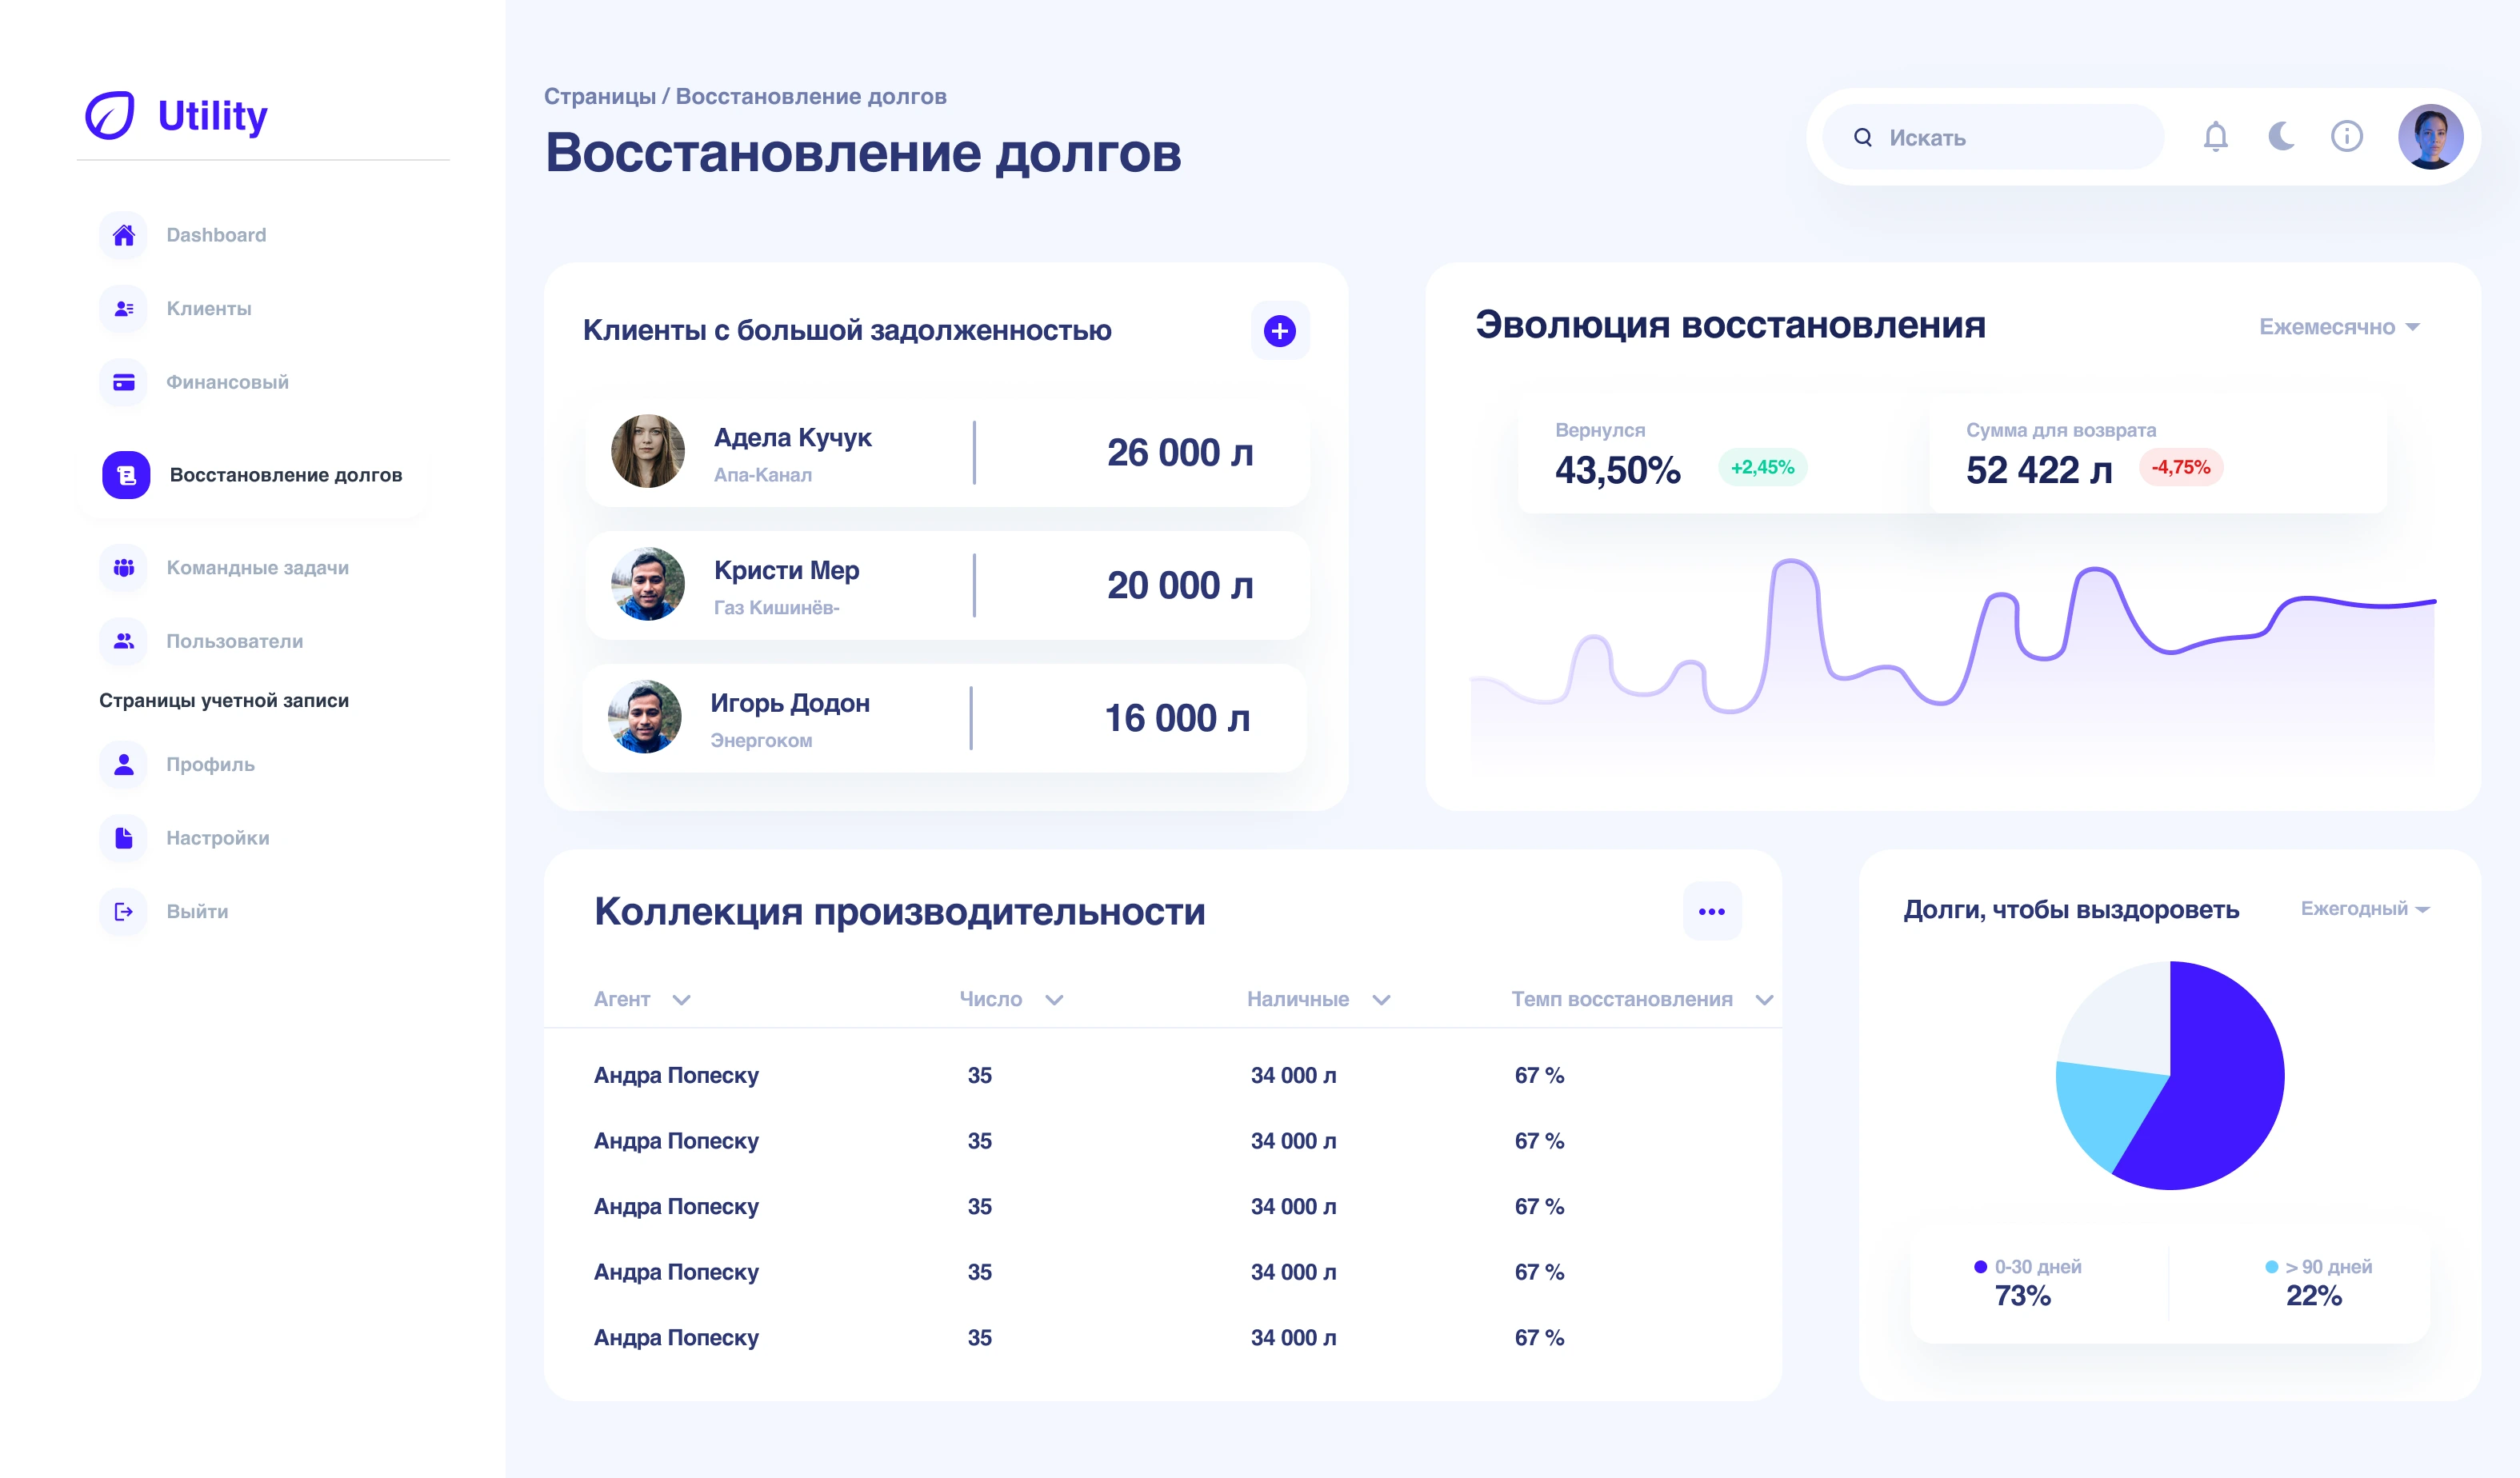
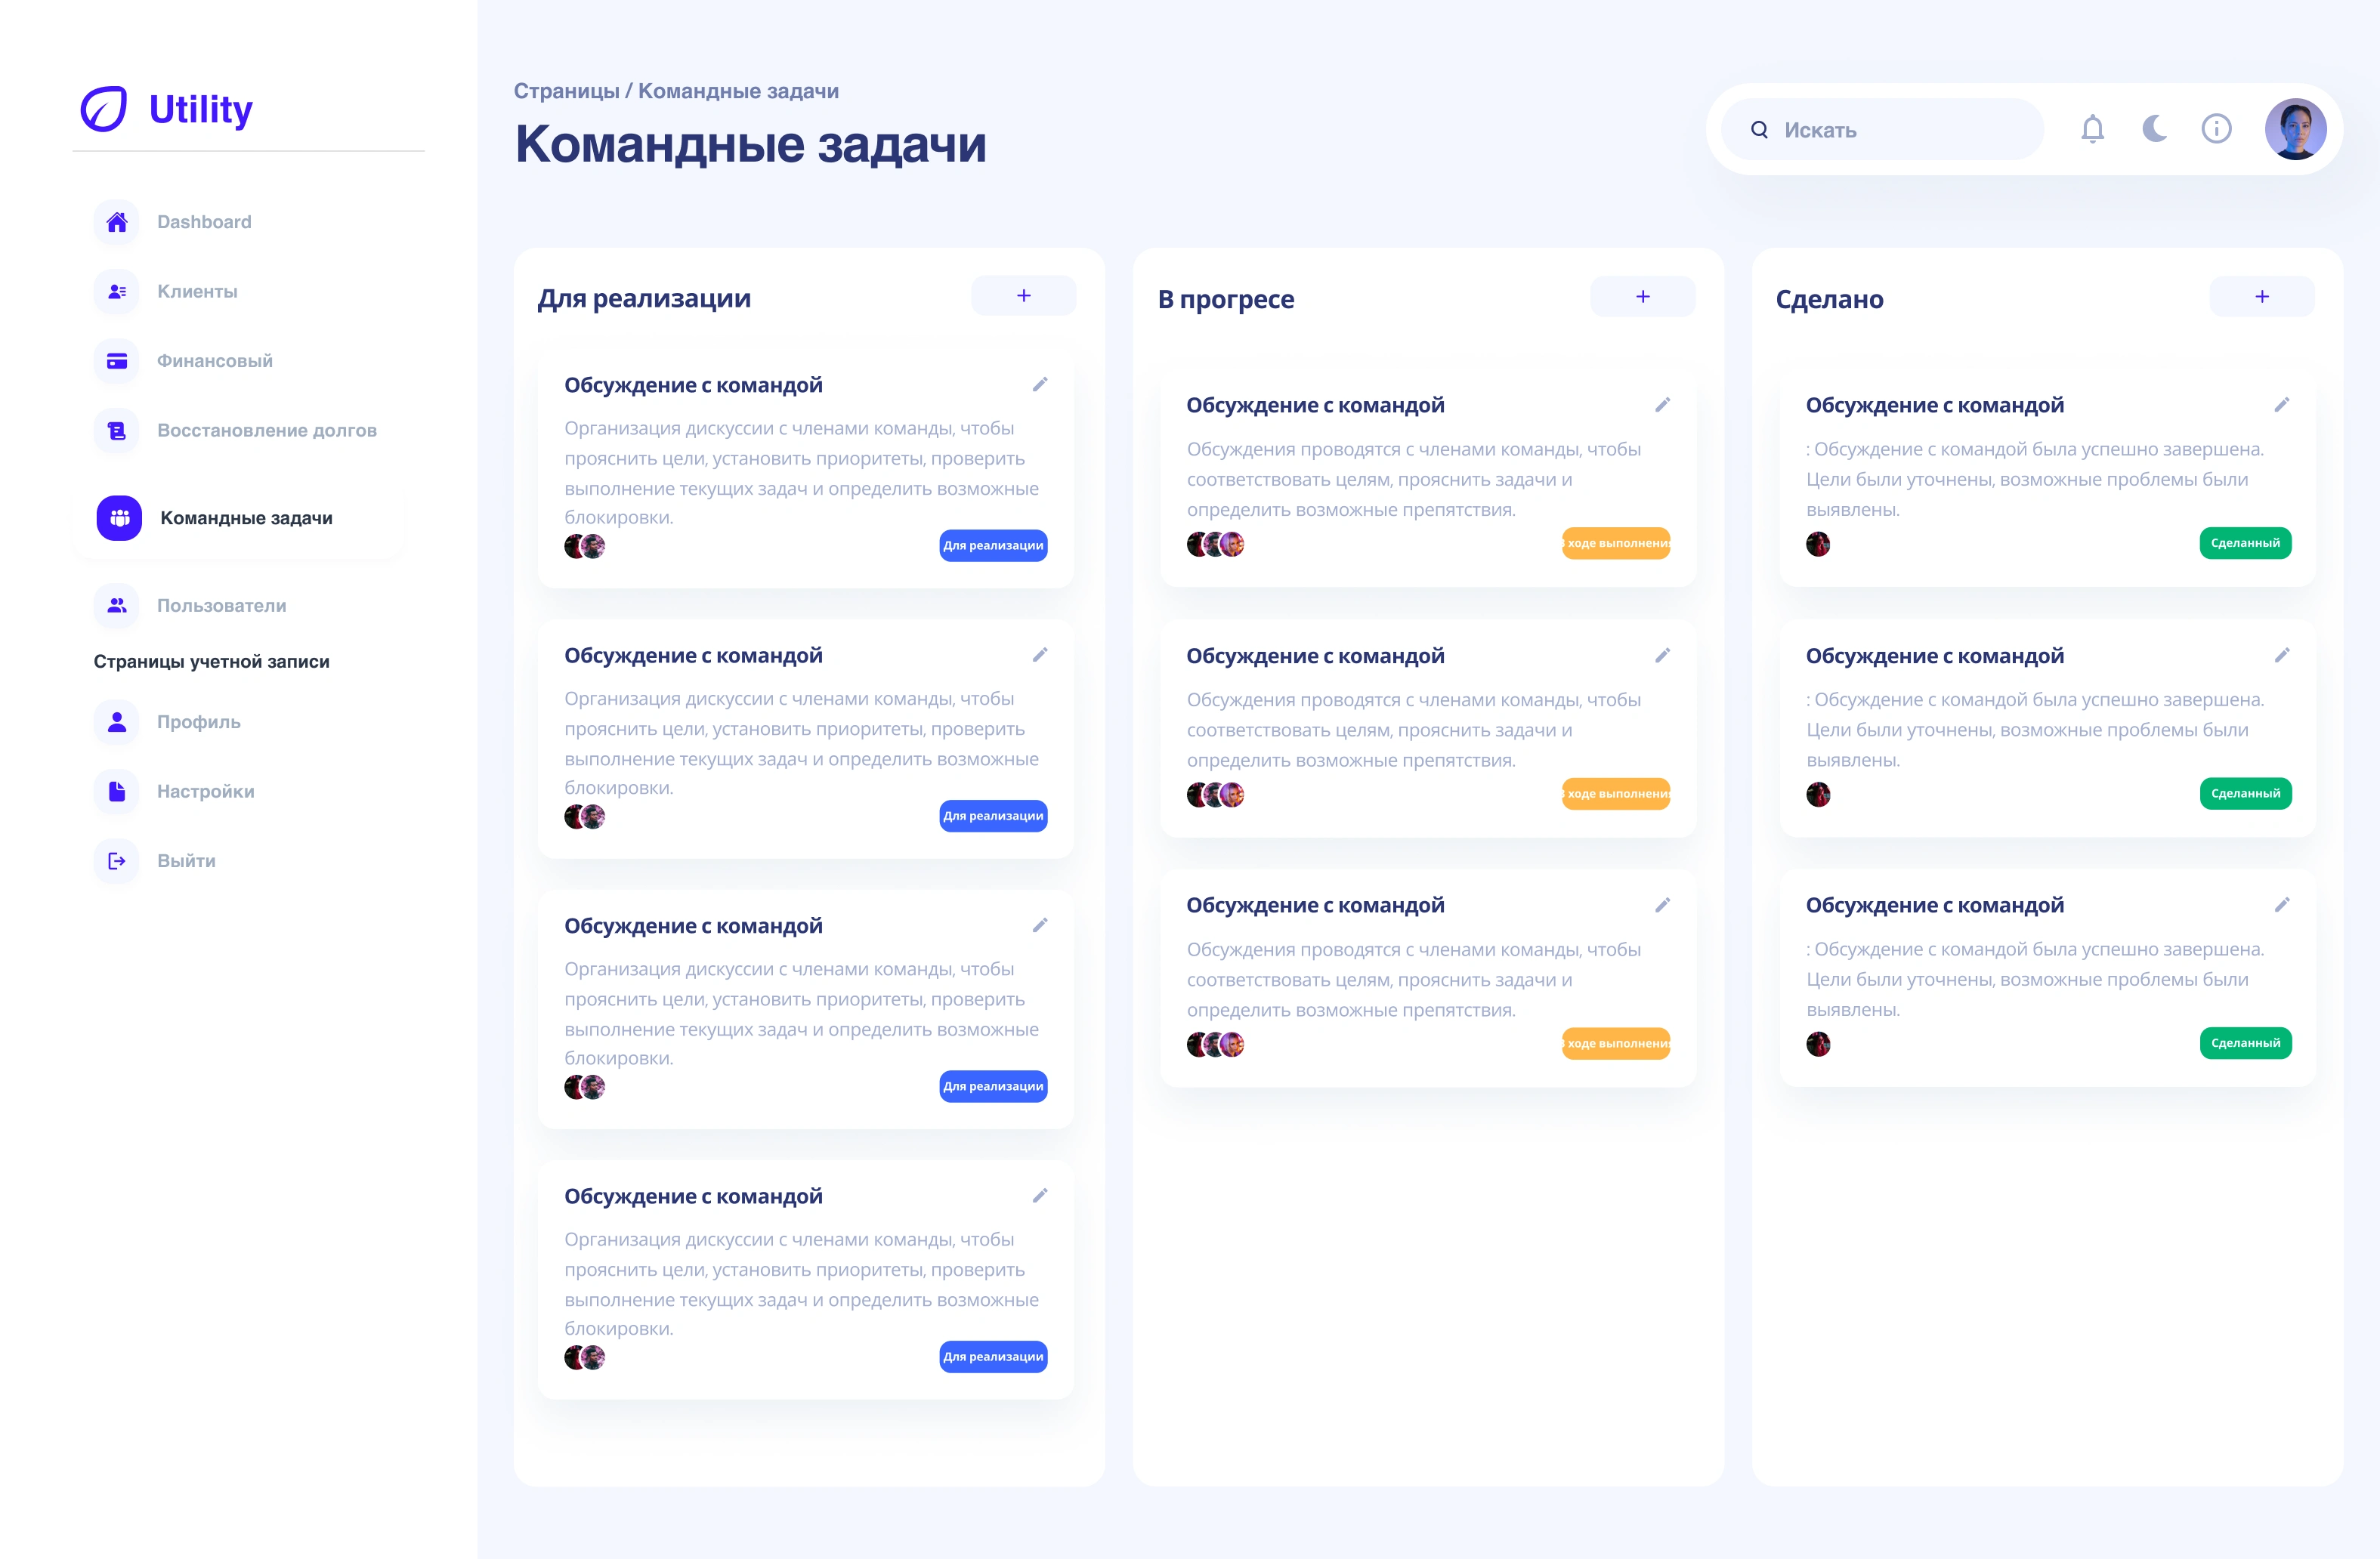
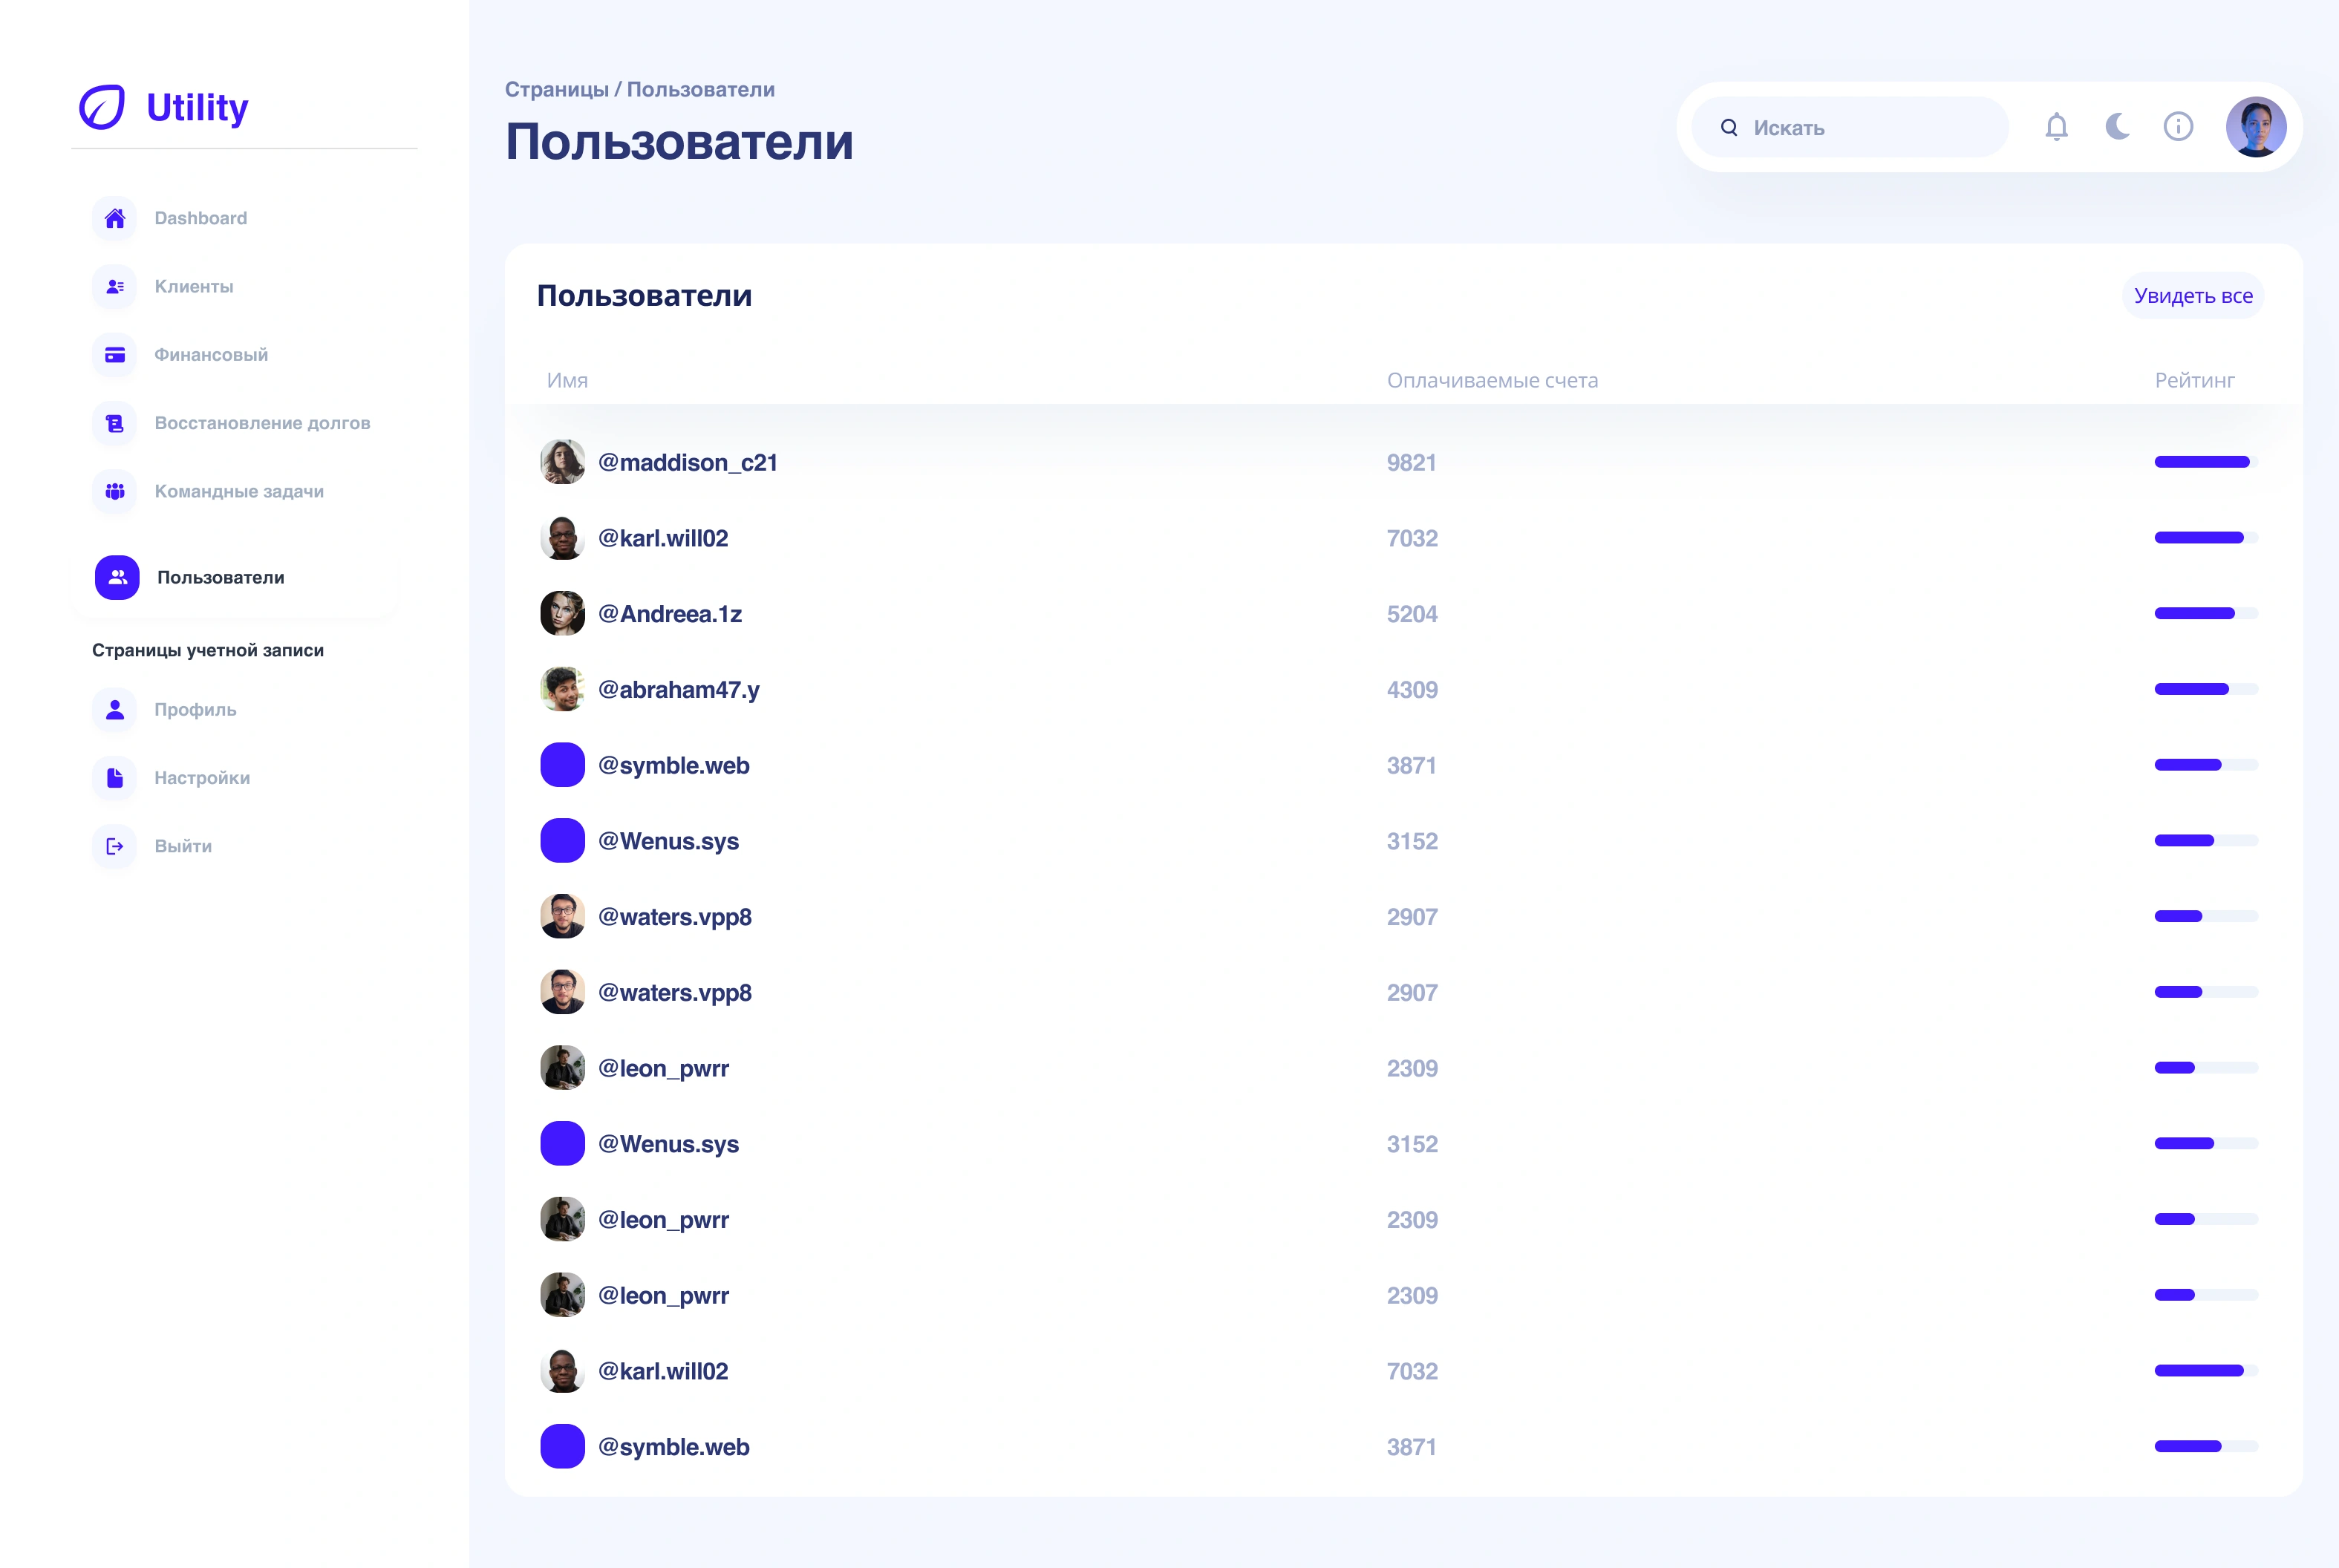
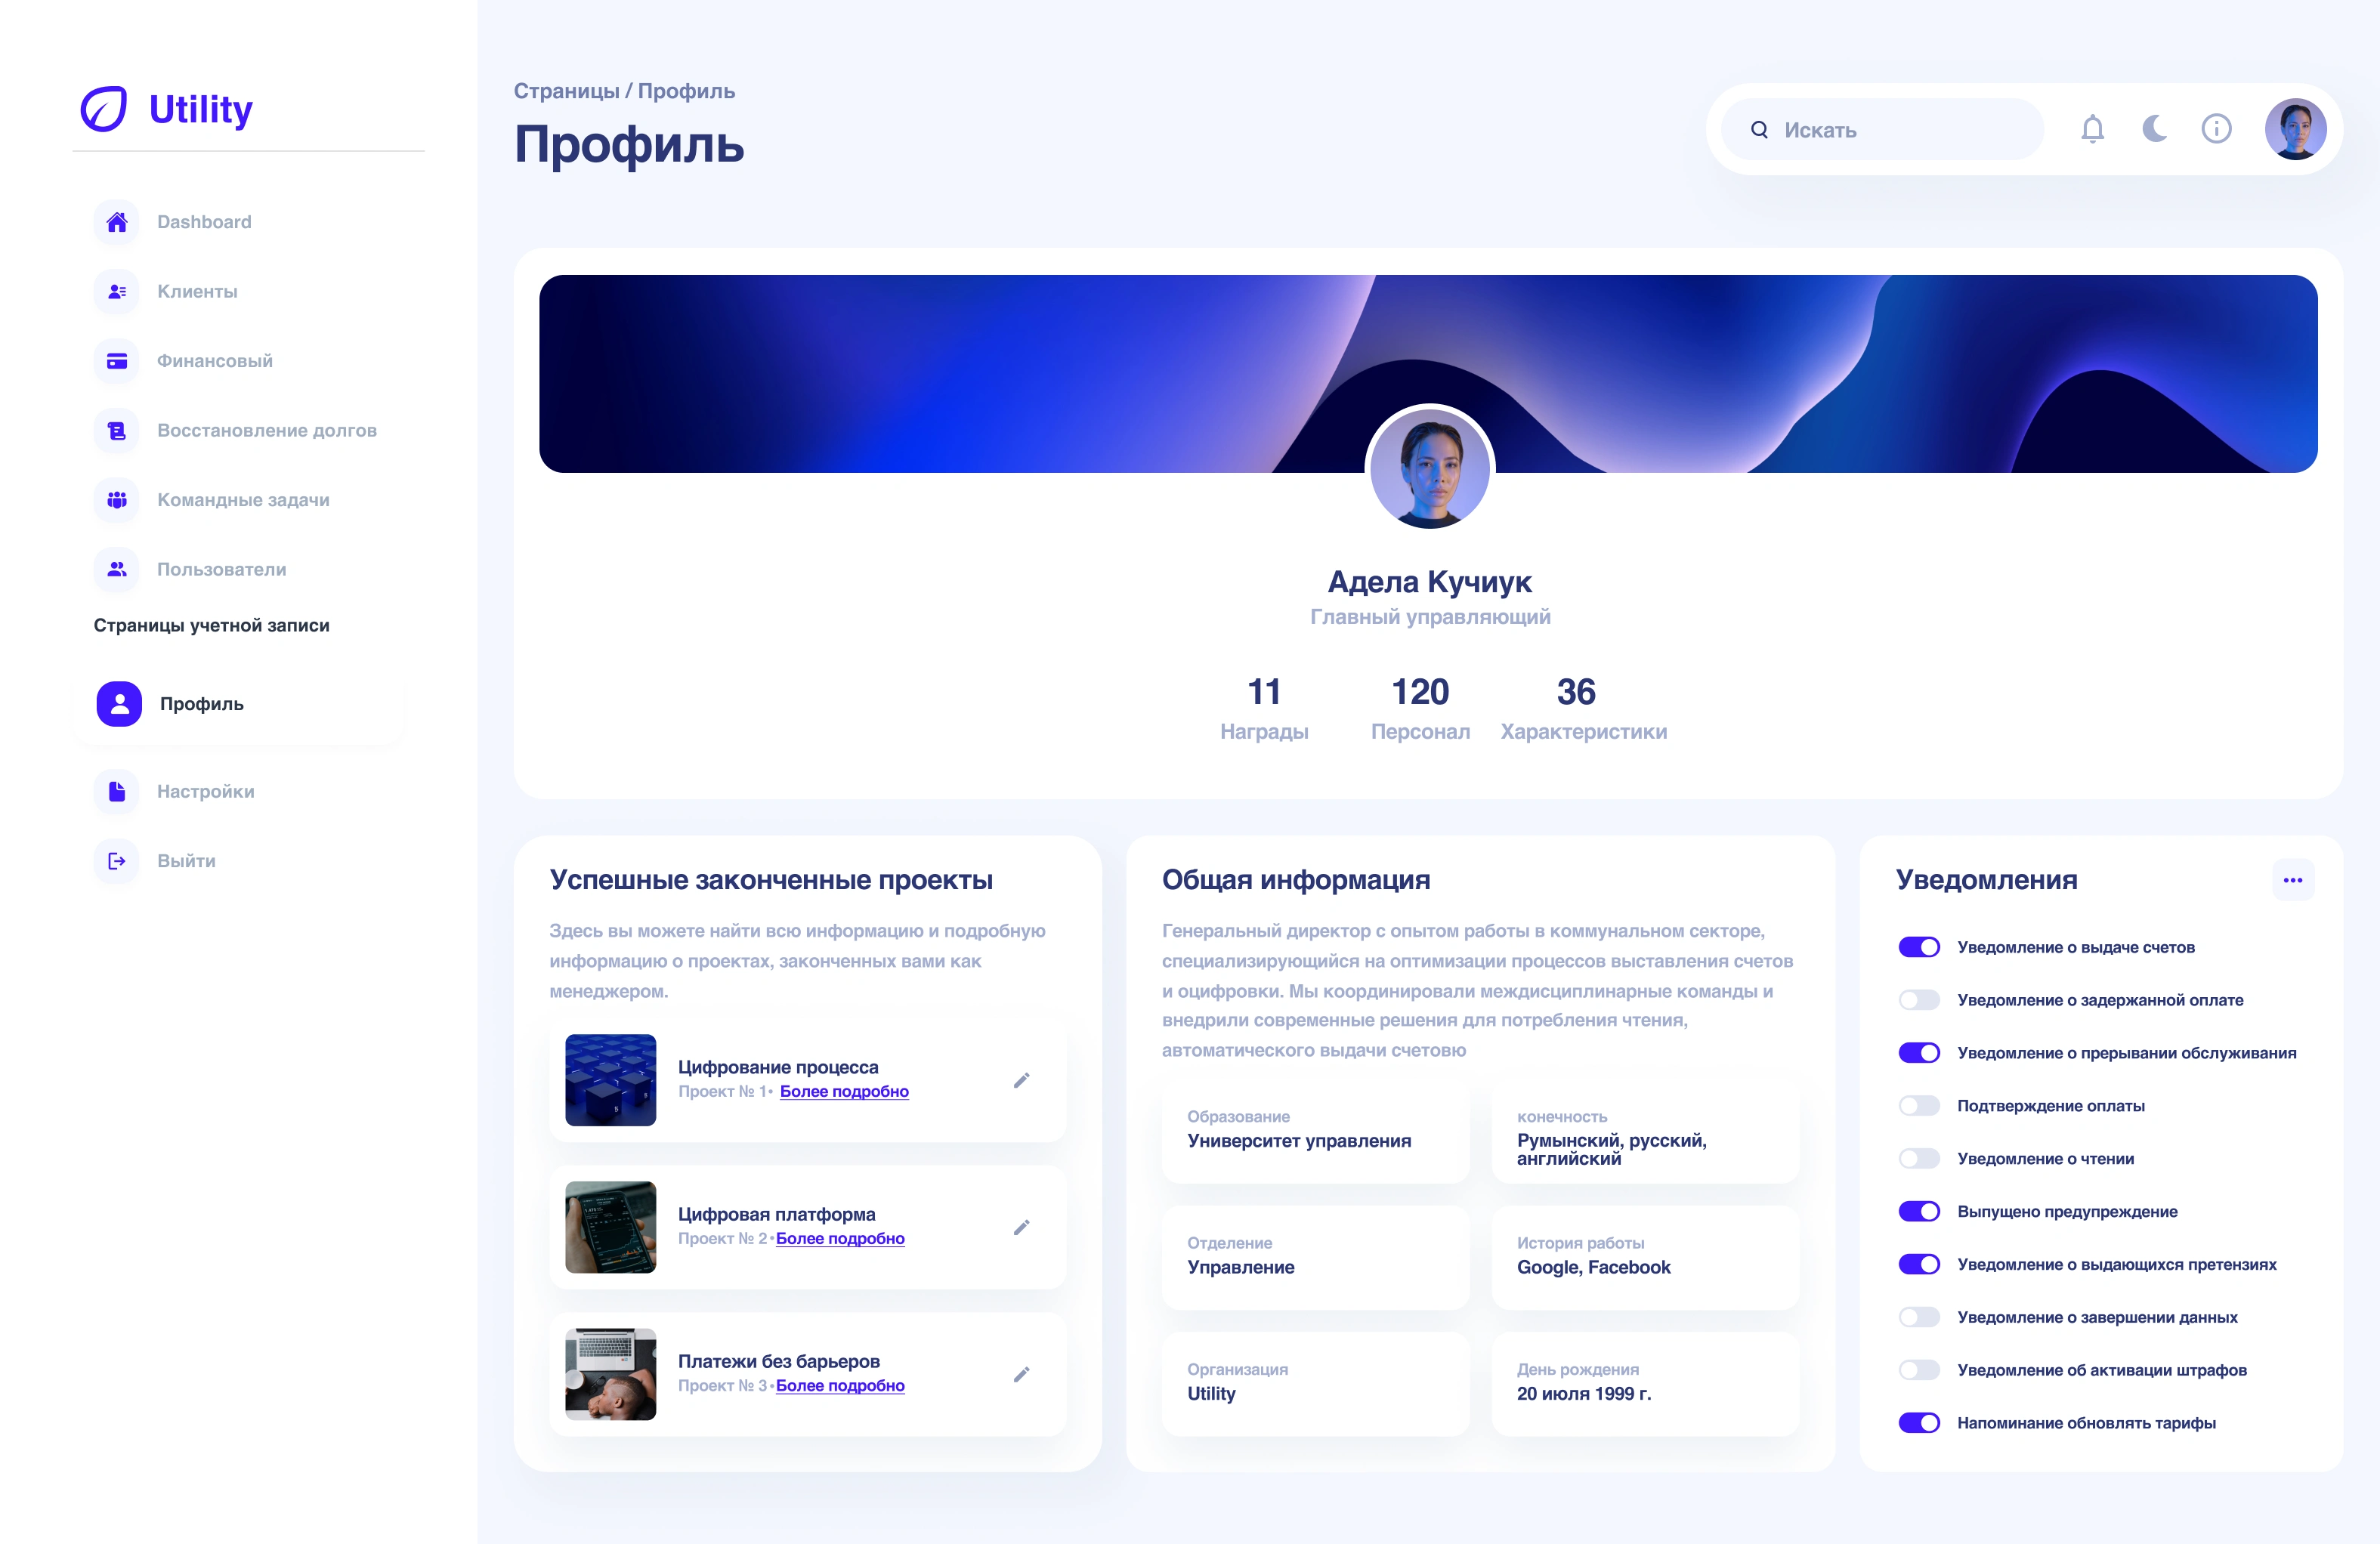
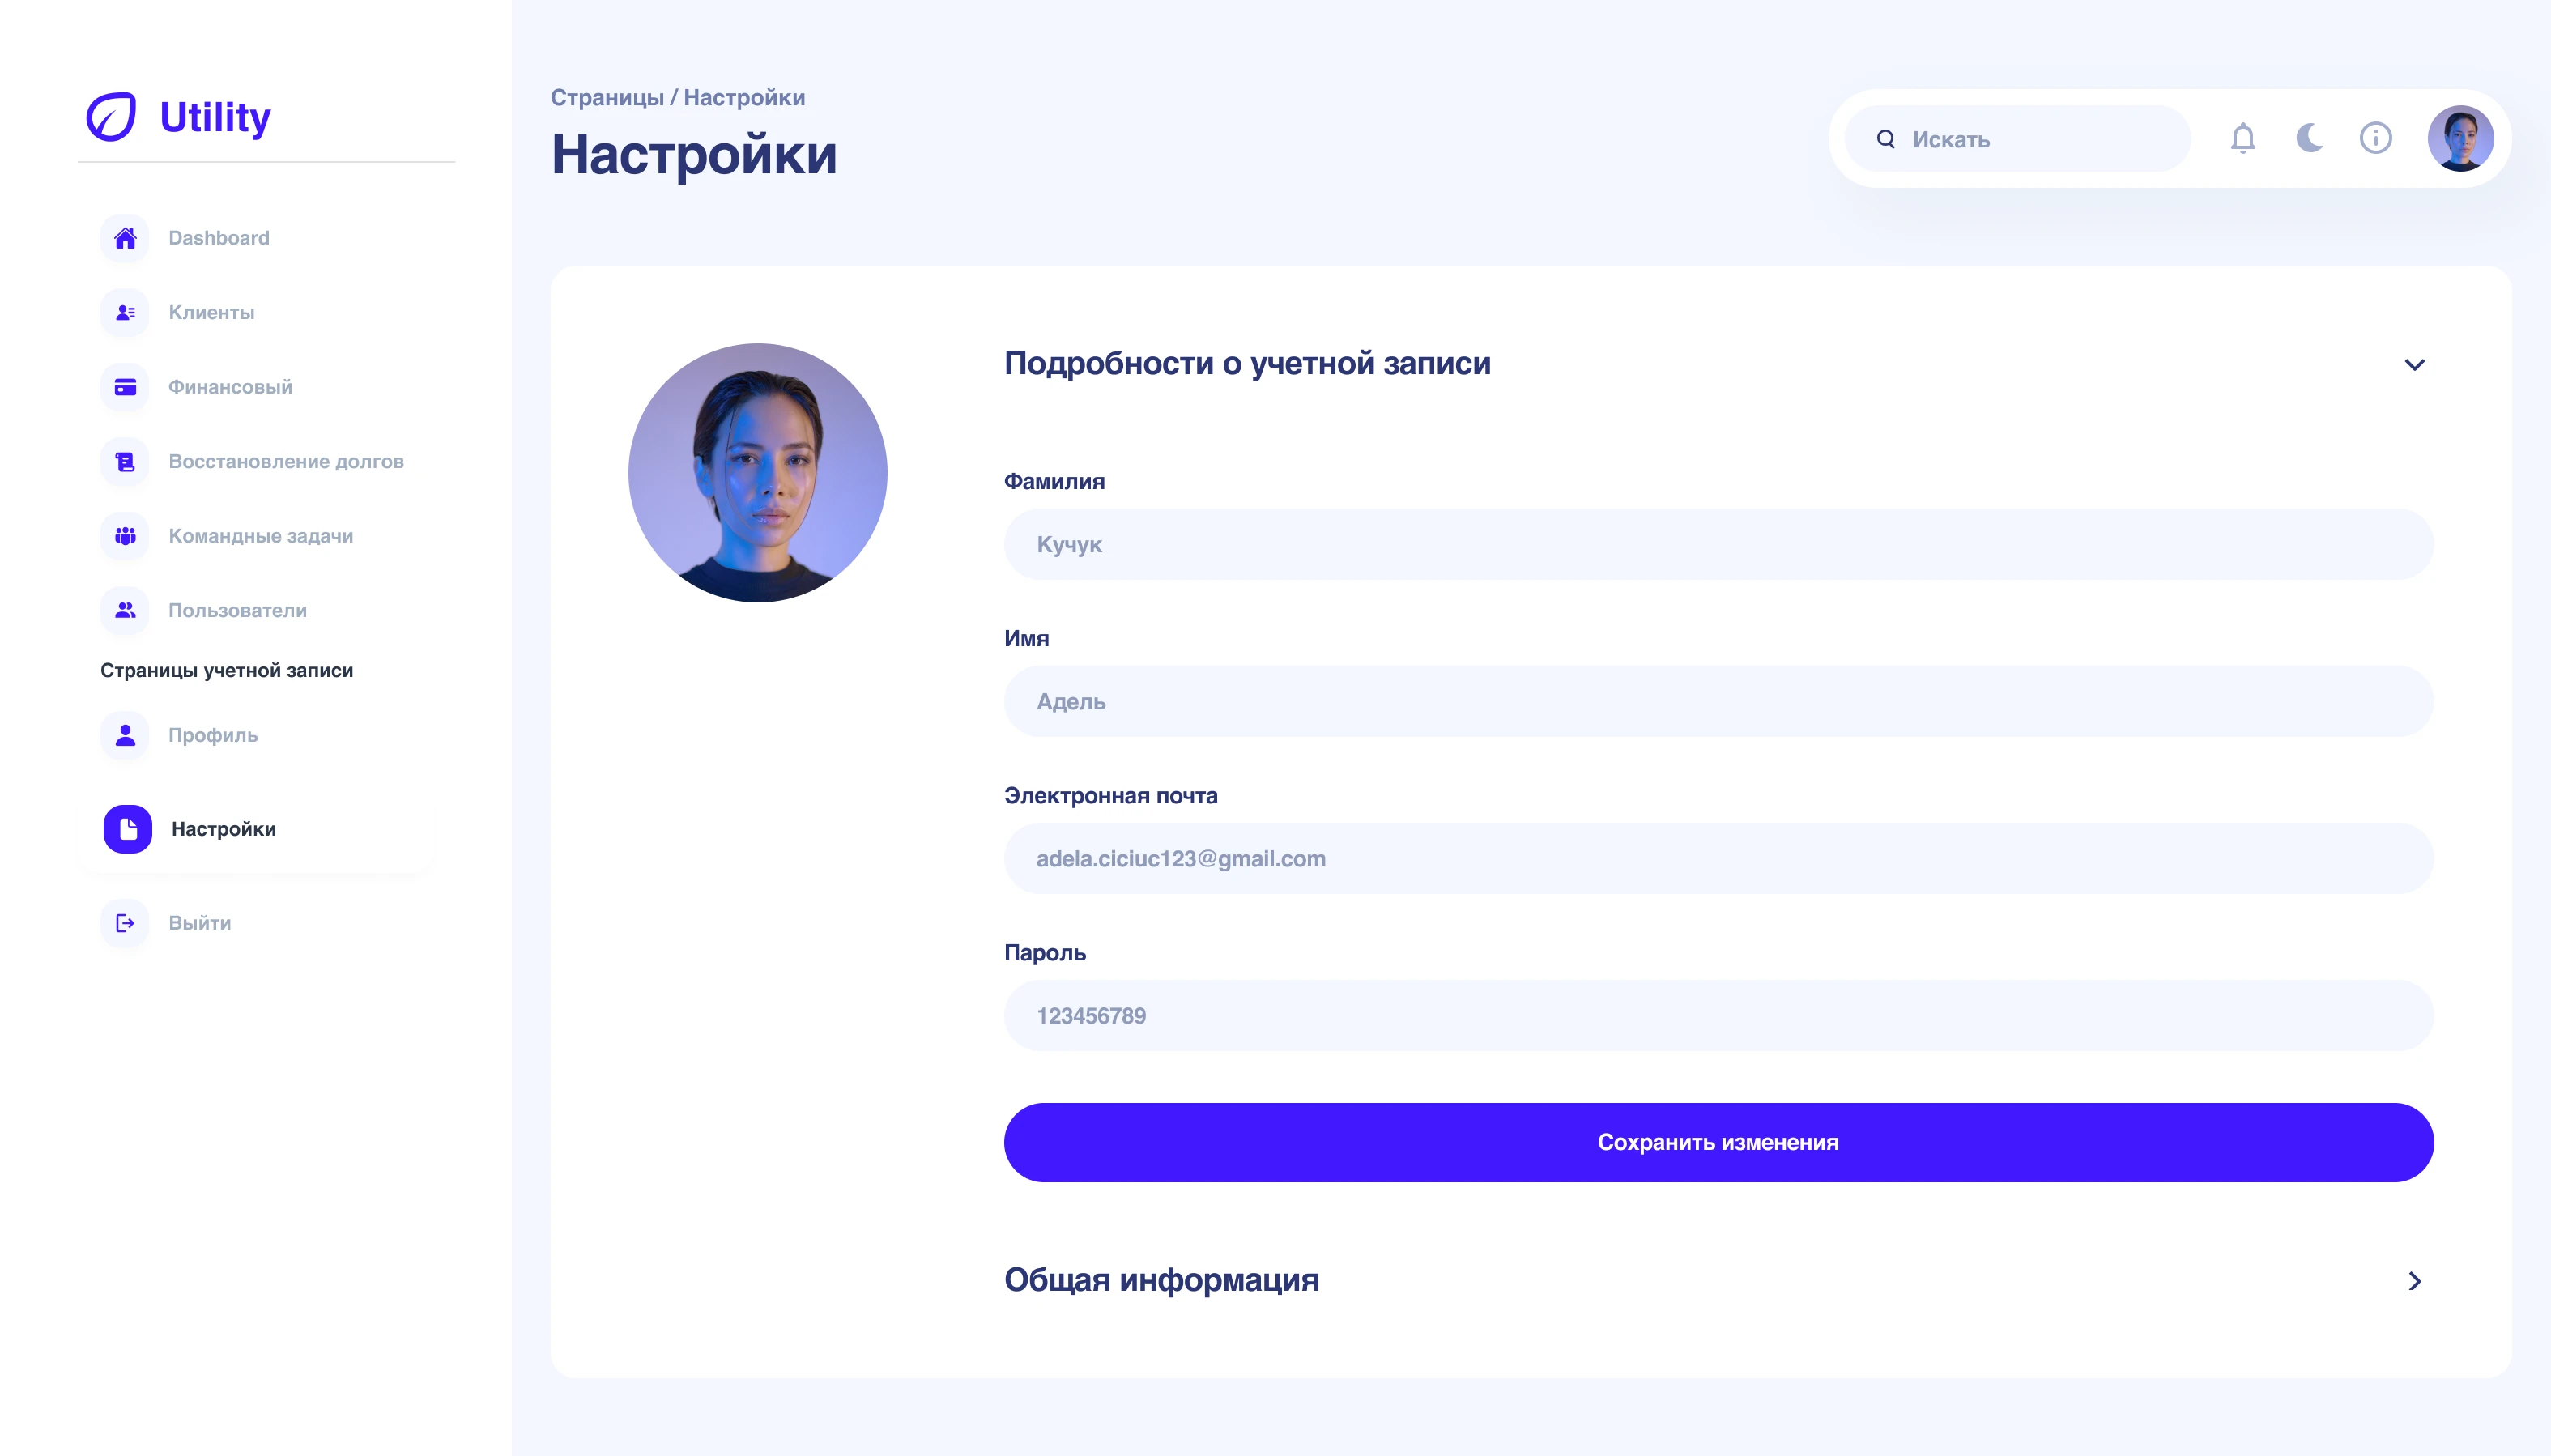
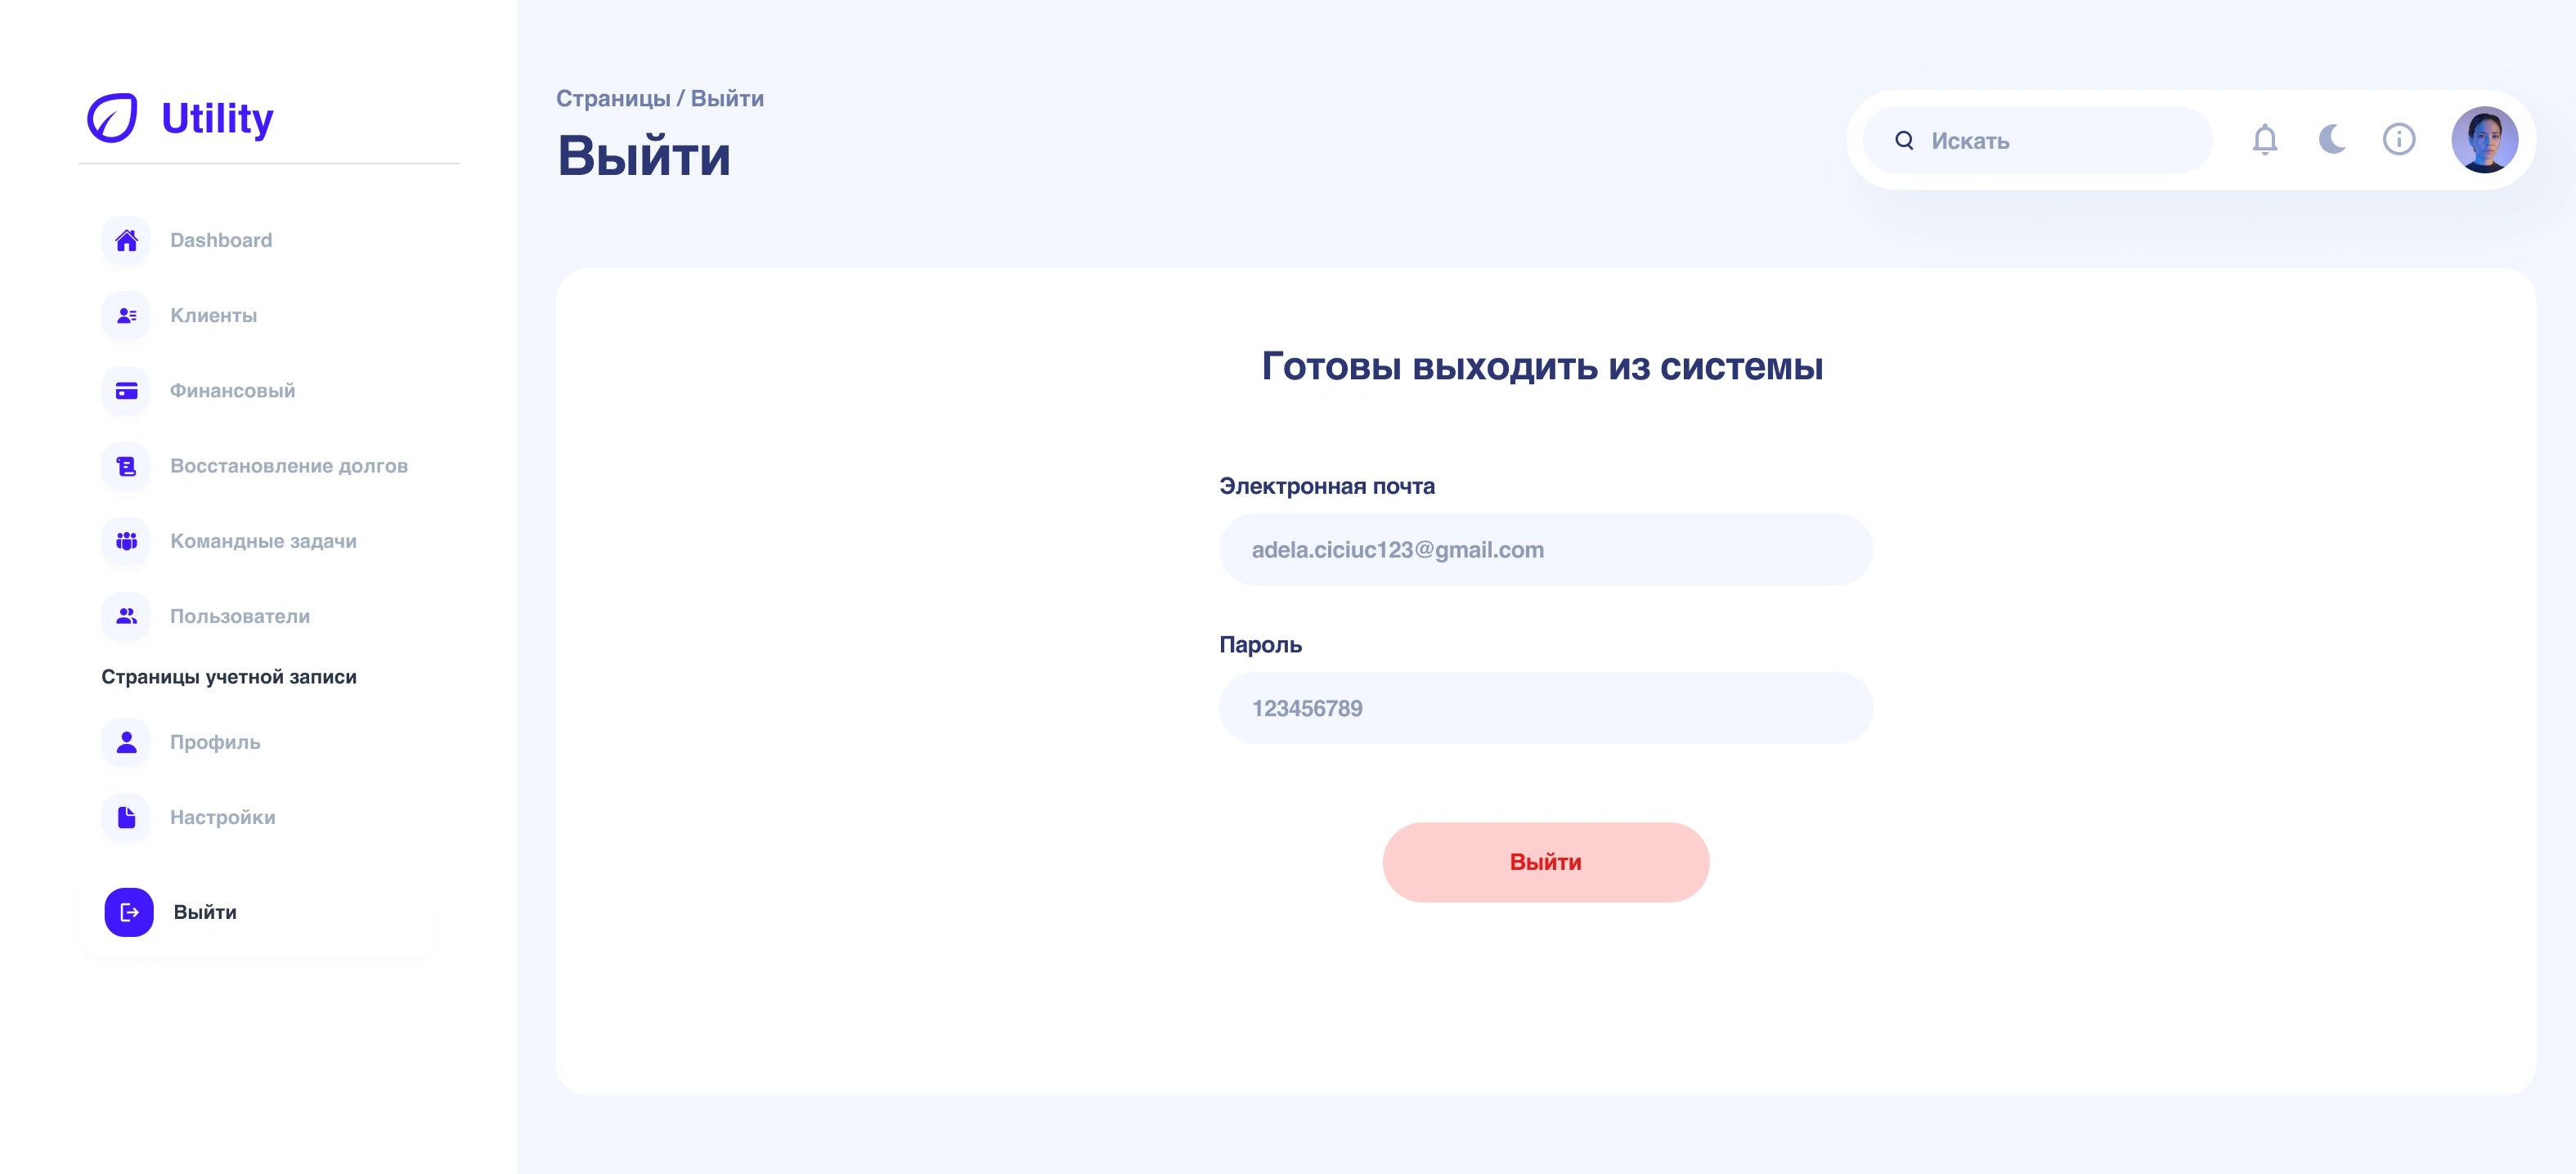
After confirming the dashboard structure, I explored multiple visual styles for the main financial sections. I tested both a data-intensive style and a clean, modern minimalist approach. The final design emphasizes clarity and readability, using soft colors, intuitive charts, and consistent typography to make complex financial data easy to interpret at a glance, while aligning with Utility Group’s professional brand identity.
WHAT I’VE LEARNED 📚
From this project, I learned that a user-centered approach is key to designing dashboards that are not only visually appealing but also highly functional. Understanding user needs, organizing complex information clearly, and iterating based on feedback helped me create an intuitive and efficient experience. This project reinforced the importance of attention to detail, adaptability, and close collaboration with users to deliver meaningful solutions.
0 likes · 0 views · Nov 12, 2026
Utility Group is a local company specializing in the provision and management of essential utility services, ensuring reliable delivery of energy, water,…
