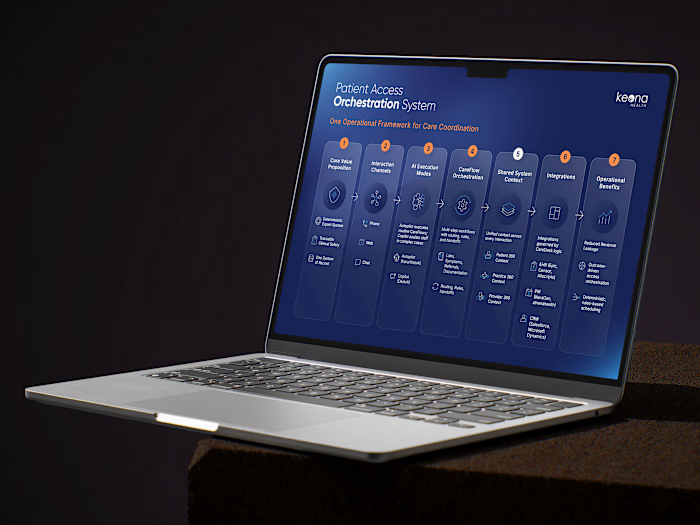
Technical Infographics for Teske Systemtechnik

Apolinar Rios

Technical Infographics for Teske Systemtechnik
A series of four technical infographics created for Teske Systemtechnik, a German web development company working with Python and other web technologies.
The challenge was to turn complex systems, data migrations, infrastructure, and software architecture into visuals that could be understood at a glance without stripping away the technical substance.
Each infographic was built within Teske Systemtechnik’s existing design system, using its visual language, typography, color palette, and iconography to create a consistent set of visuals for their portfolio.
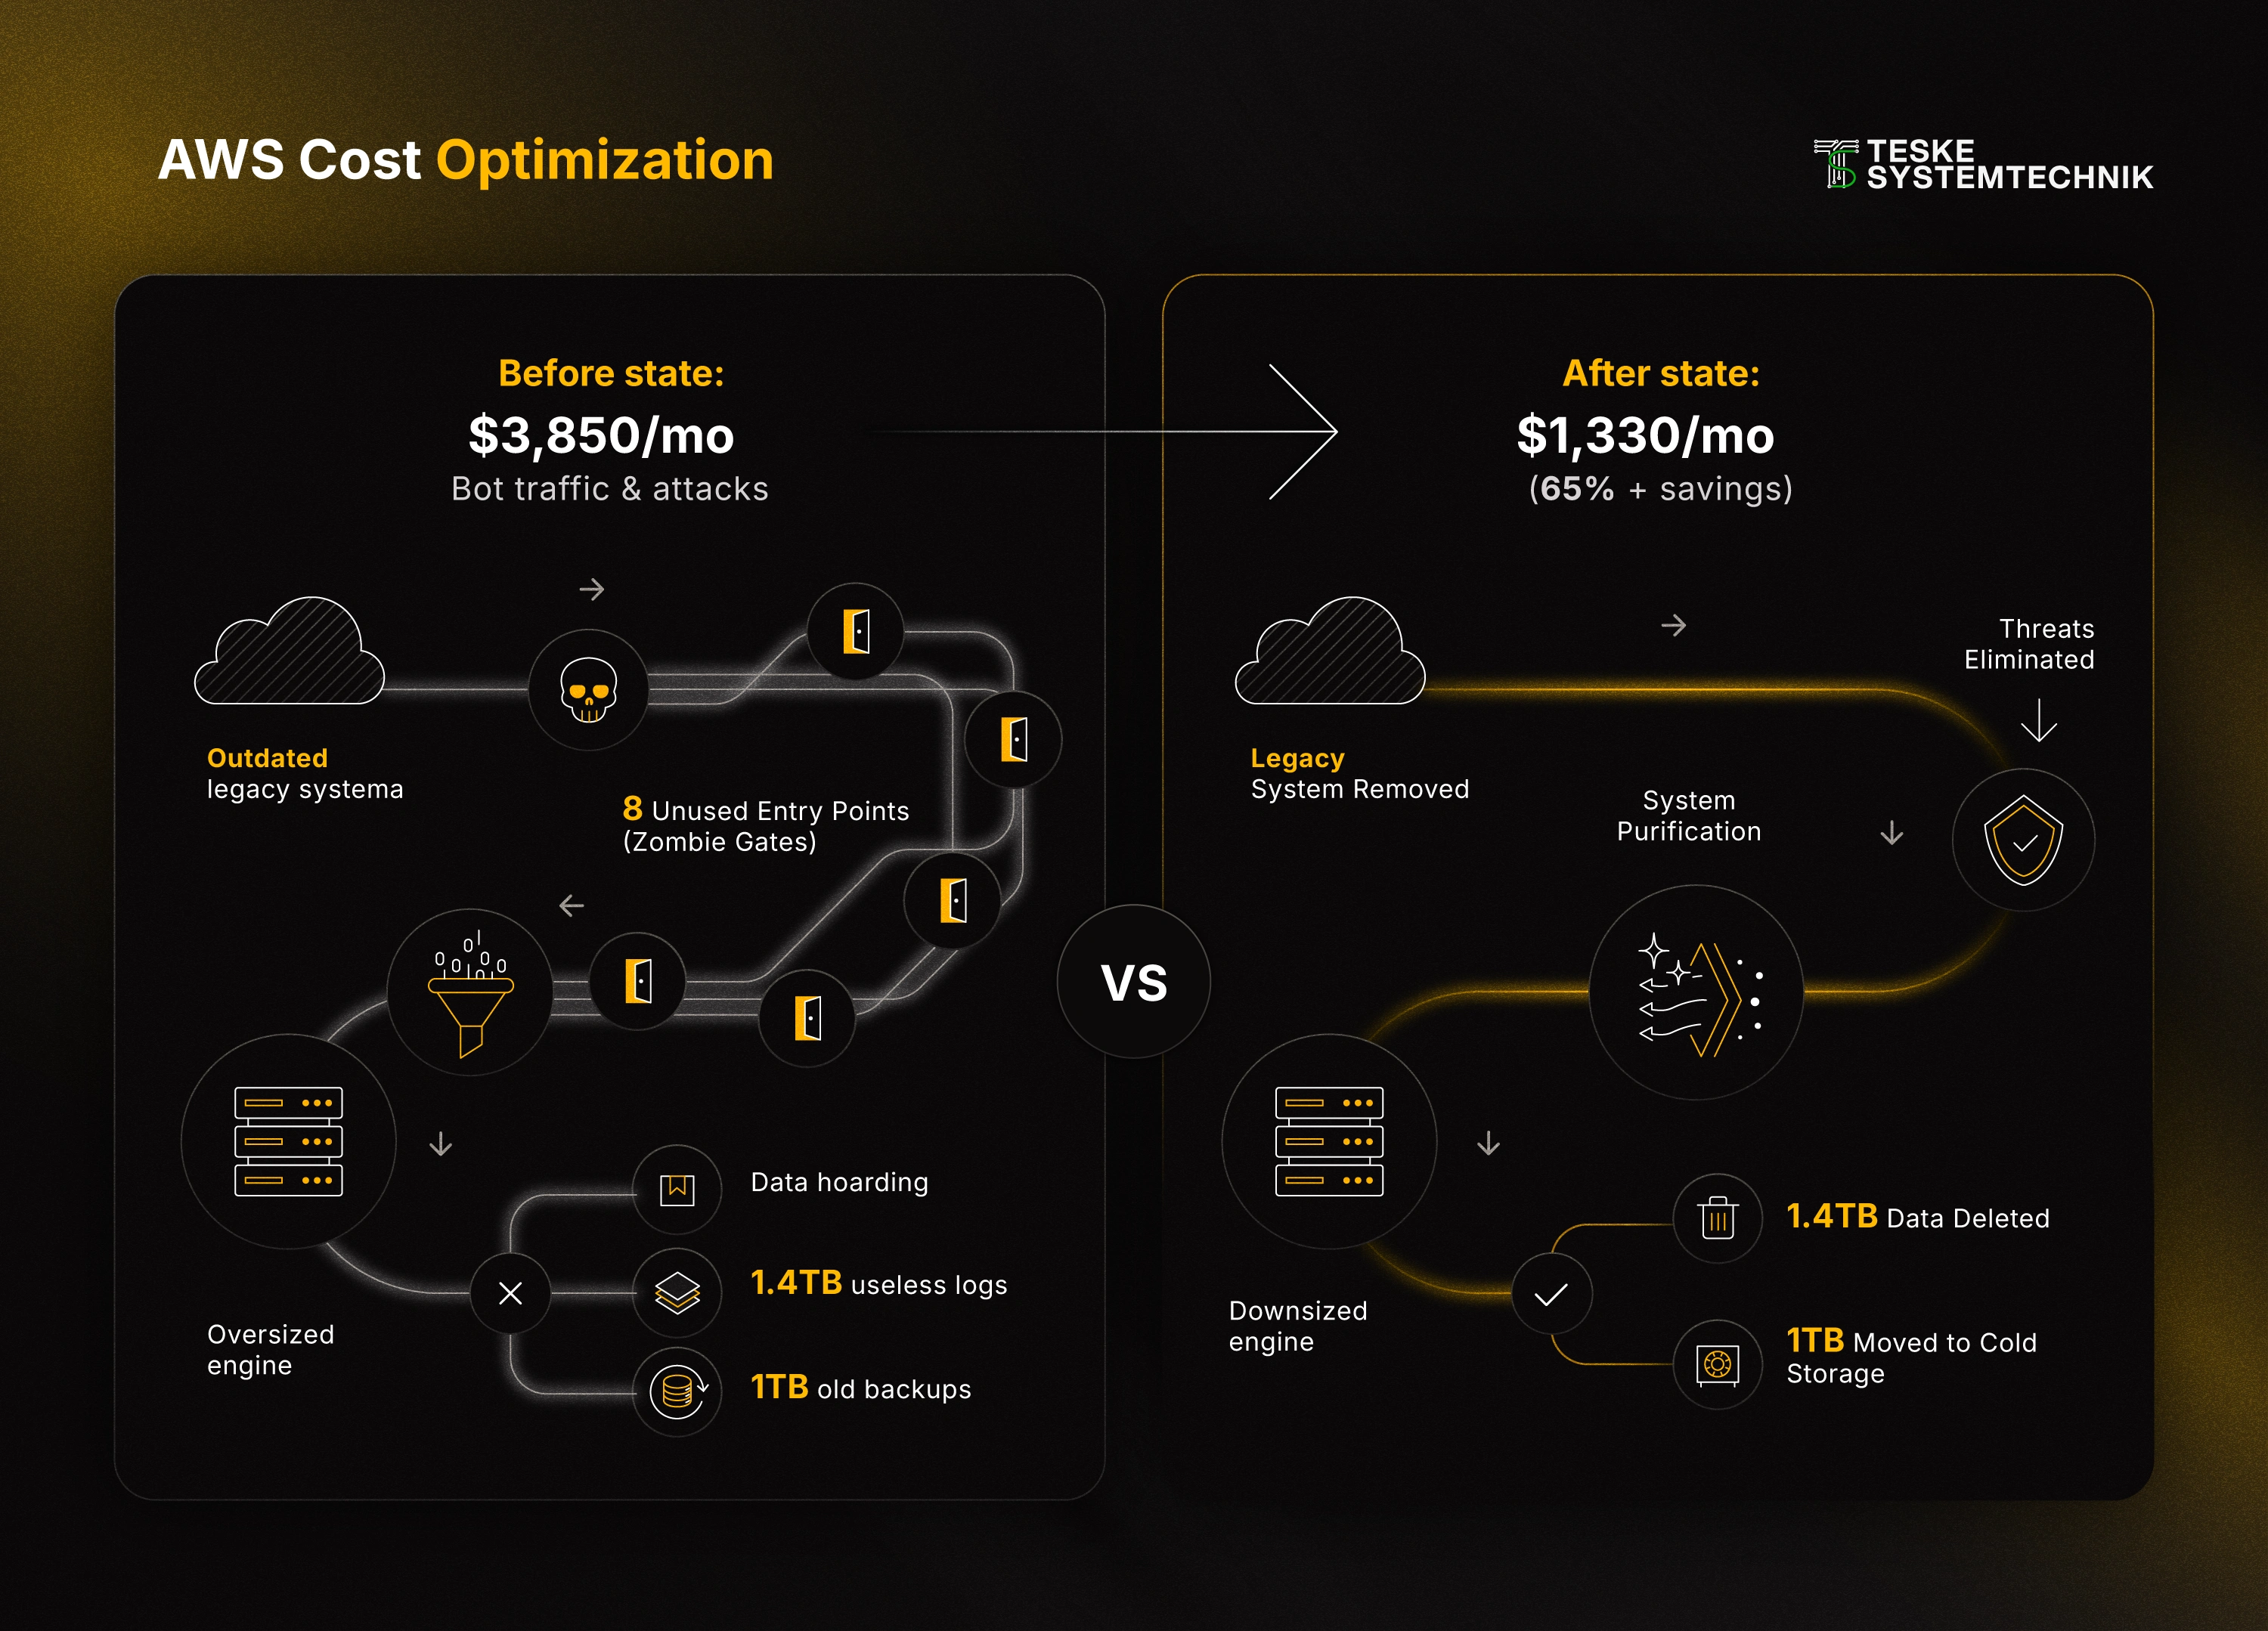
AWS Cost Optimization
This piece compares the infrastructure before and after an optimization process.
The visual challenge was to make the improvement immediately visible. Instead of presenting the information as a list of cost reductions, the infographic contrasts the original system, with its unnecessary entry points and excess storage, against the simplified system that followed.
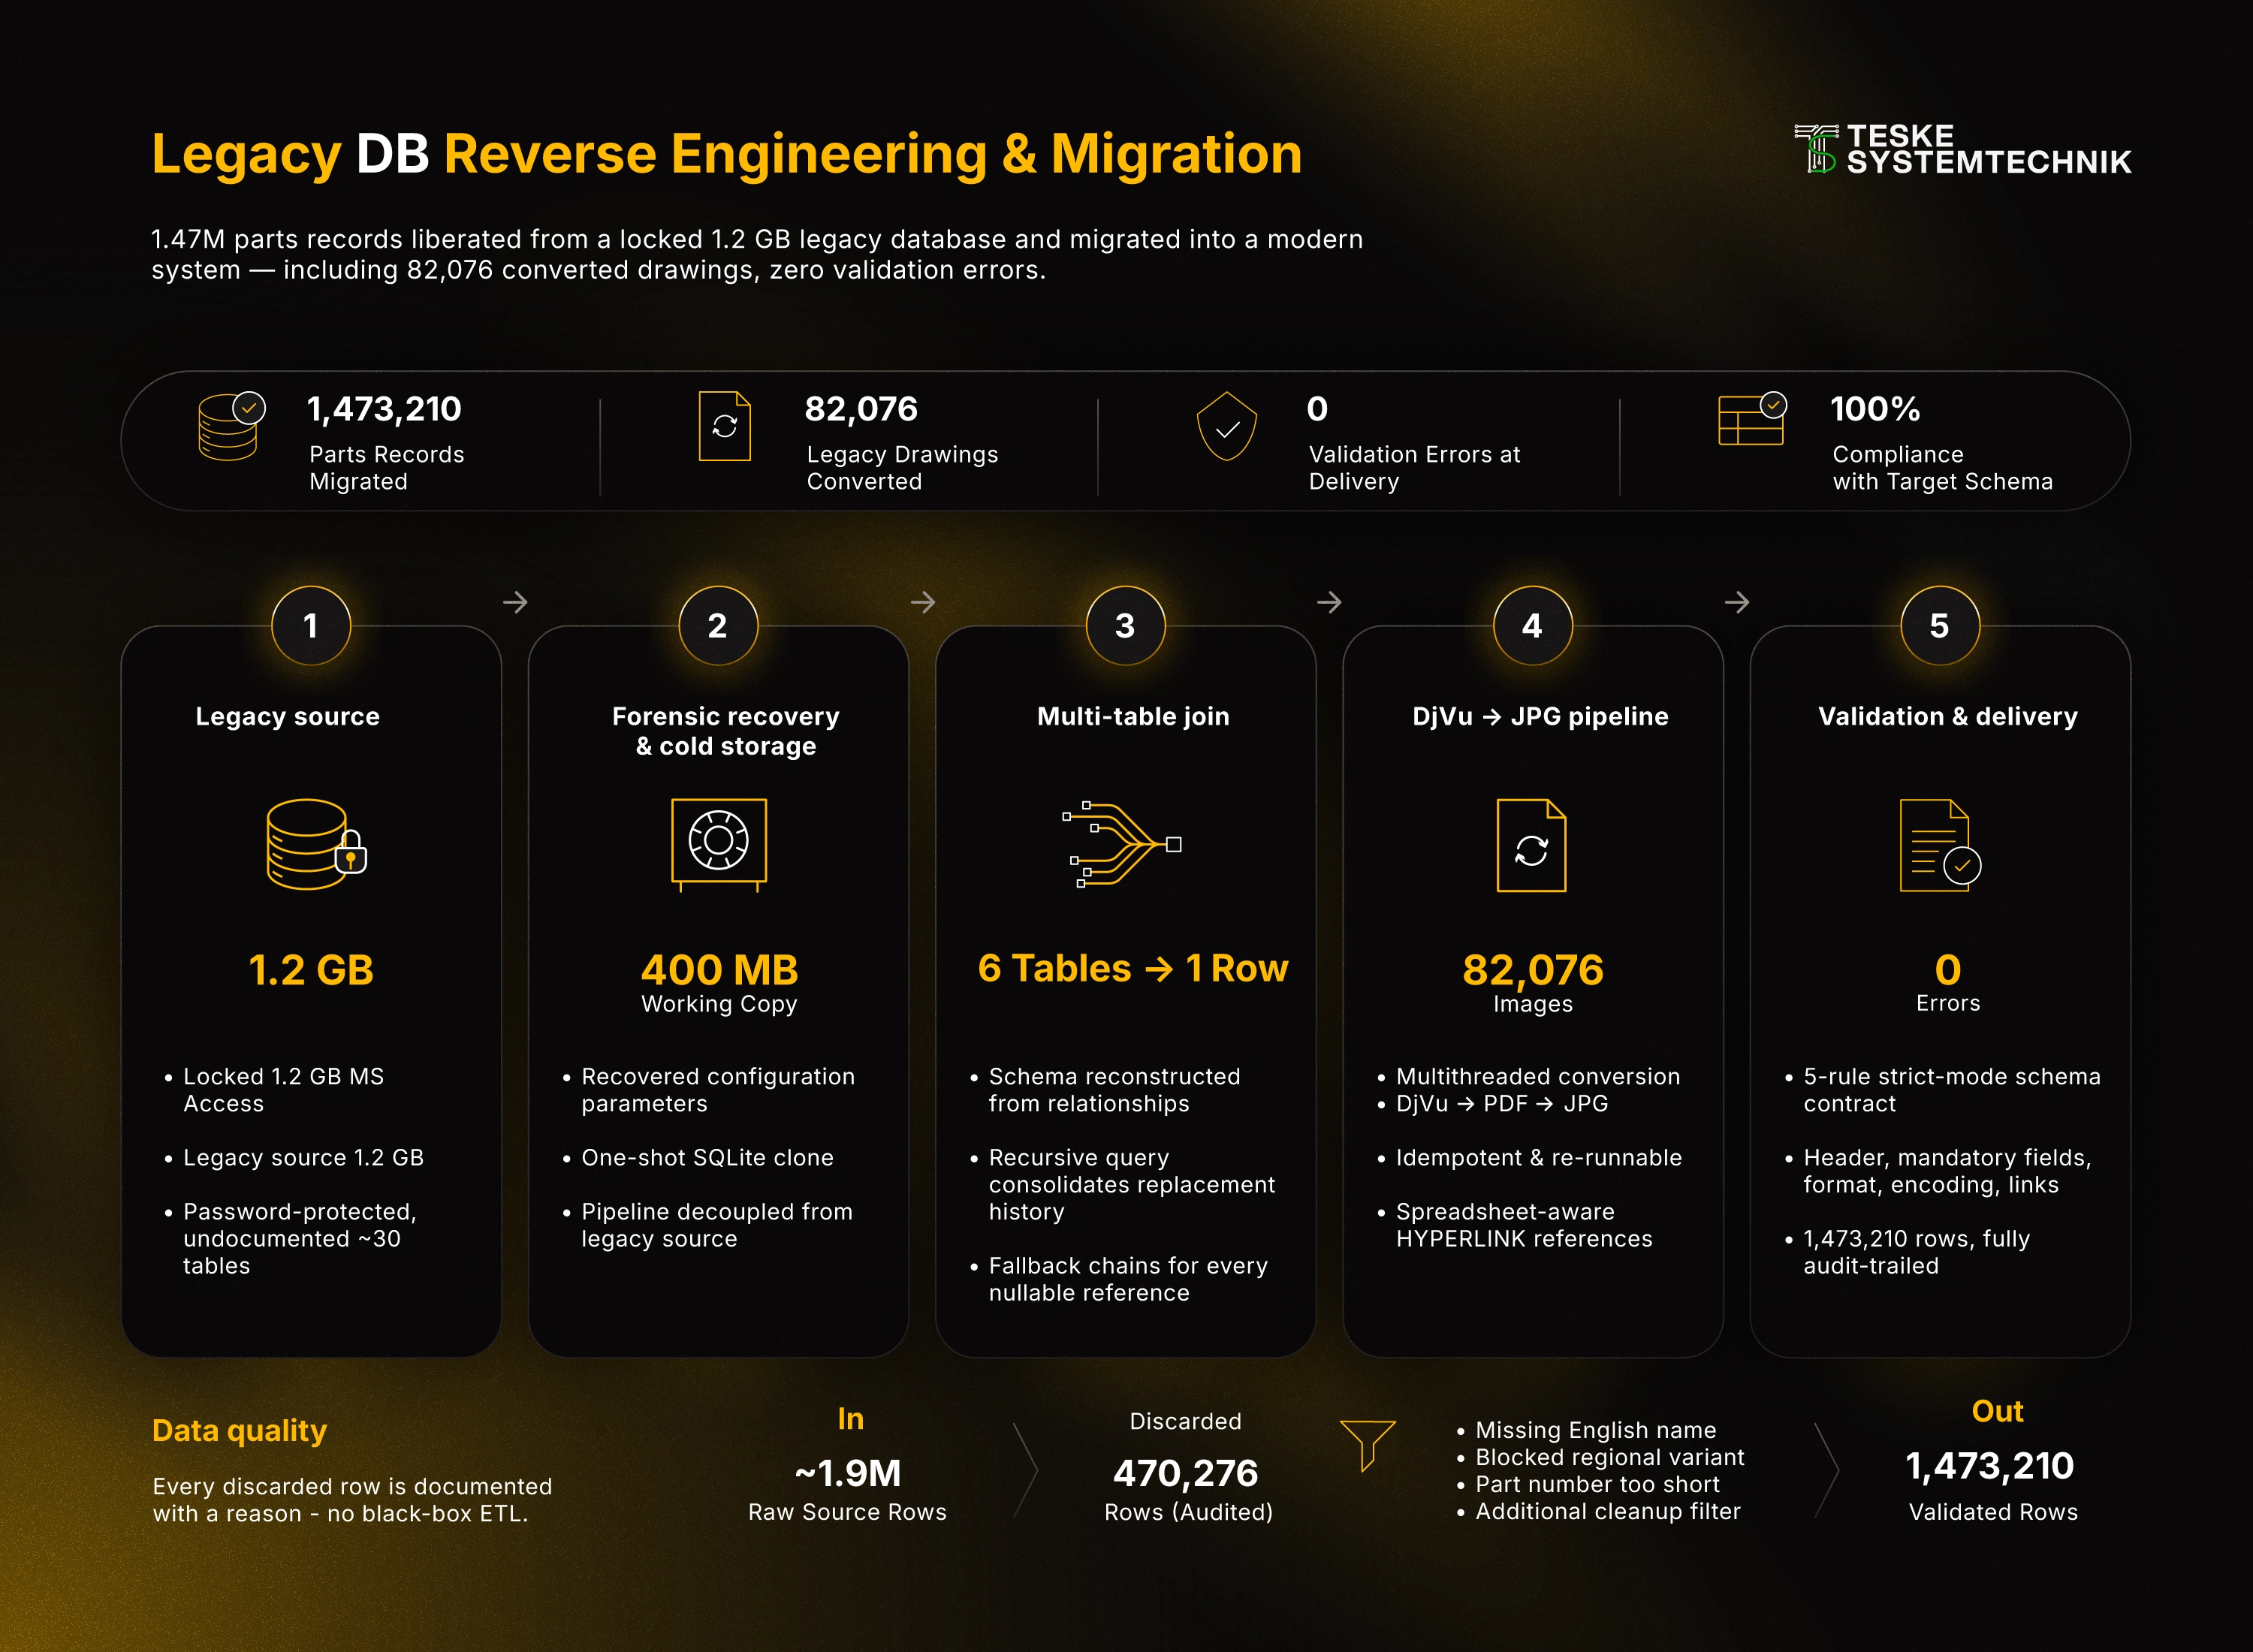
Legacy Database Reverse Engineering & Migration
This infographic presents the migration of a legacy database containing more than 1.4 million records and over 82,000 converted drawings.
The challenge was organizing a complex migration process into a clear sequence. The final structure guides the viewer from the original database through recovery, reconstruction, conversion, and validation, while also showing what happened to the data along the way.

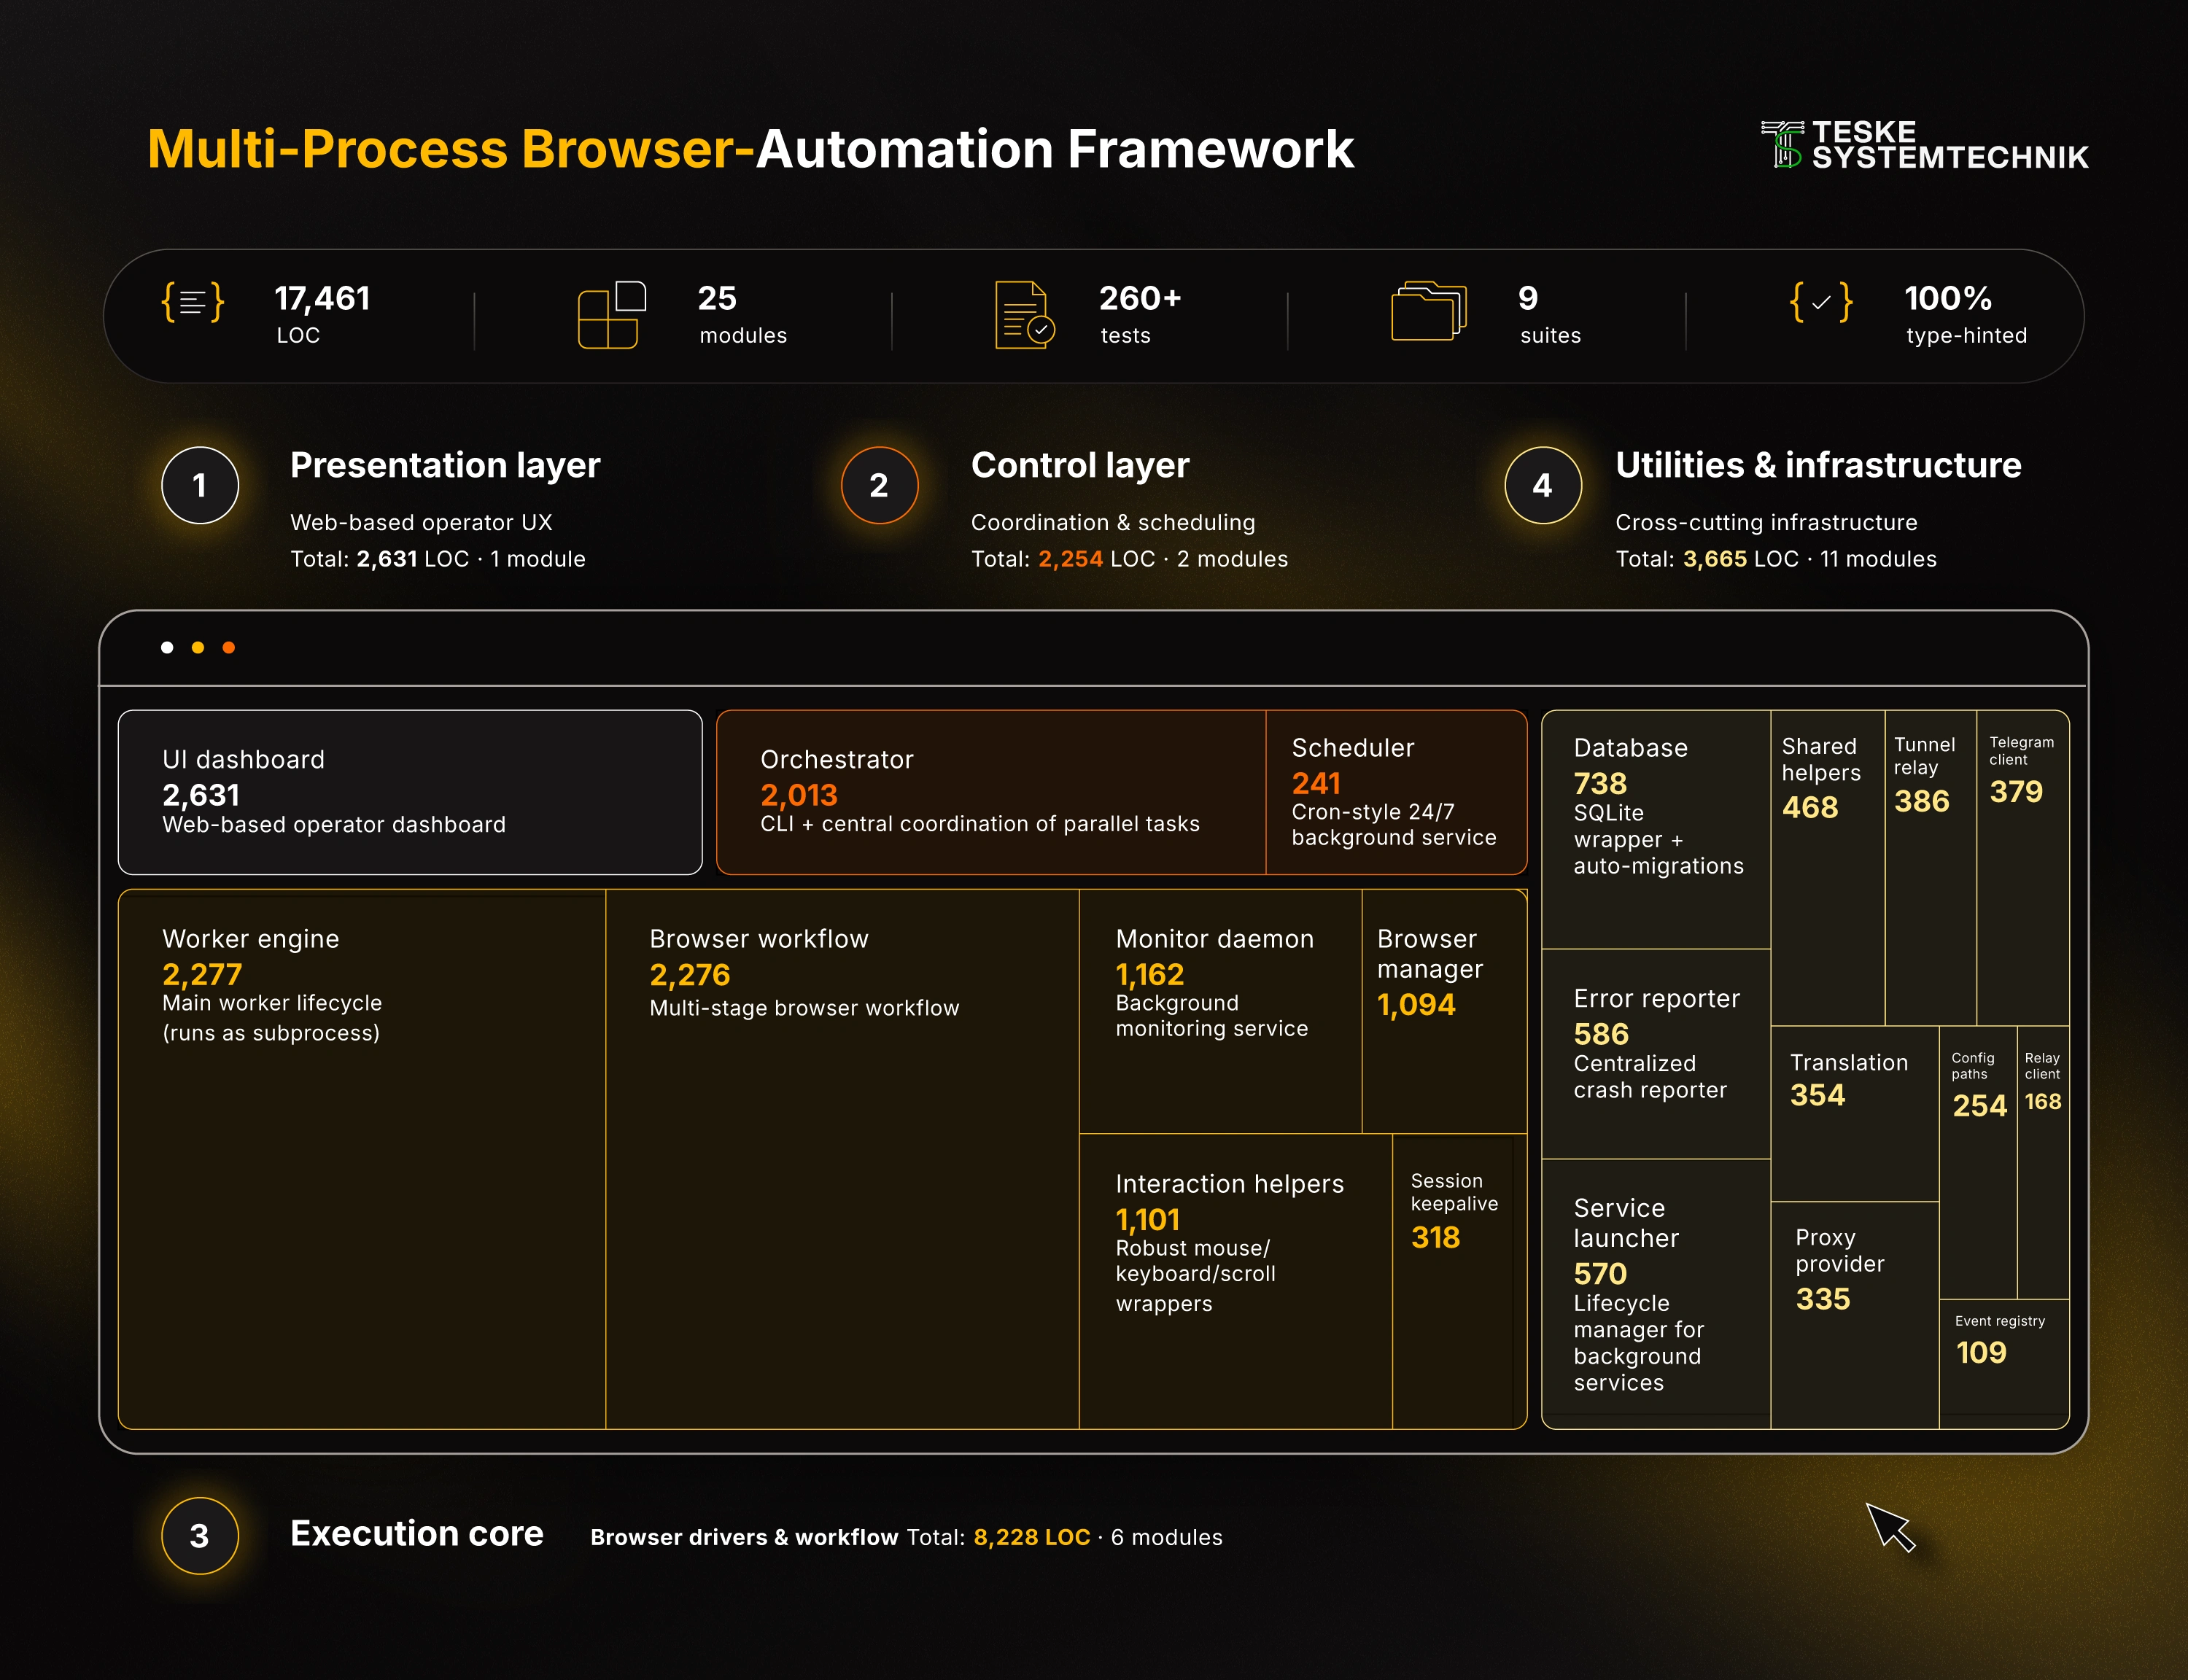
Multi-Process Browser-Automation Framework
This infographic maps the architecture of a browser-automation framework across its main layers and modules.
The challenge was showing the scale and internal structure of the system without reducing it to a generic architecture diagram. The final composition combines the high-level layers with a detailed view of the individual modules, allowing the viewer to understand both the overall system and how its parts fit together.
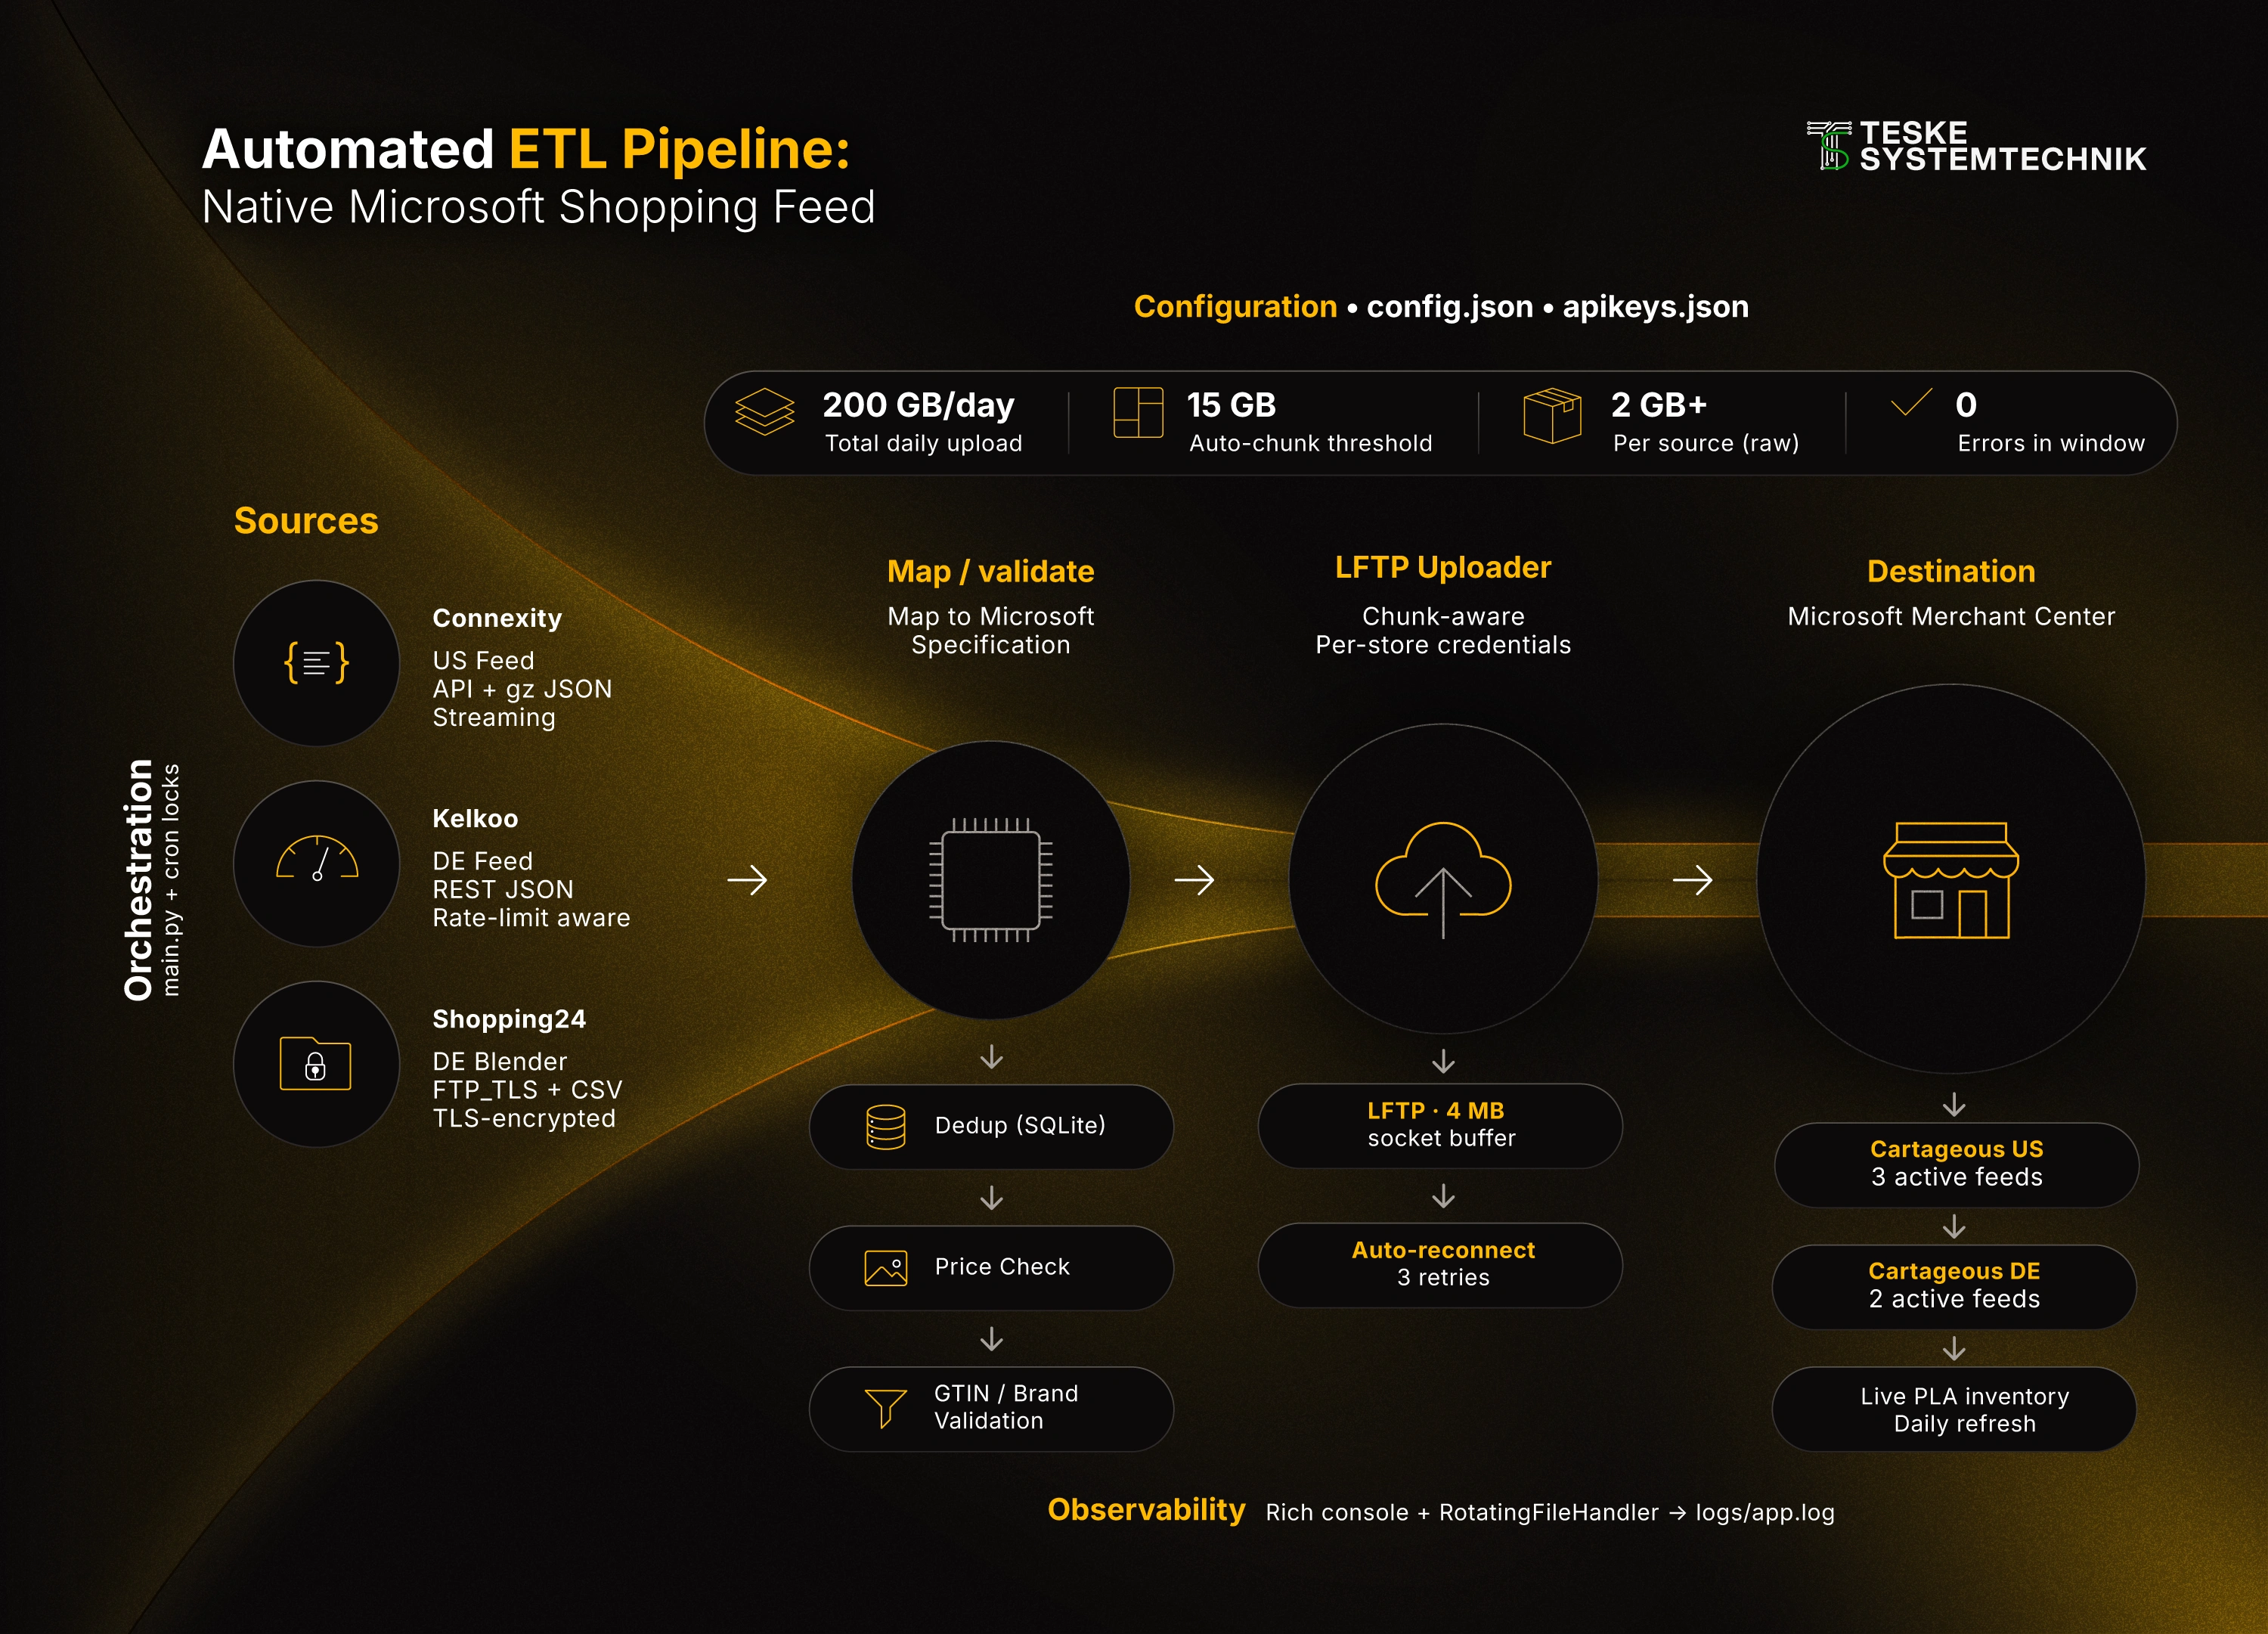
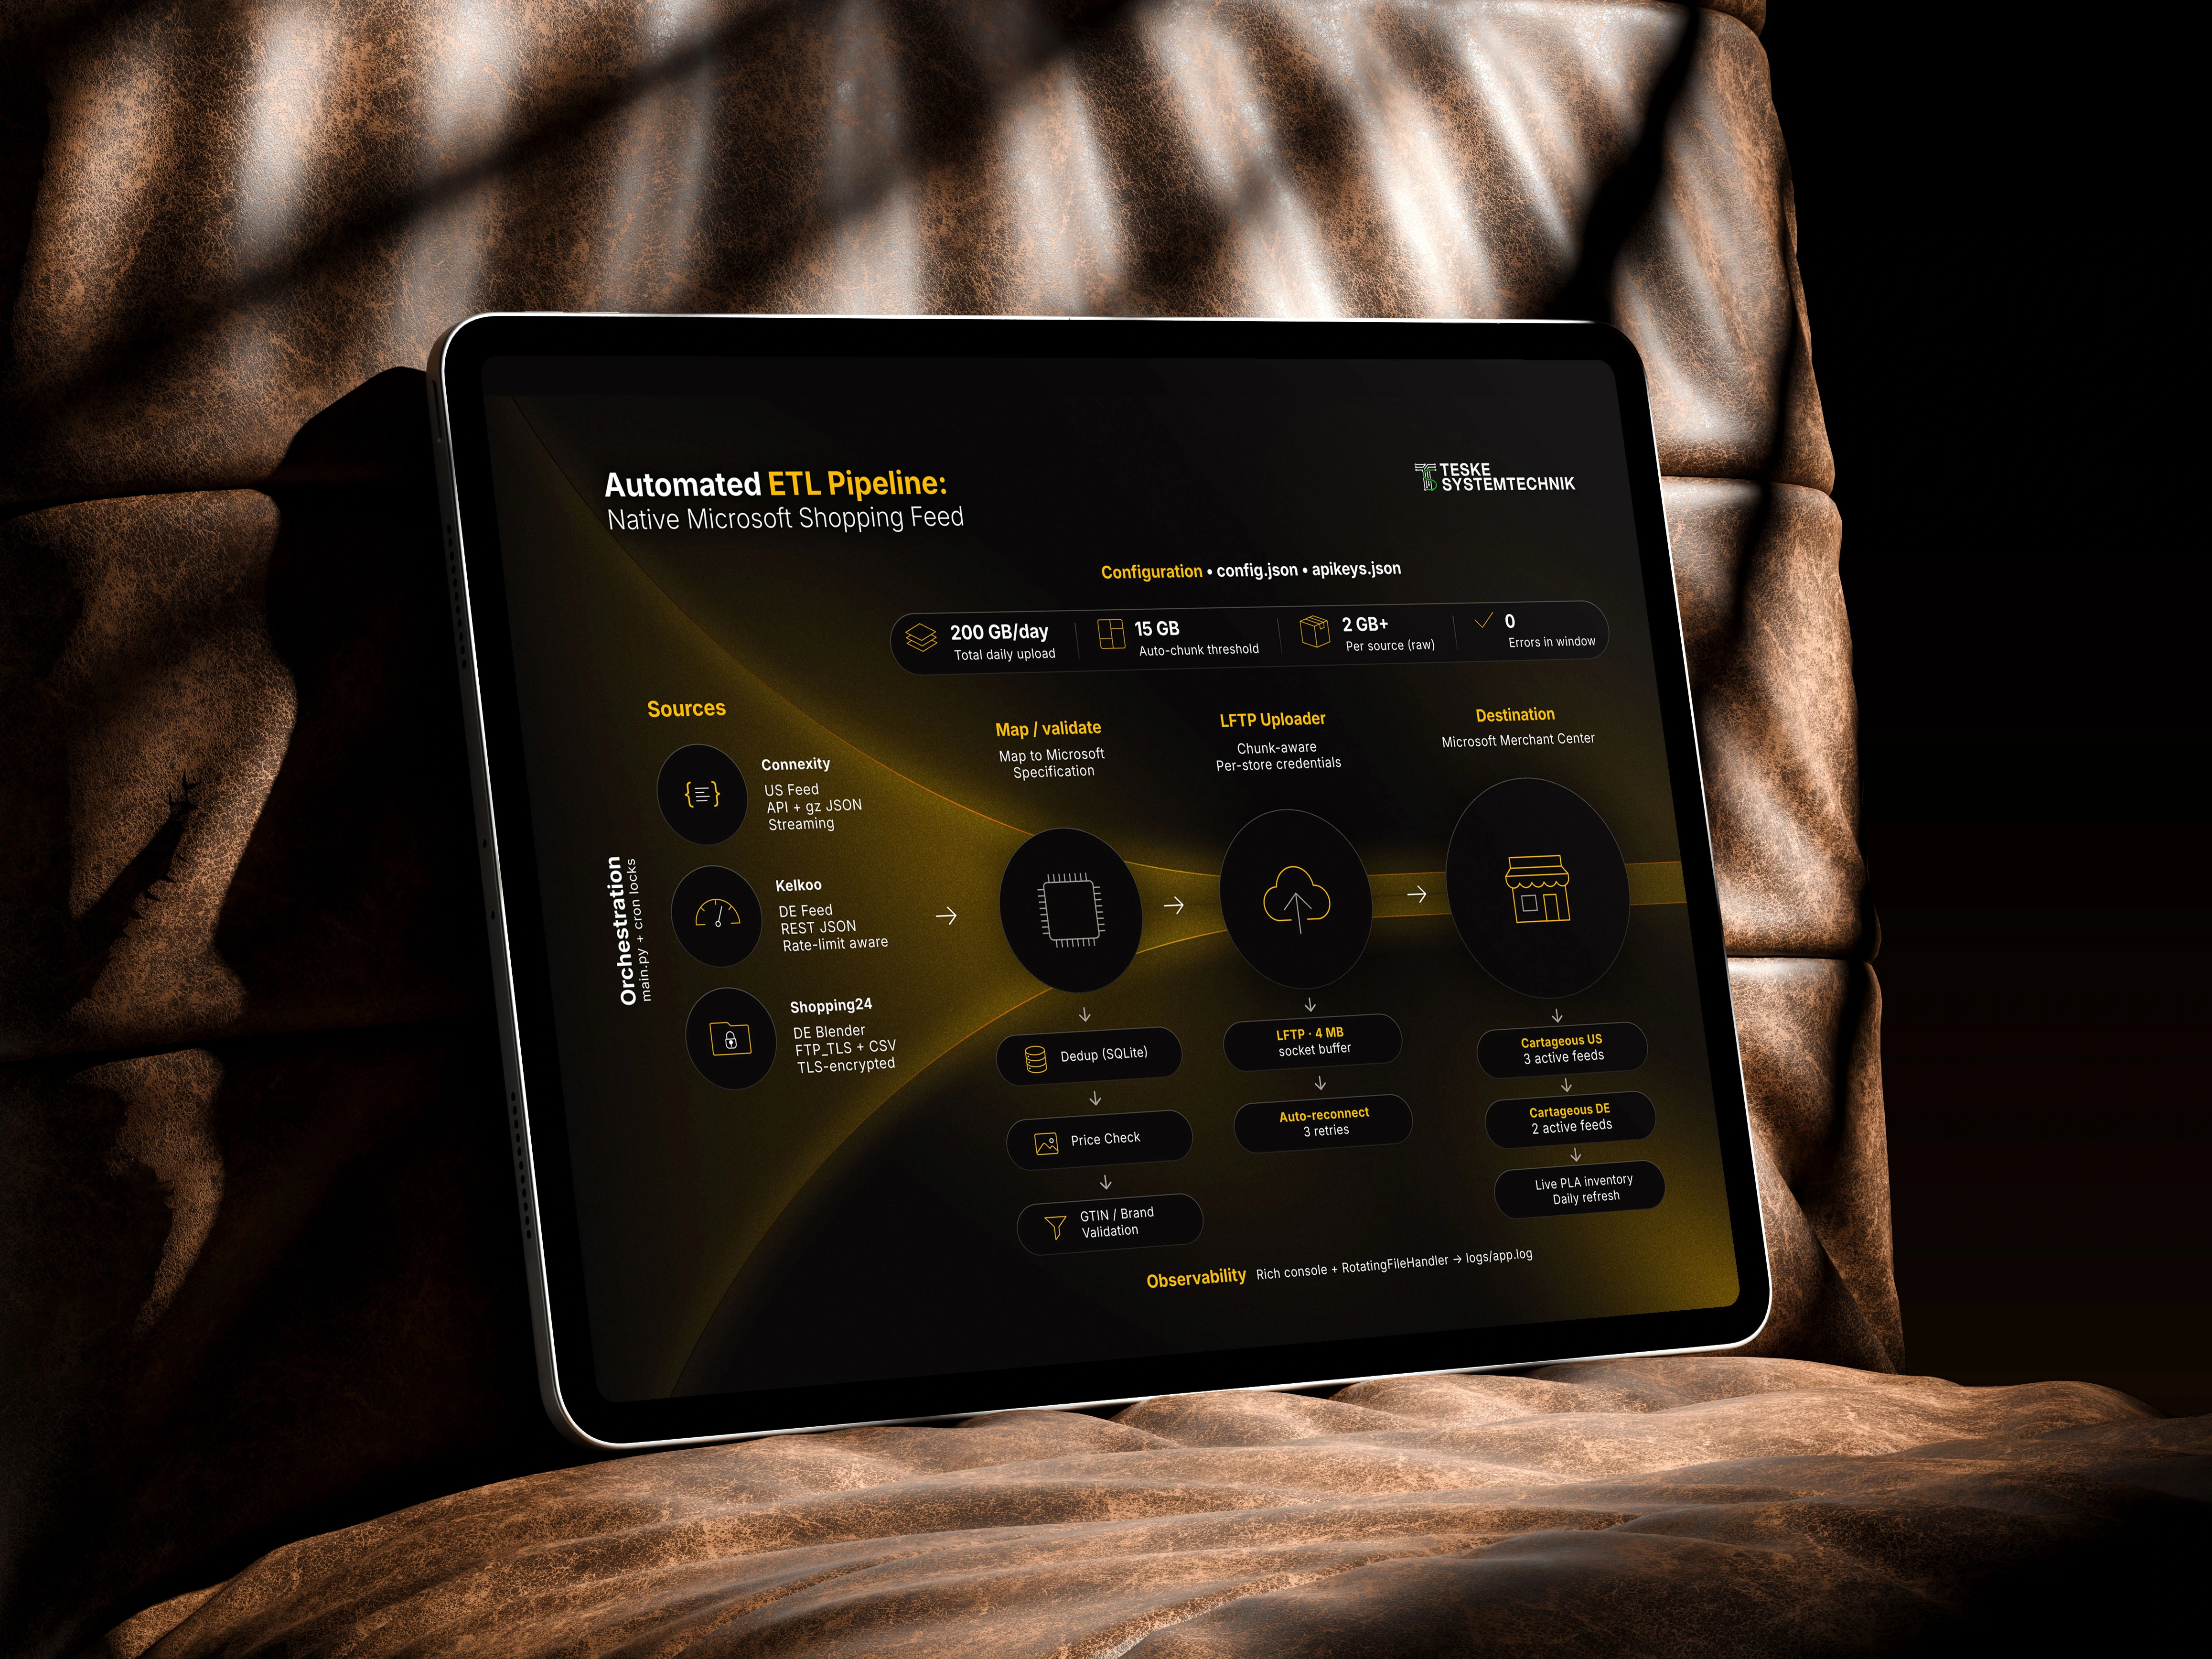
Automated ETL Pipeline
This infographic explains how multiple data sources move through an automated pipeline before reaching Microsoft Merchant Center.
The main challenge was showing several parallel processes, validation steps, and system behaviors without turning the diagram into a linear wall of information. The final structure separates the sources, processing stages, supporting functions, and final destinations while keeping the overall flow easy to follow.
Like this project
Posted Jul 24, 2026
A series of technical infographics for German web development company Teske Systemtechnik, translating complex systems into clear visuals.
Likes
0
Views
4