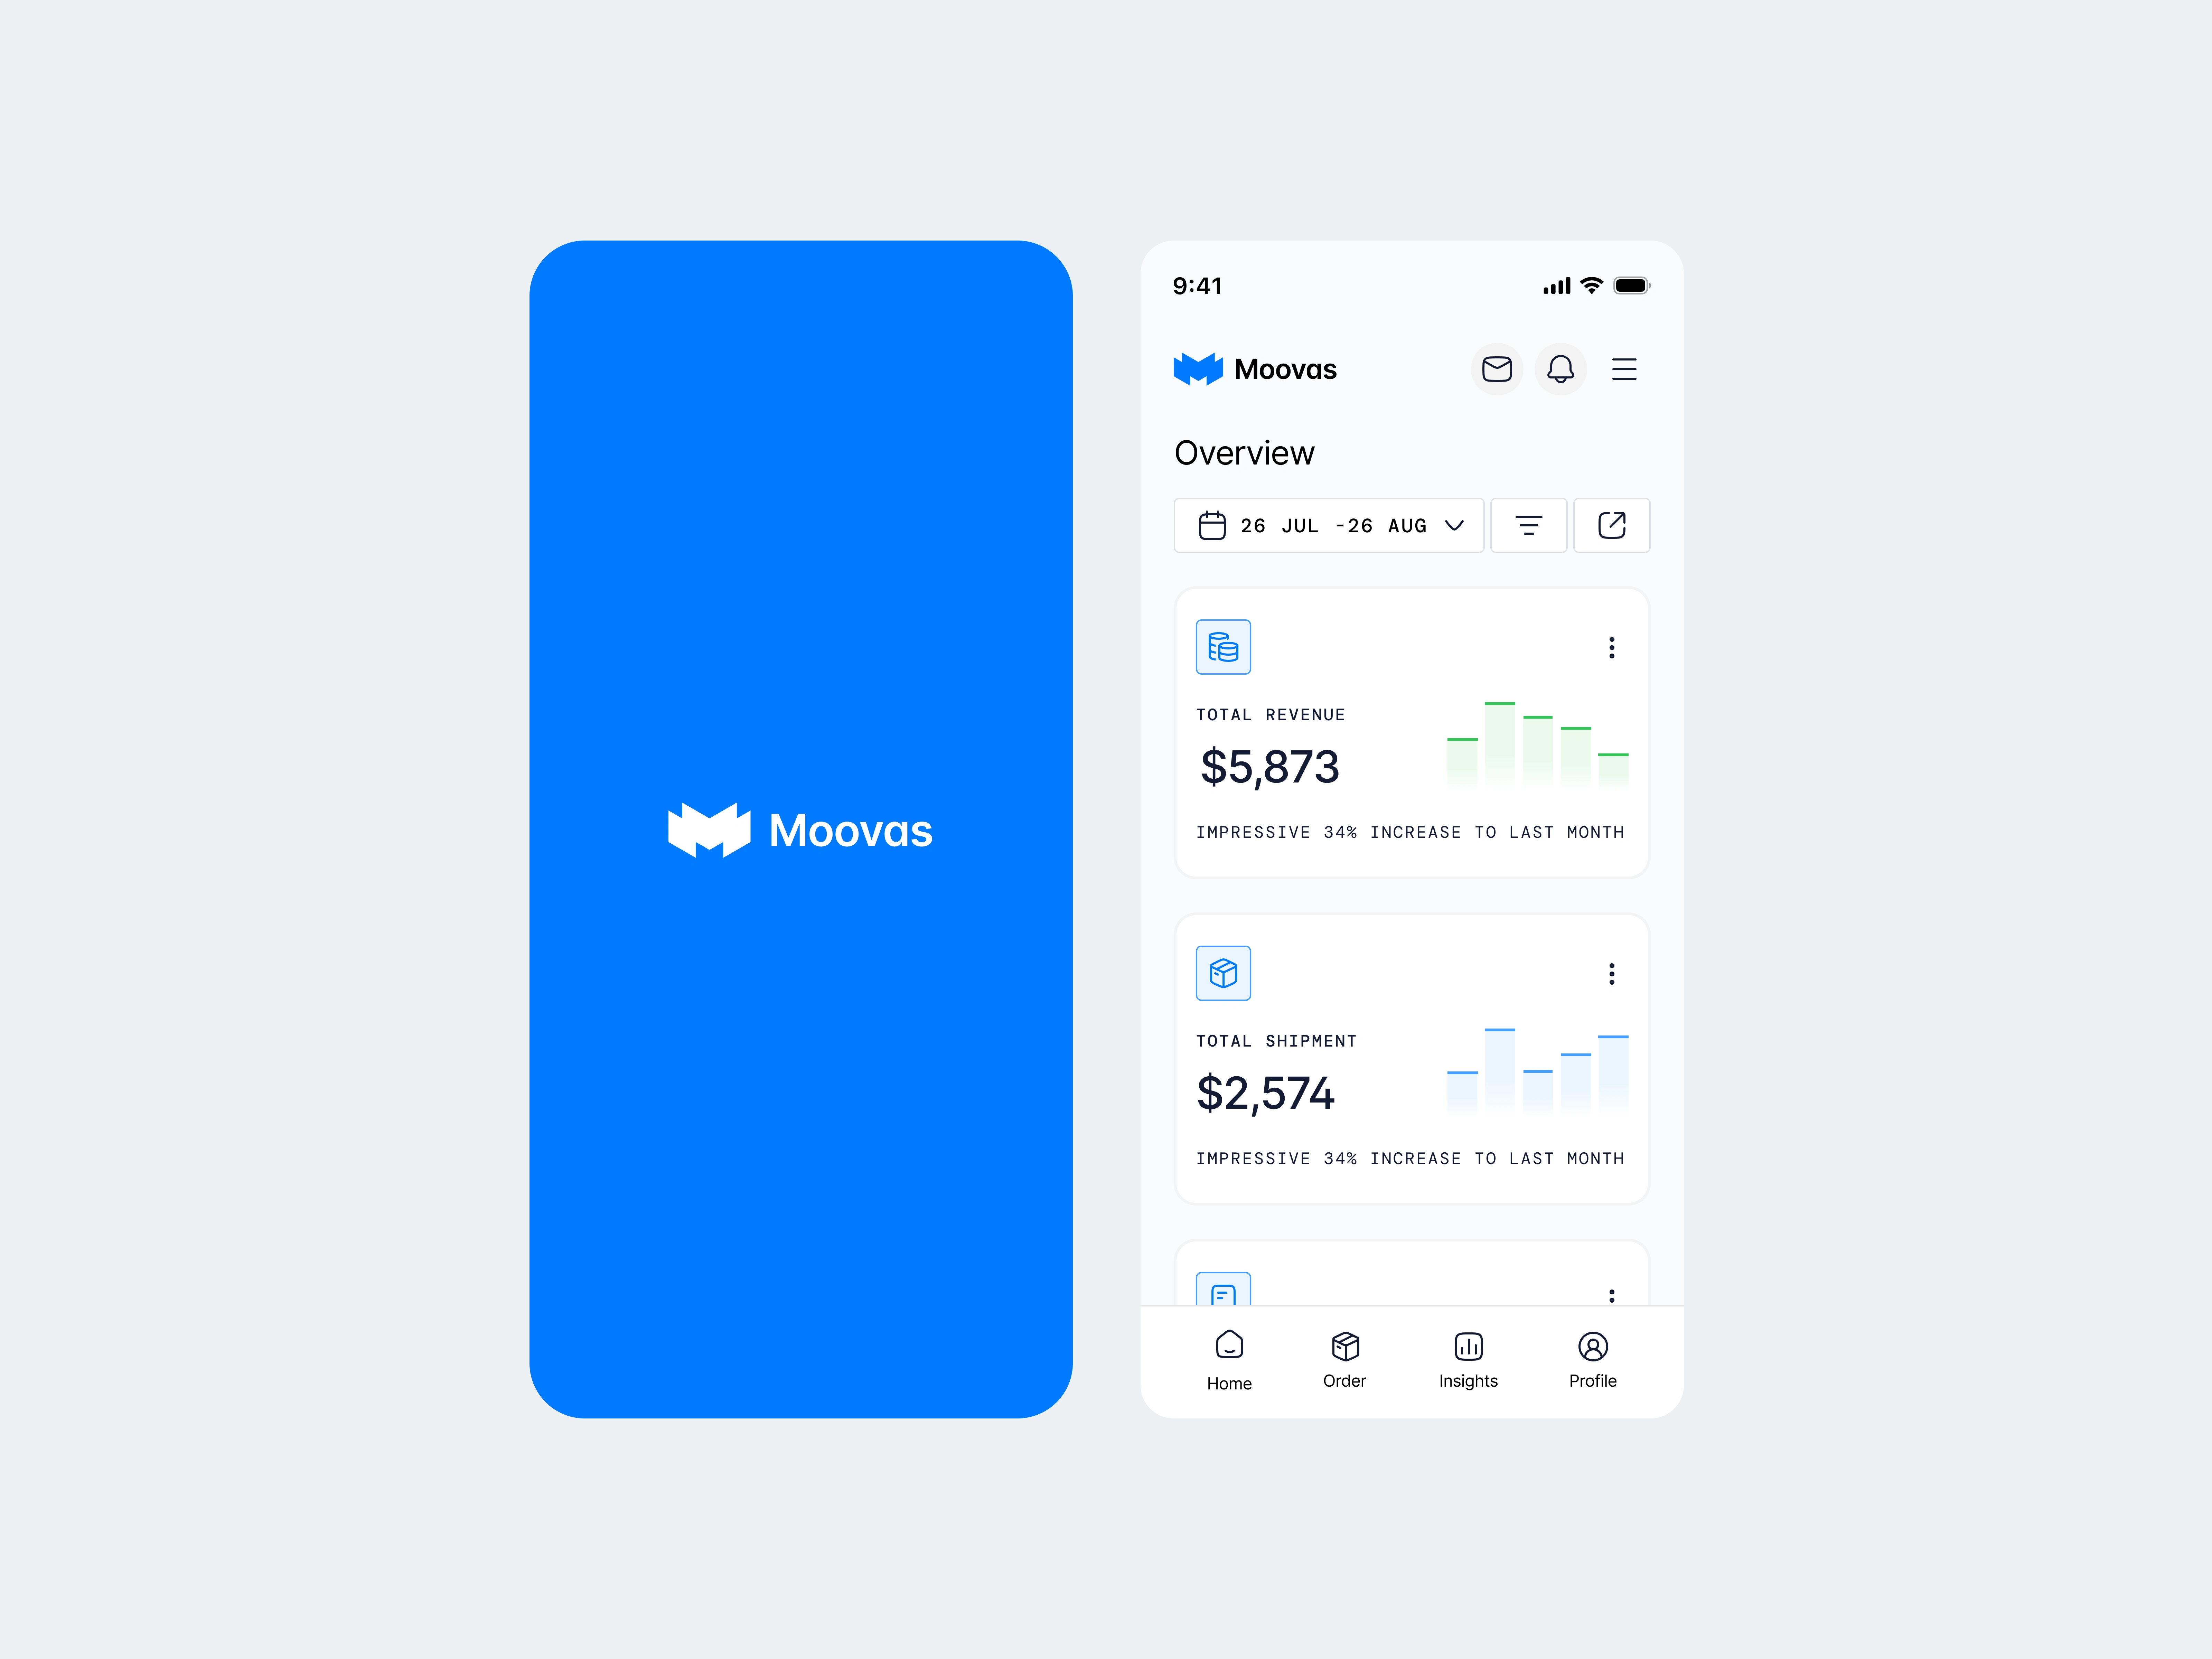
Supply Chain Management Dashboard Concept

Kelechi Imorji

Supply Chain Management Dashboard (Concept)
Role: Product Designer
Timeline: 1 week
Type: Concept / Systems Design
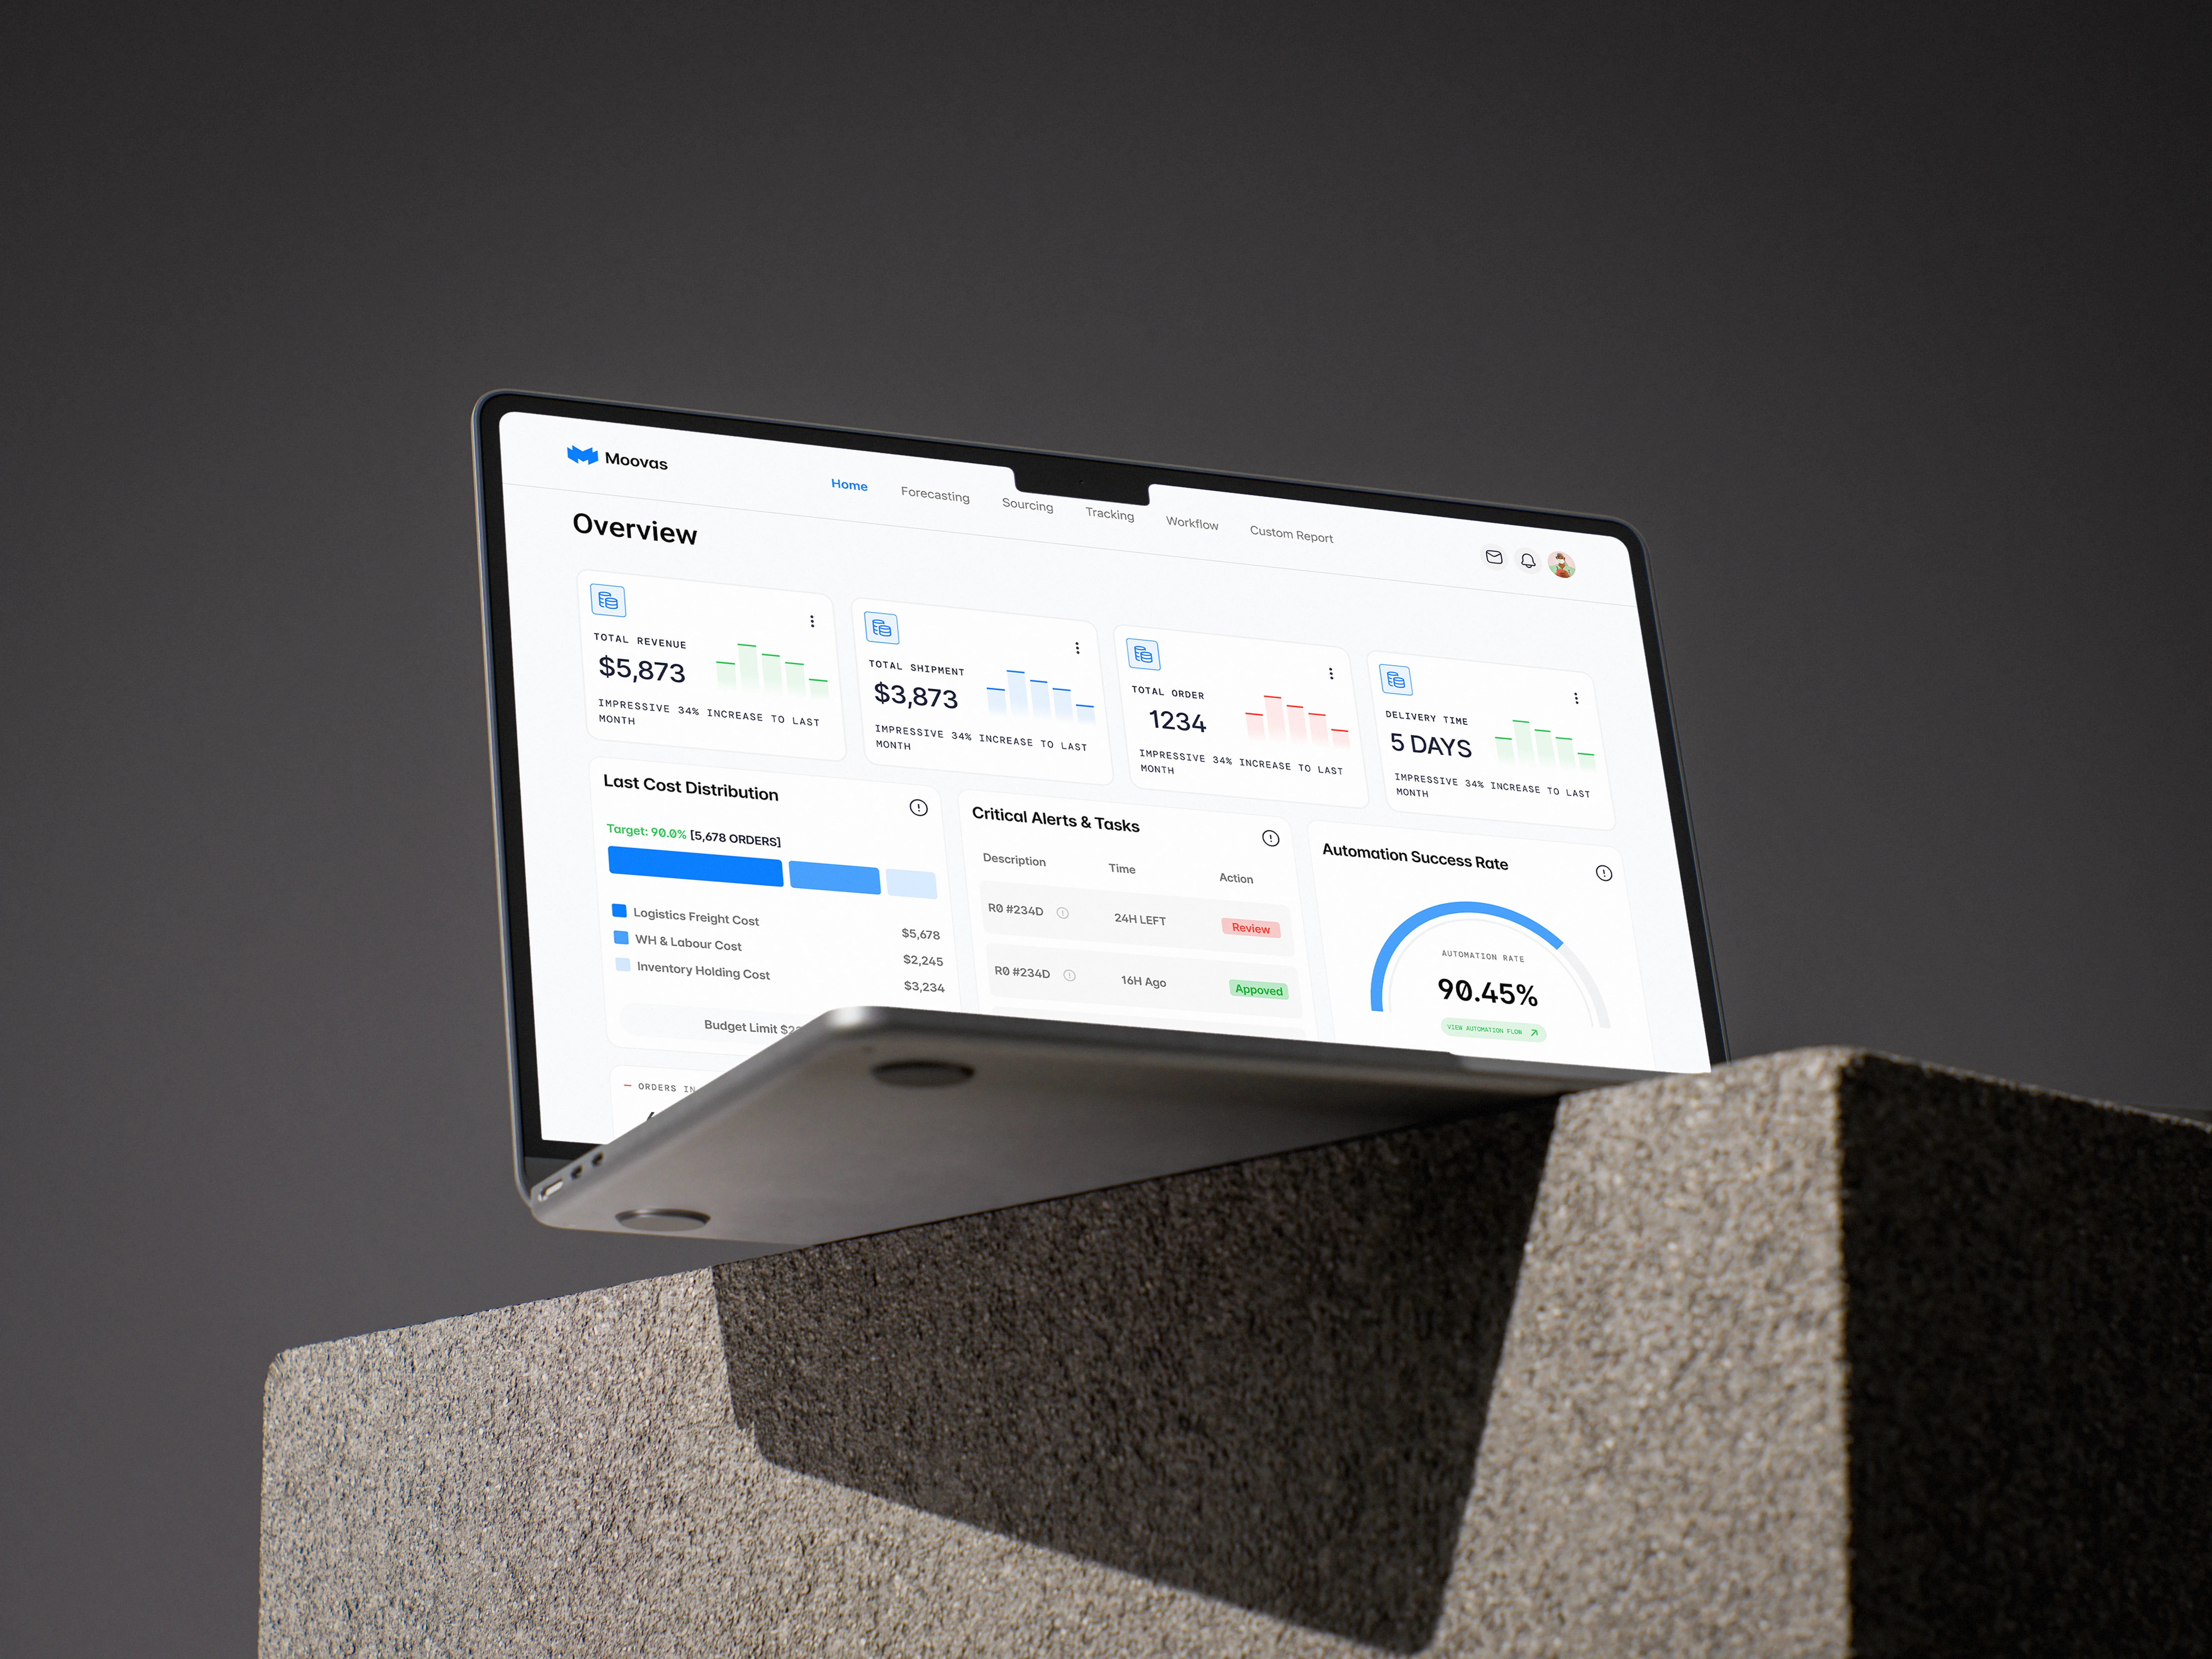
Problem
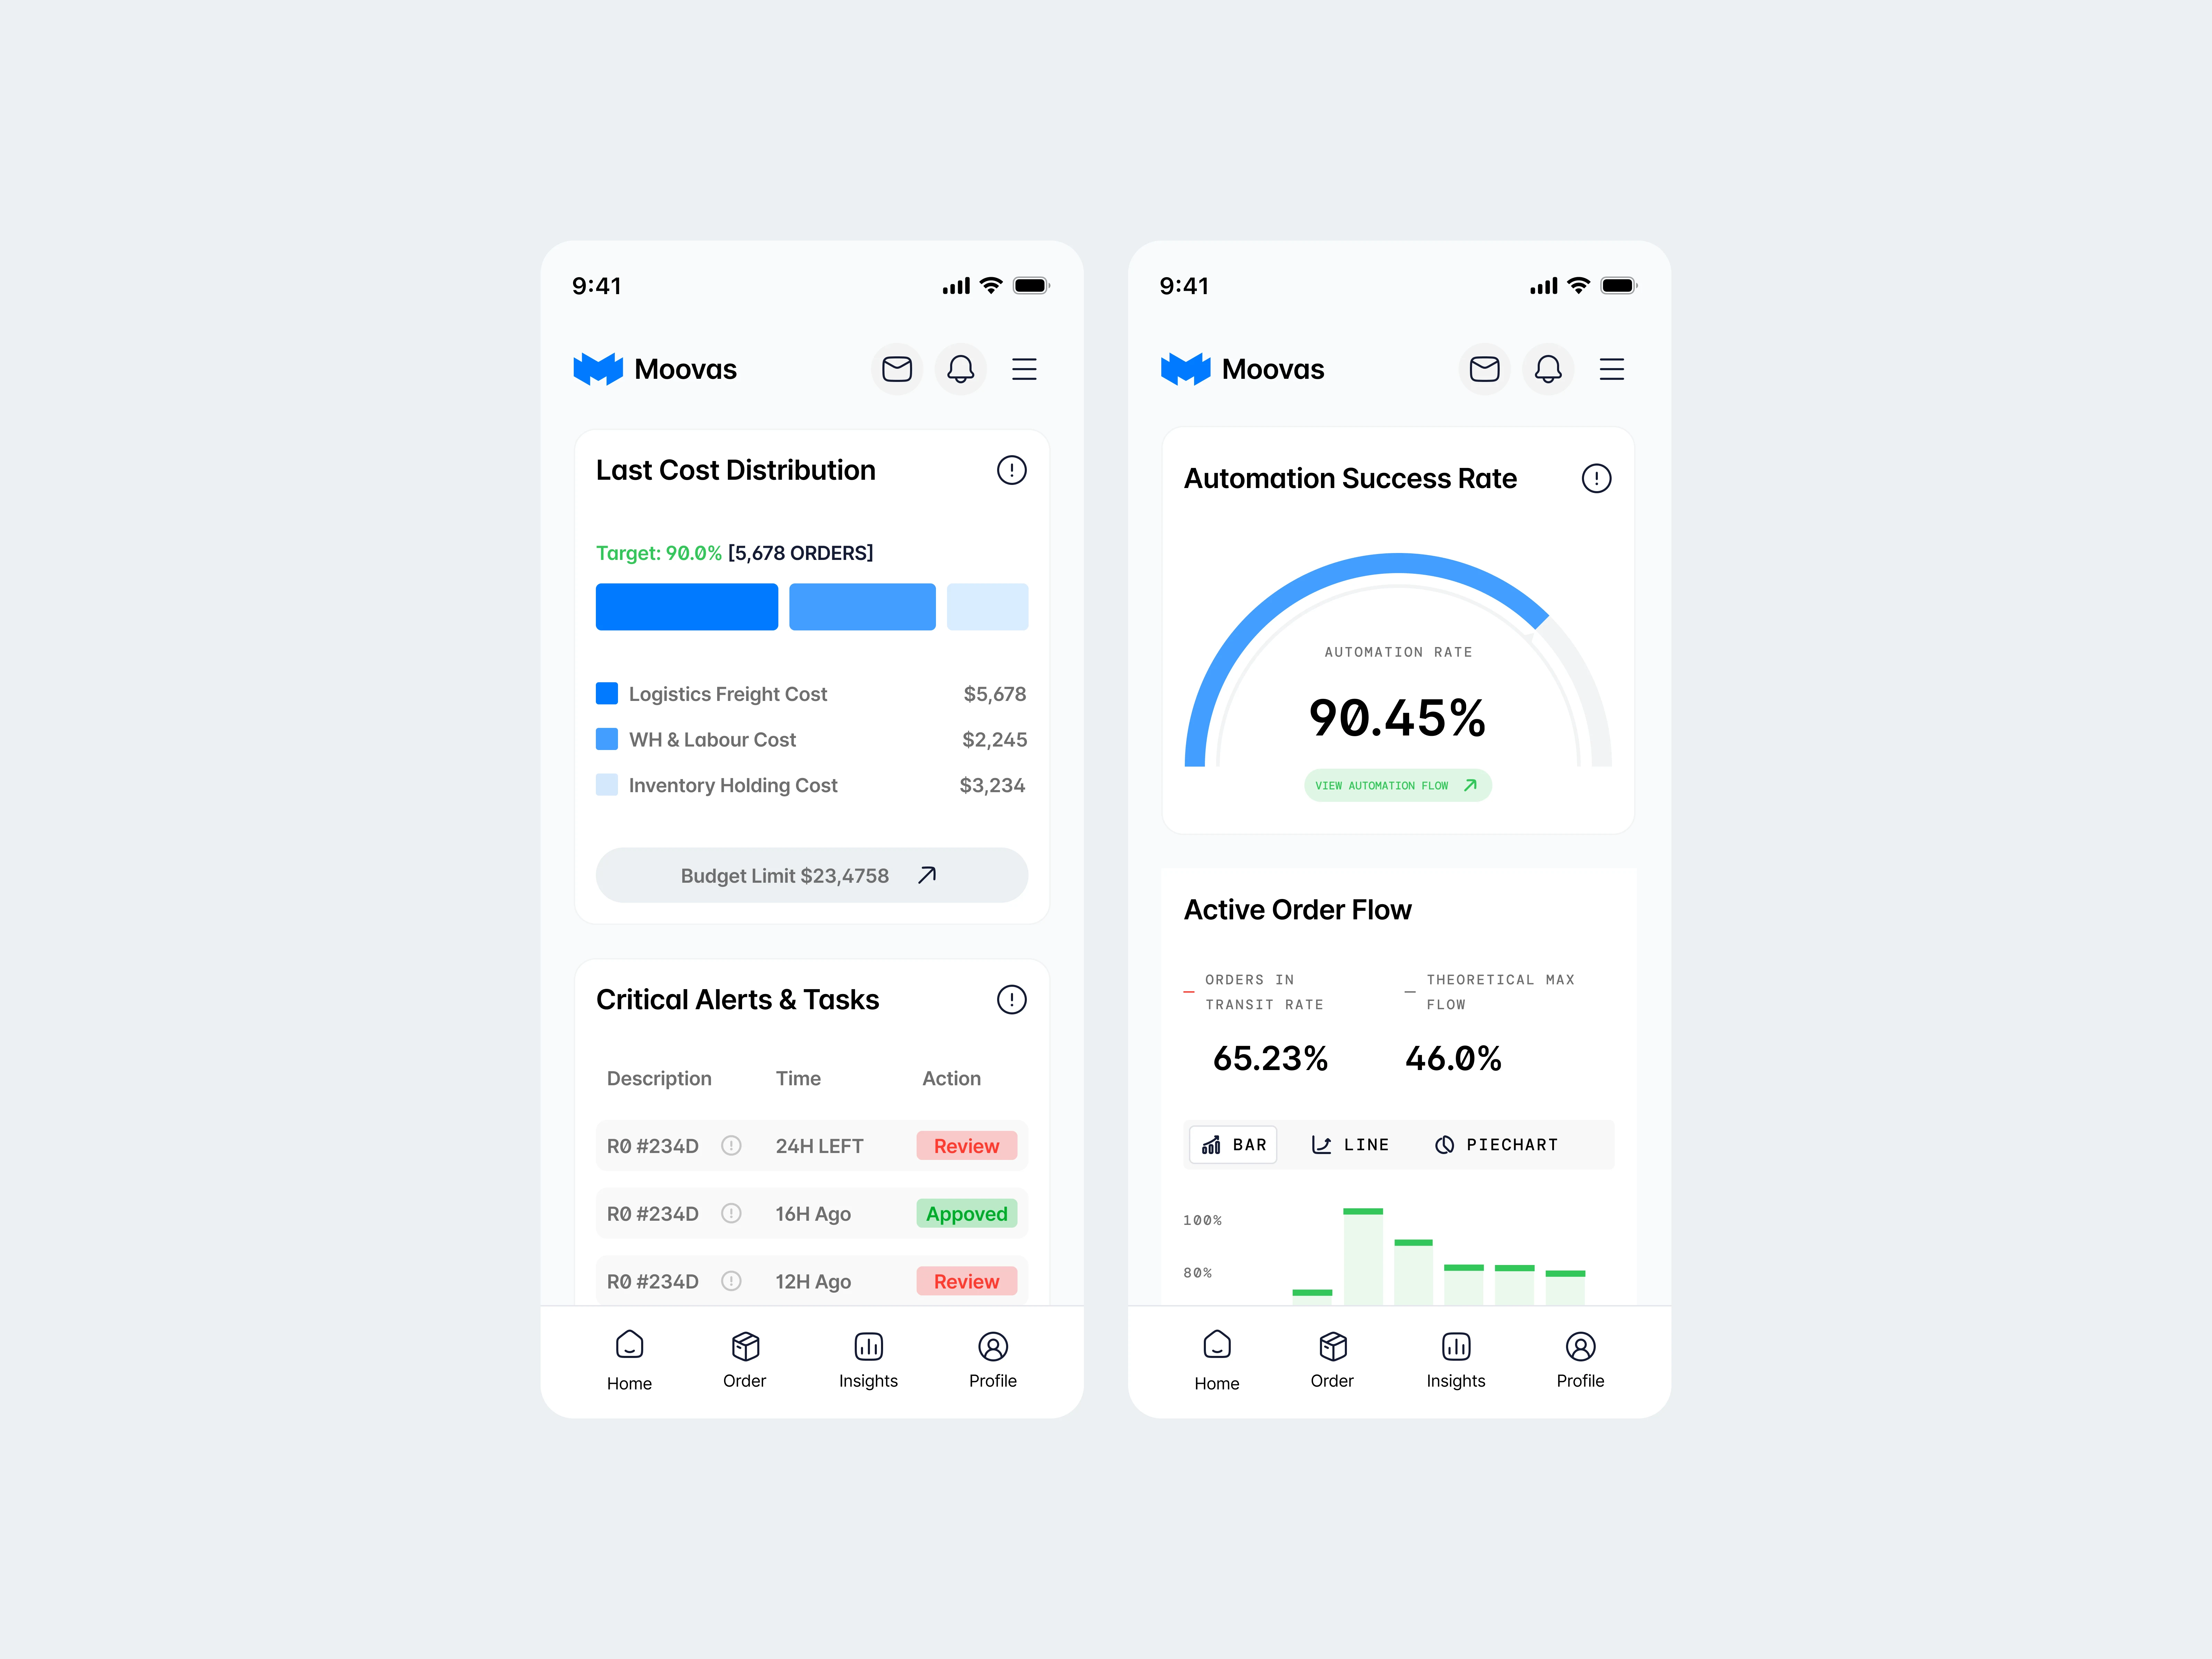
Supply chain operators work under pressure but are often forced to dig through dense dashboards to understand delays, inventory gaps, and operational risks. Most tools prioritize data volume over decision clarity.
Goal
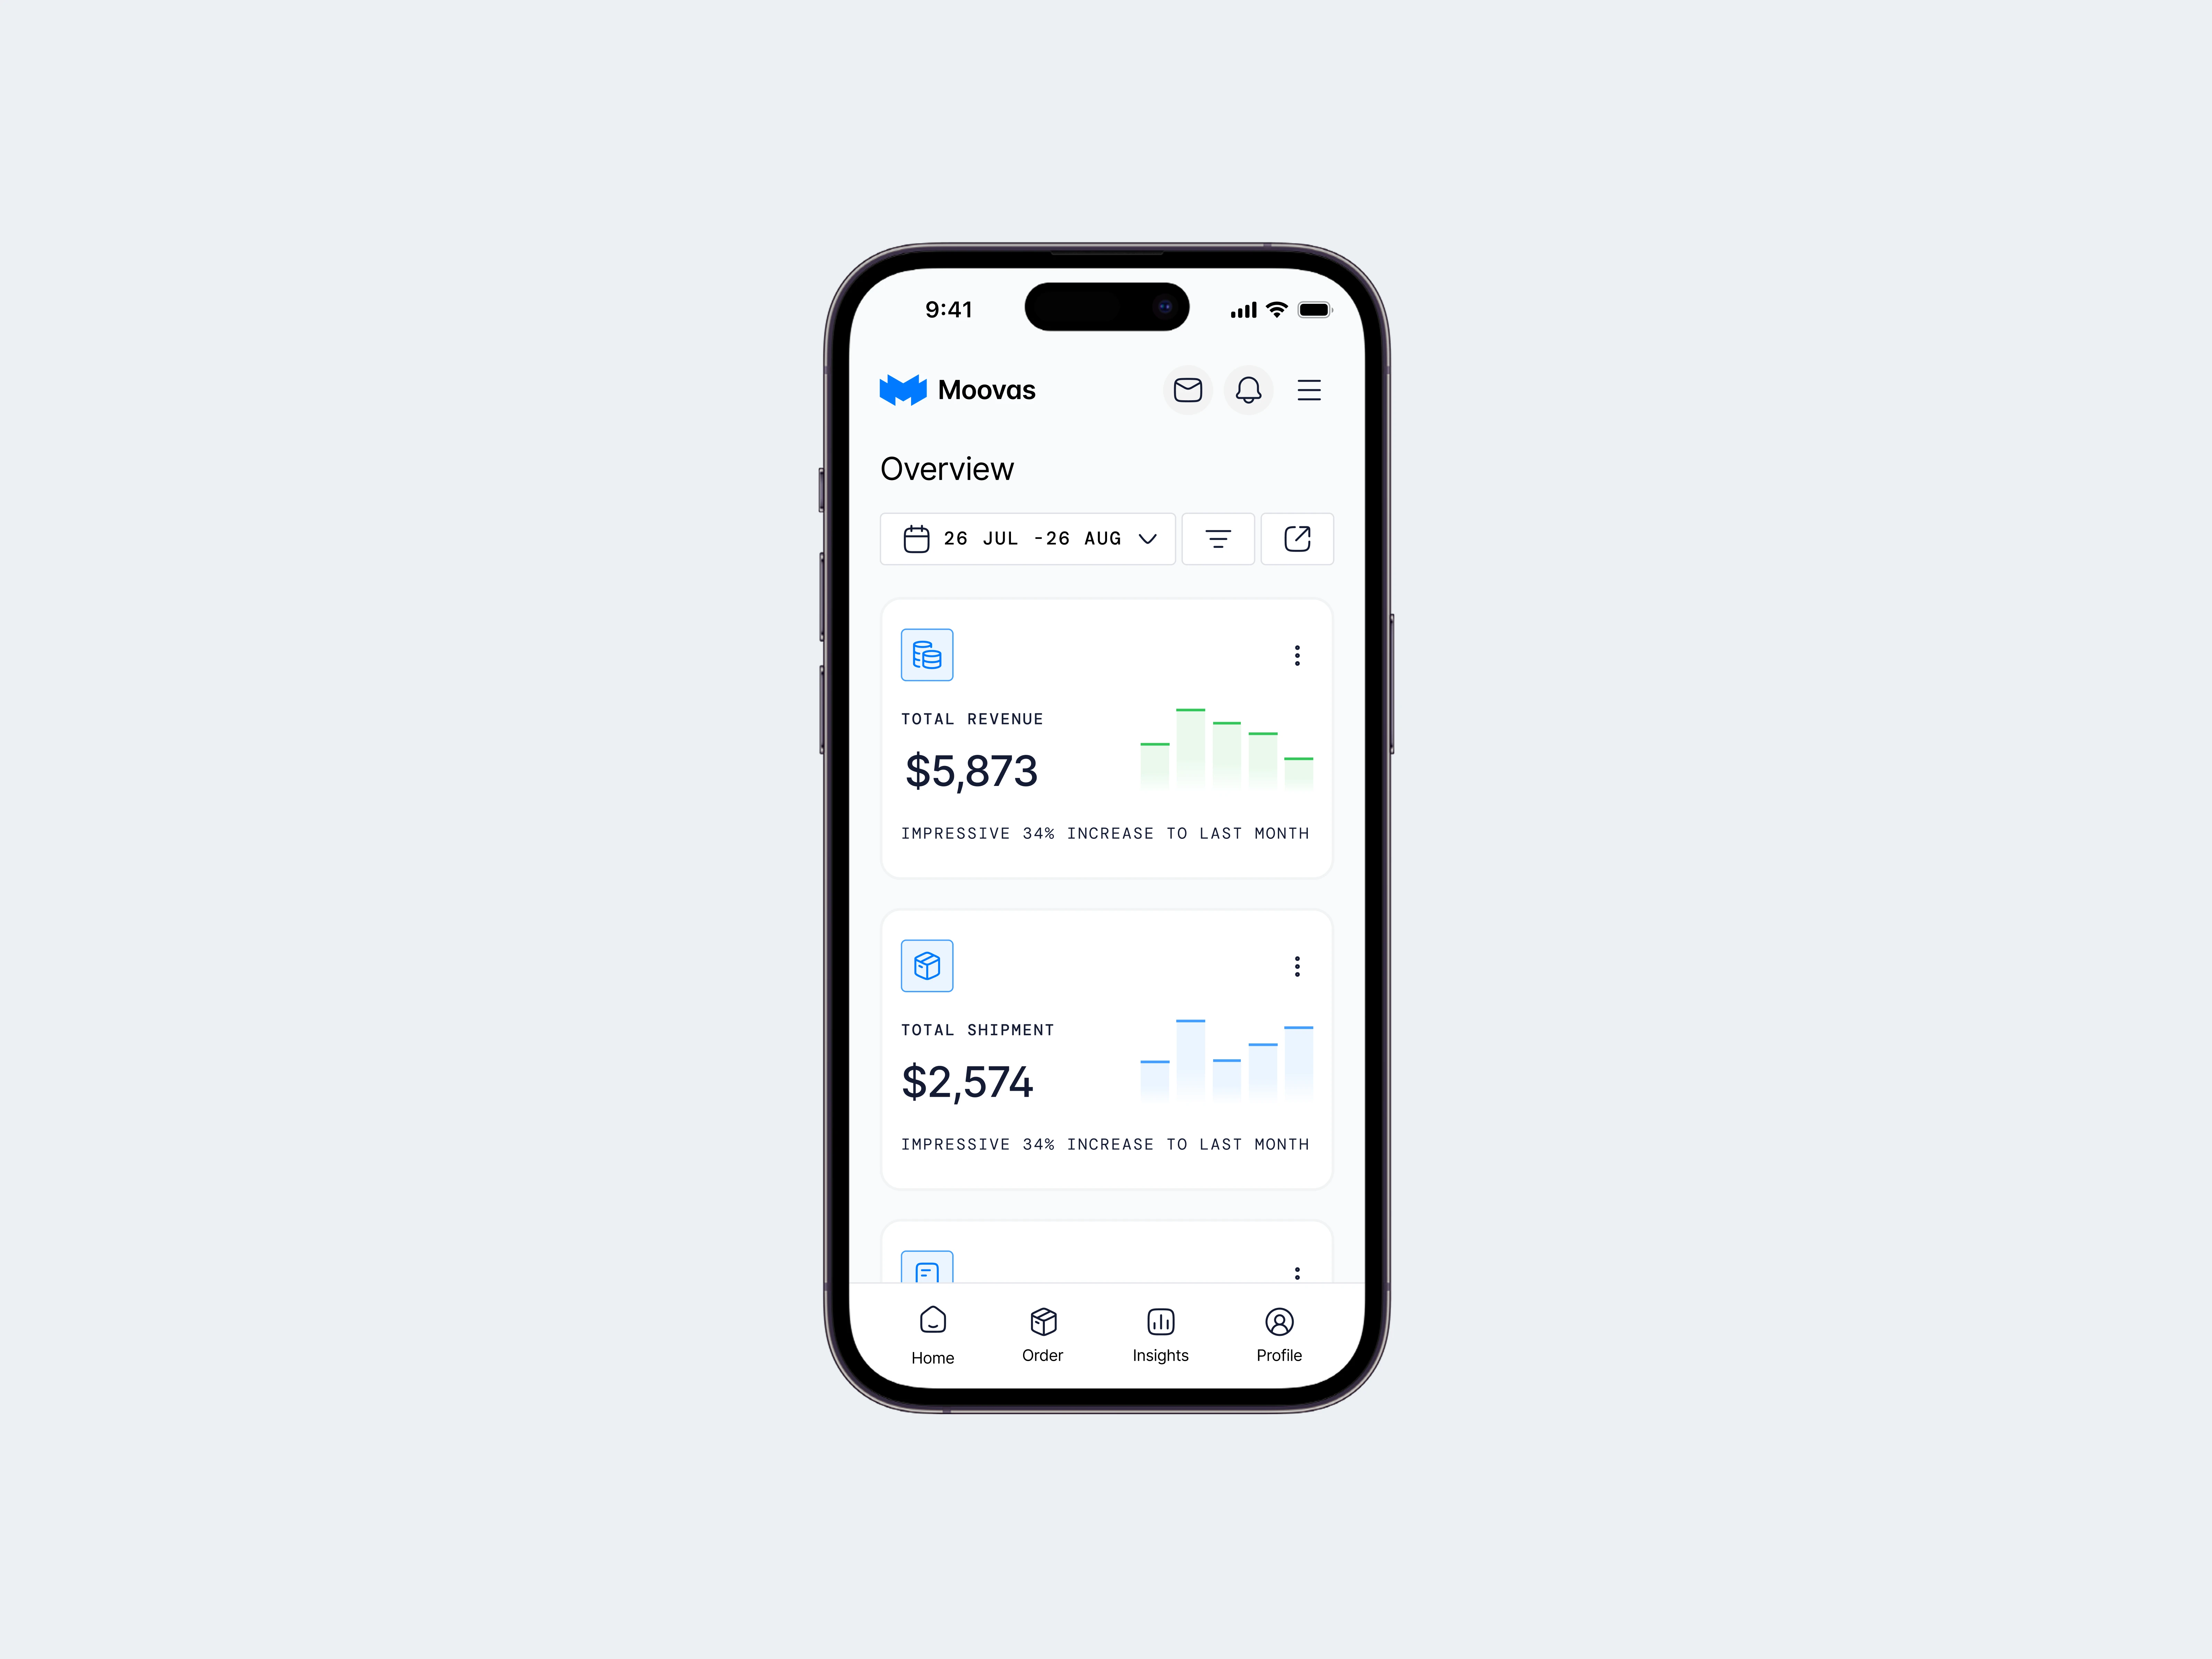
Design a supply chain dashboard that answers three questions in seconds:
1. What’s happening now?
2. What’s wrong?
3. What action should be taken?
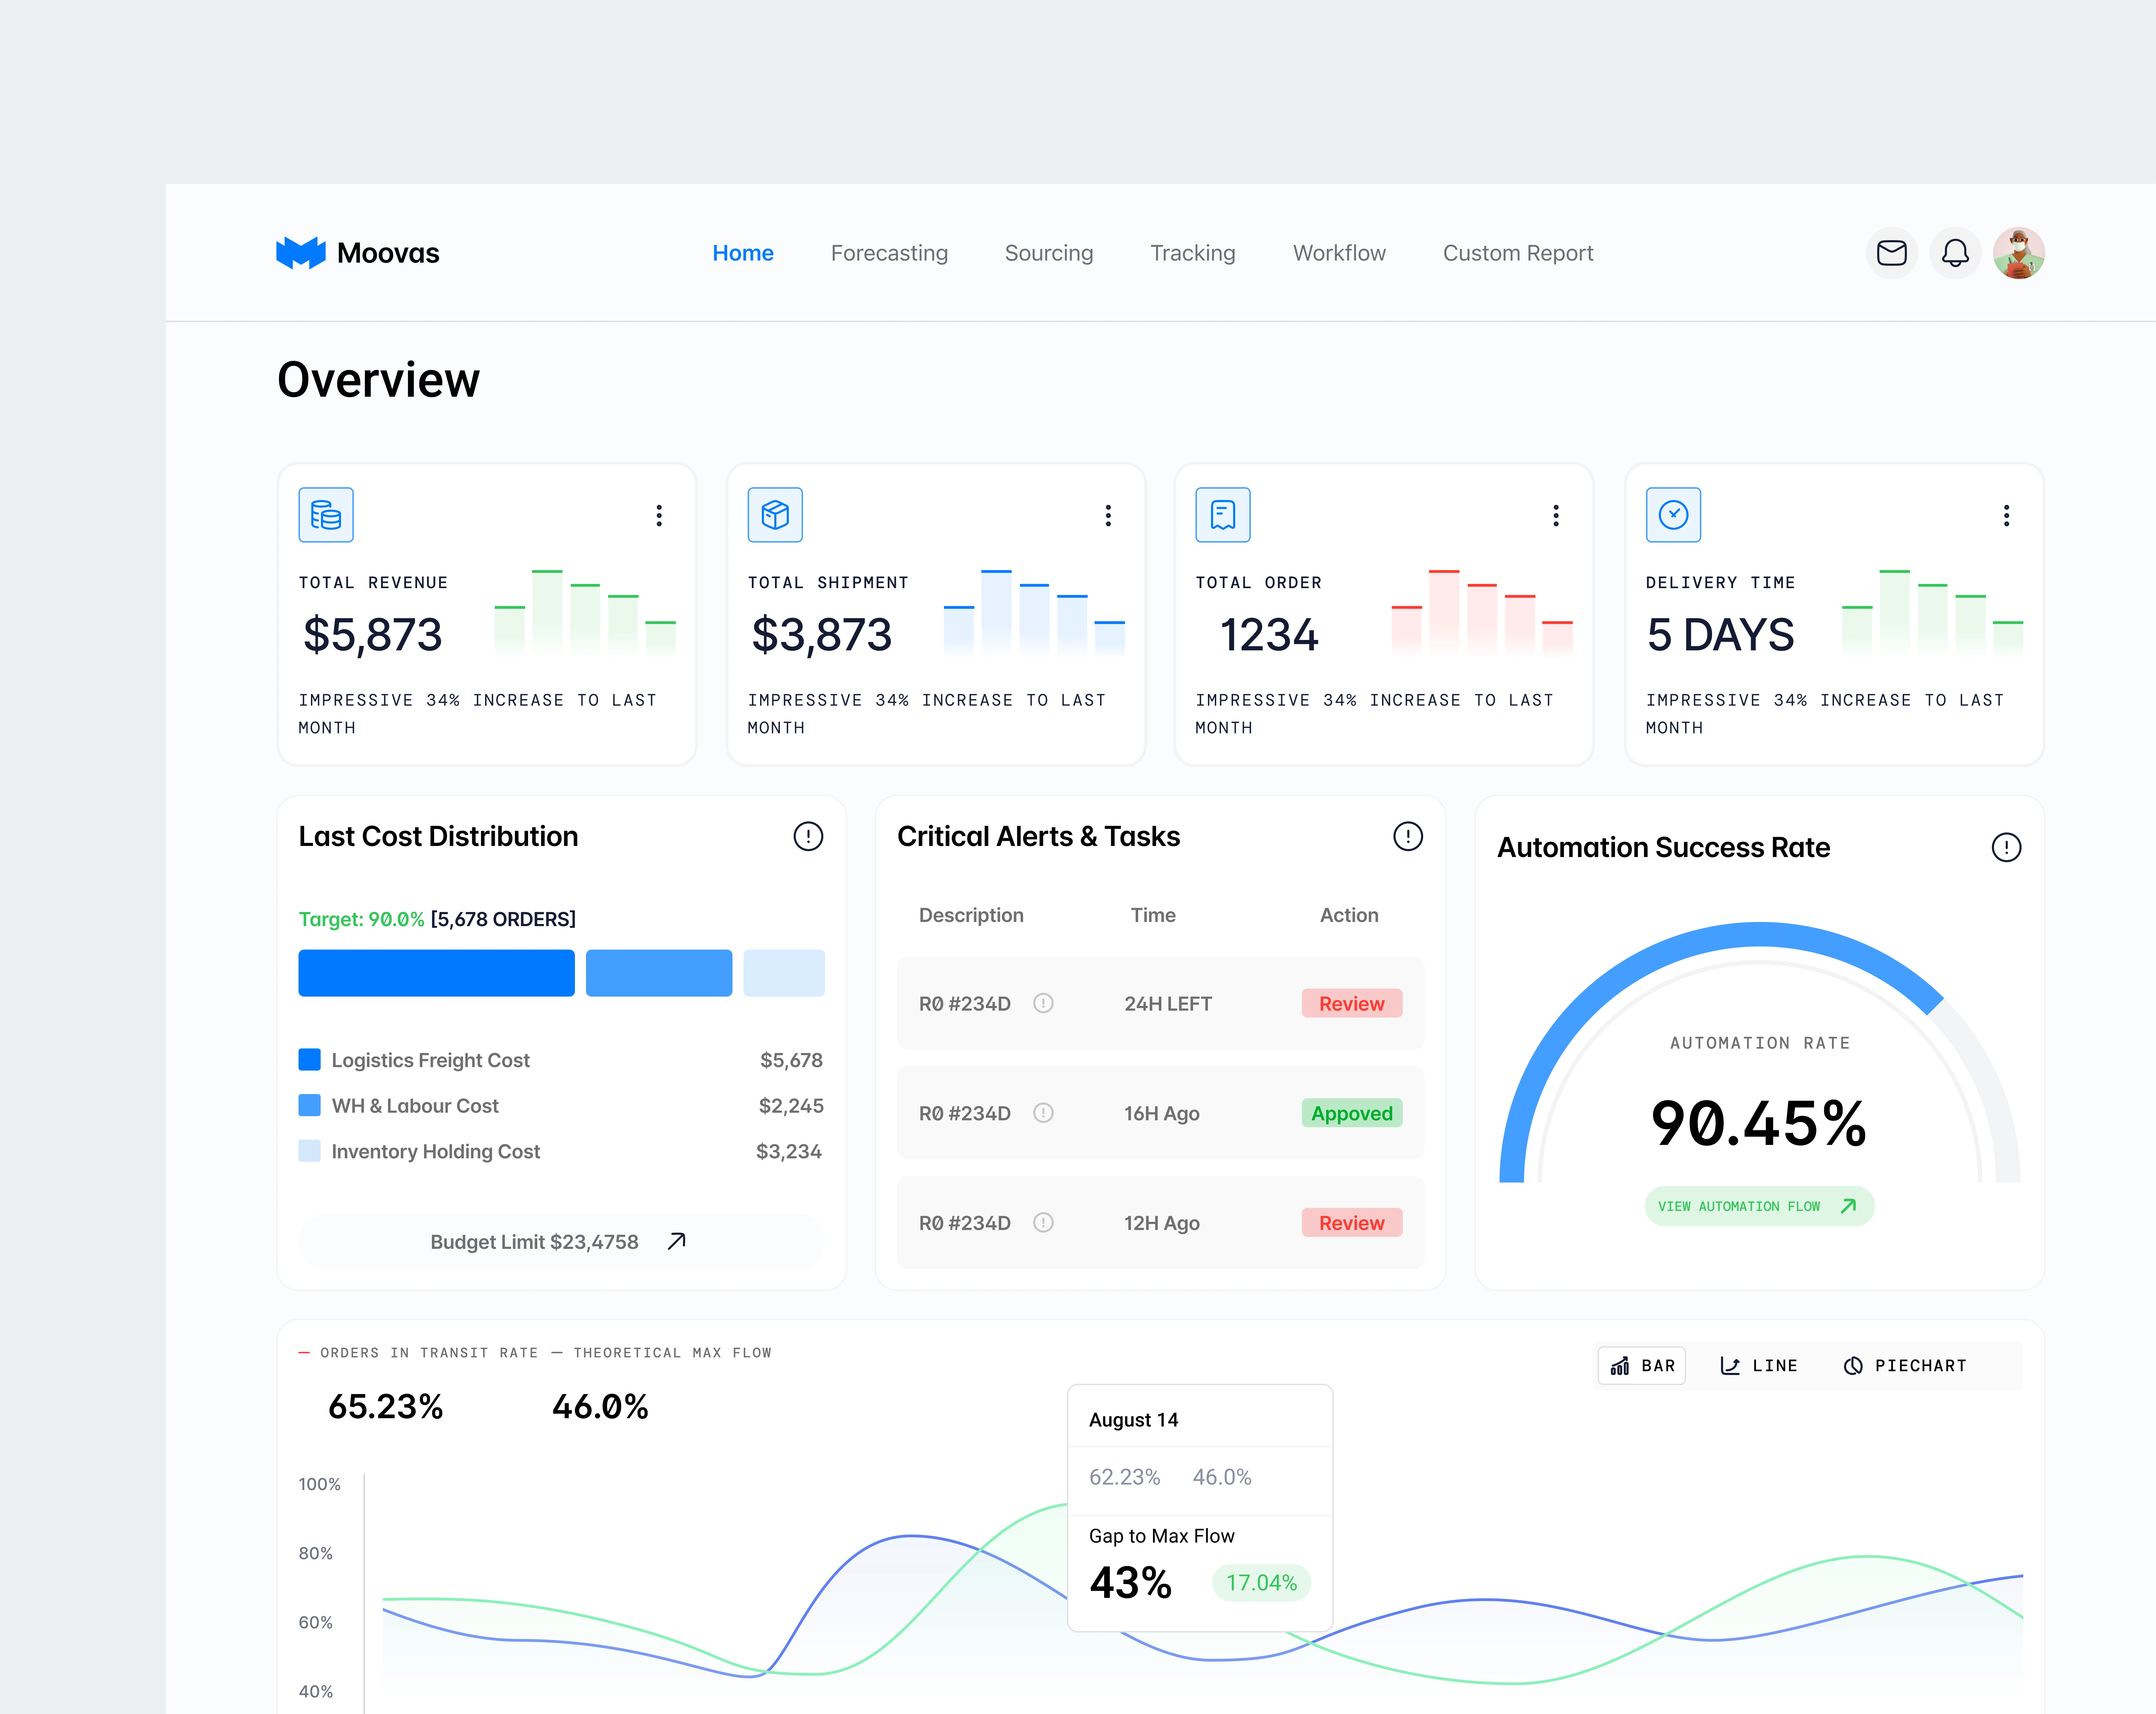
Approach
Mapped core supply chain flows: inventory, orders, fulfillment, and delays
Prioritized exception-based metrics over exhaustive reporting
Designed clear hierarchy using layout, borders, and spacing instead of heavy color
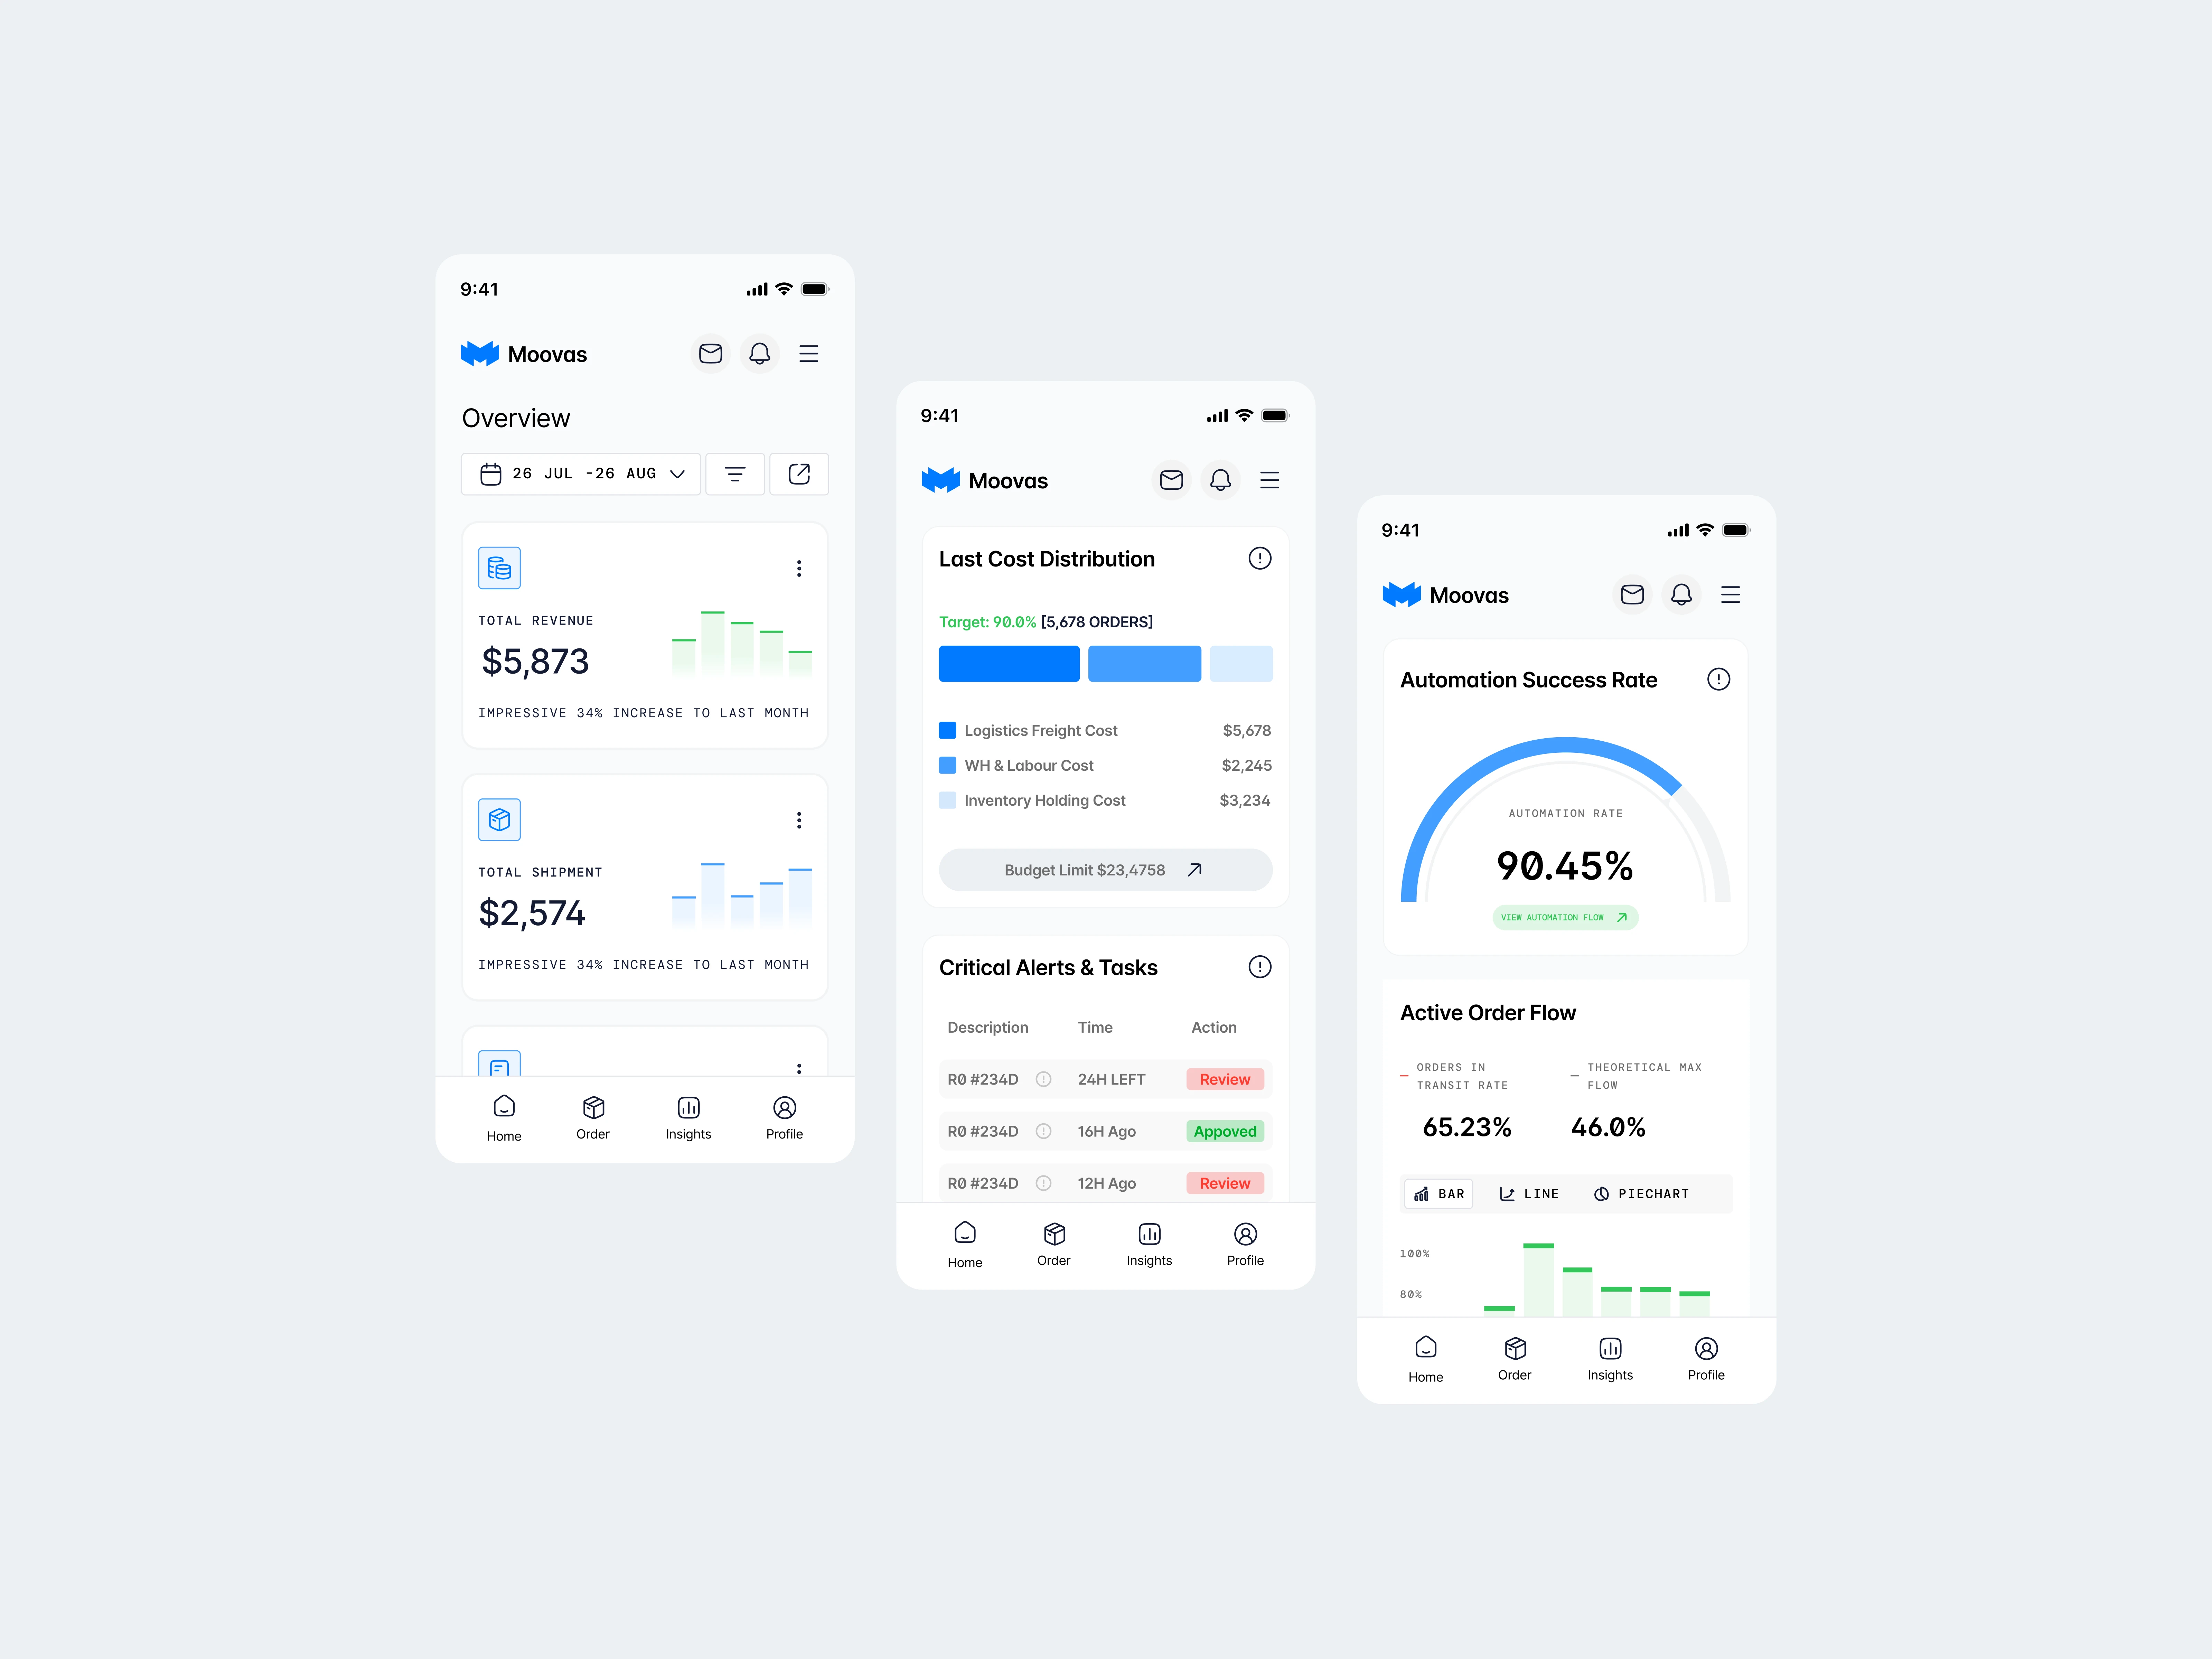
Focused on scannability for operators making time-sensitive decisions
Outcome
A clean, structured dashboard concept that surfaces critical issues early and reduces cognitive load. The design favors clarity, speed, and action over visual excess.
Key Learnings
Good dashboards highlight problems, not everything
If a metric doesn’t drive action, it doesn’t belong
Designing for operations requires thinking in systems, not screens
Like this project
Posted Jan 24, 2026
Designed a supply chain dashboard to enhance clarity and decision-making.
Likes
0
Views
1