Customer & Order Analytics Dashboard

Jay Salunke


Customer & Order Analytics Dashboard — Contra
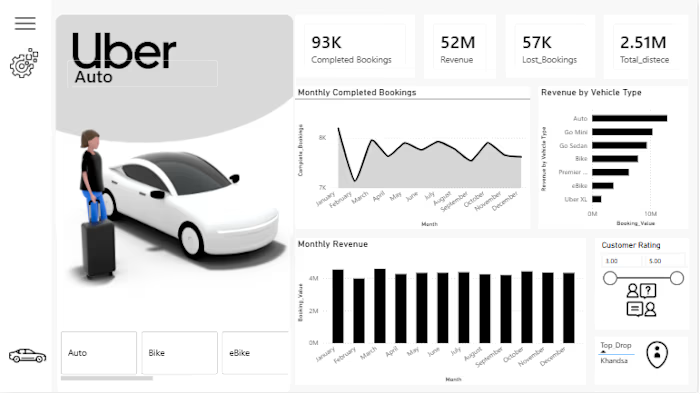
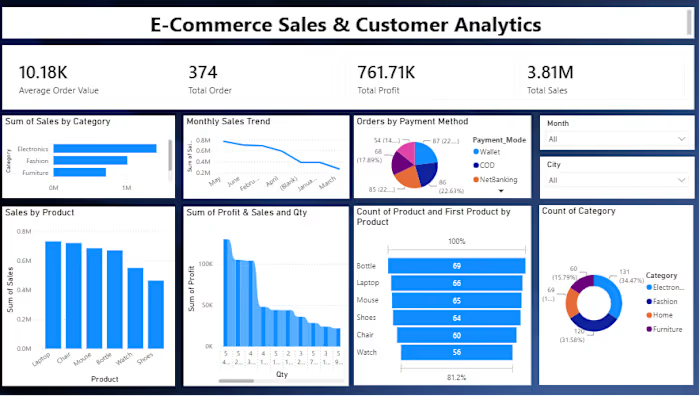
I built an interactive Customer & Order Analytics Dashboard in Power BI to analyze customer behavior, order performance, revenue trends, and key business KPIs.
The dashboard provides insights into 132M total revenue, 160K orders, 10K customers, average order value, delivery time, customer types, and repeat customers. It includes dedicated Order Analytics and Customer Analytics views with interactive filters and visualizations.
Key features:
Revenue and order performance analysis
Monthly revenue and order trends
Customer segmentation: New, Returning & Premium
Repeat customer analysis
Revenue by city
Order status analysis
Customer and order KPIs
Interactive year and status filters
Tools: Power BI, Power Query, DAX, Excel
Skills: Data Cleaning, Data Modeling, Data Analysis, KPI Reporting, Dashboard Development, Business Intelligence
Like this project
Posted Sep 12, 2026
Customer & Order Analytics Dashboard — Contra I built an interactive Customer & Order Analytics Dashboard in Power BI to analyze customer behavior, order per...