IPL 2024-25 Data Analysis Project

Chirag Suri


📊 IPL 2024–25 Data Analysis Project
A data-driven project exploring player and team performances across the 2024 and 2025 IPL seasons — combining SQL, Python, Power BI, and Generative AI to break down everything from boundaries and catches to toss impact and review success.
🛠️ Tools & Technologies Used
SQL (MySQL) – Used for slicing the main IPL dataset into filtered views for the 2024 and 2025 seasons.
Python (pandas, matplotlib, seaborn) – Exploratory Data Analysis, player performance trends, season-wise insights.
Power BI – Built a multi-page interactive dashboard with KPIs, slicers, trendlines, and maps.
Generative AI (ChatGPT) – Assisted in ideation, error handling, SQL optimisation, notebook documentation, visual design, and storytelling.
👤 Author
Chirag Suri
Passionate about data analysis, dashboards, and a cricket enthusiast.
GitHub: Link
LinkedIn: Link
Portfolio: Link
📁 Dataset
The project started with a large IPL Dataset covering all IPL seasons. Using SQL, I derived three filtered datasets specifically for the 2024 and 2025 seasons:
ipl_filtered_24_25.csv – Ball-by-ball data for the 2024–25 seasons onlyipl_player_stats_24_25.csv – Simplified version to track batter/bowler/wicket actionsipl_summary_24_25.csv – Match-level summary (toss winner, result, player of match)📎 Original Source: Kaggle
🎯 Problem Statements / Goals
This project wasn’t just about which team won more matches — it was about uncovering patterns that aren’t obvious casually, such as:
How important is the toss — does winning it actually increase win%?
Does batting position matter in scoring runs?
Which players are consistent but overlooked?
How successful are DRS reviews per team?
What’s the typical target score range teams face in chases?
Which teams are tactically better at bowling dot balls?
Do some teams dominate in catches or commit fewer fielding errors?
And lastly, in which stadium were most IPL matches played in those seasons?
🧪 Project Workflow
🔹 SQL Phase
Used Filtering methods to create 3 tables from the master IPL dataset.
Removed cancelled matches and playoff outliers where needed.
Wrote queries to calculate:
Most Runs scored in a Single Match. ['Output'](MYSQL/Exported Query Datasets/most_runs_match.csv)
Orange Cap Leaderboard. ['Output'](MYSQL/Exported Query Datasets/orange_cap_25.csv)
Purple Cap Leaderboard. ['Output'](MYSQL/Exported Query Datasets/purple_cap_25.csv)
Most catches by players. ['Output'](MYSQL/Exported Query Datasets/most_catches_25.csv)
Strike Rate of top Batters. ['Output'](MYSQL/Exported Query Datasets/strike_rate_25.csv)
Economy Rates of top Bowlers. ['Output'](MYSQL/Exported Query Datasets/economy_rate_25.csv)
Toss-win impact: whether the toss winner also won the match. ['Output'](MYSQL/Exported Query Datasets/toss_win_impact.csv)
Player of the Match Award tally. ['Output'](MYSQL/Exported Query Datasets/player_of_match.csv)
➡️ Script:
IPLsql.sql🔹 Python + Jupyter Notebook Phase
Loaded the 3 pre-filtered datasets exported from MySQL Workbench into pandas.
Validated datatypes, fixed inconsistencies (e.g., nulls in "runs_target", unknown fields).
Season-separated stats and grouped analysis (2024 vs 2025).
Built tables and visualisations for:
Team win% (excluding cancelled matches).
Catches per team (bar charts).
Dot Balls bowled by Each Team (bar charts).
Total Boundaries differentiated by number of 4s & 6s. (side-by-side bar charts).
Toss-Winner Impact on Match Result (Pie-Charts).
Comments and markdowns added to enhance storytelling.
➡️ Notebook:
IPL_Analysis.ipynb🔹 Power BI Dashboard
Built a 4-page dashboard with interactivity and visual elements:
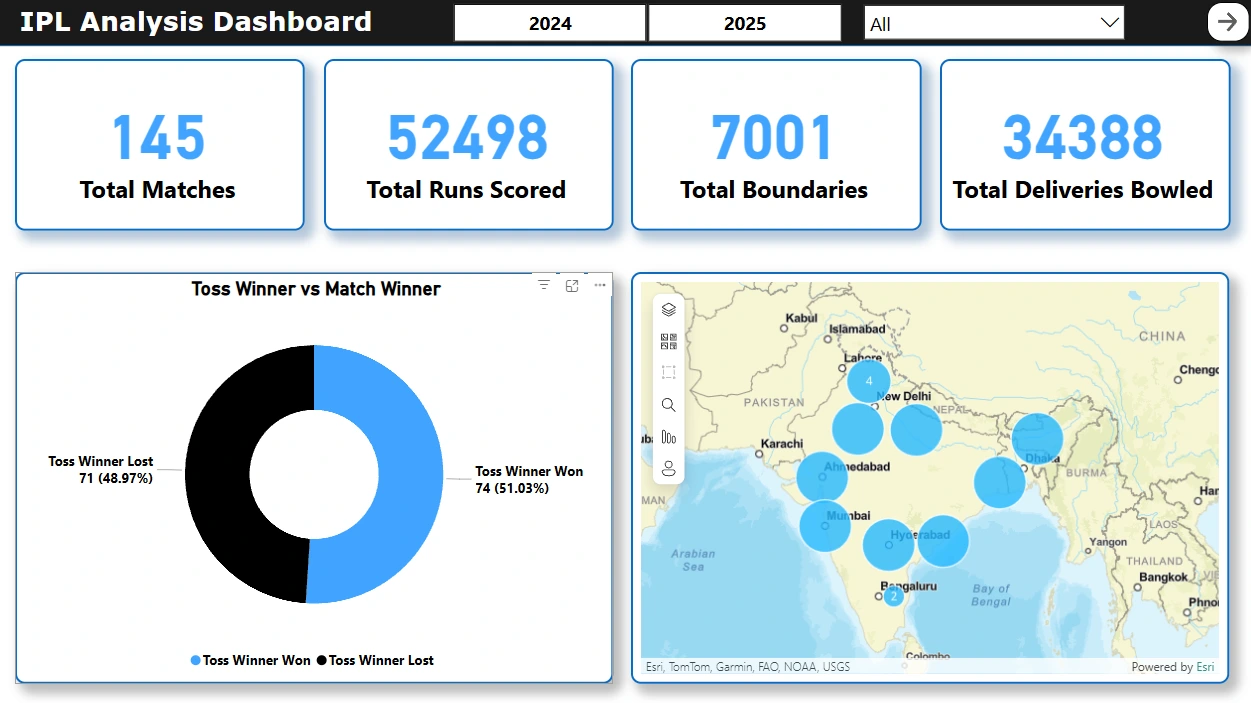
📄 Page 1: IPL Overview
Total boundaries, matches, runs, deliveries (KPI cards).
Team-wise venue map.
Toss Winner v/s Match Winner Donut Chart.
Slicers for seasons and teams.
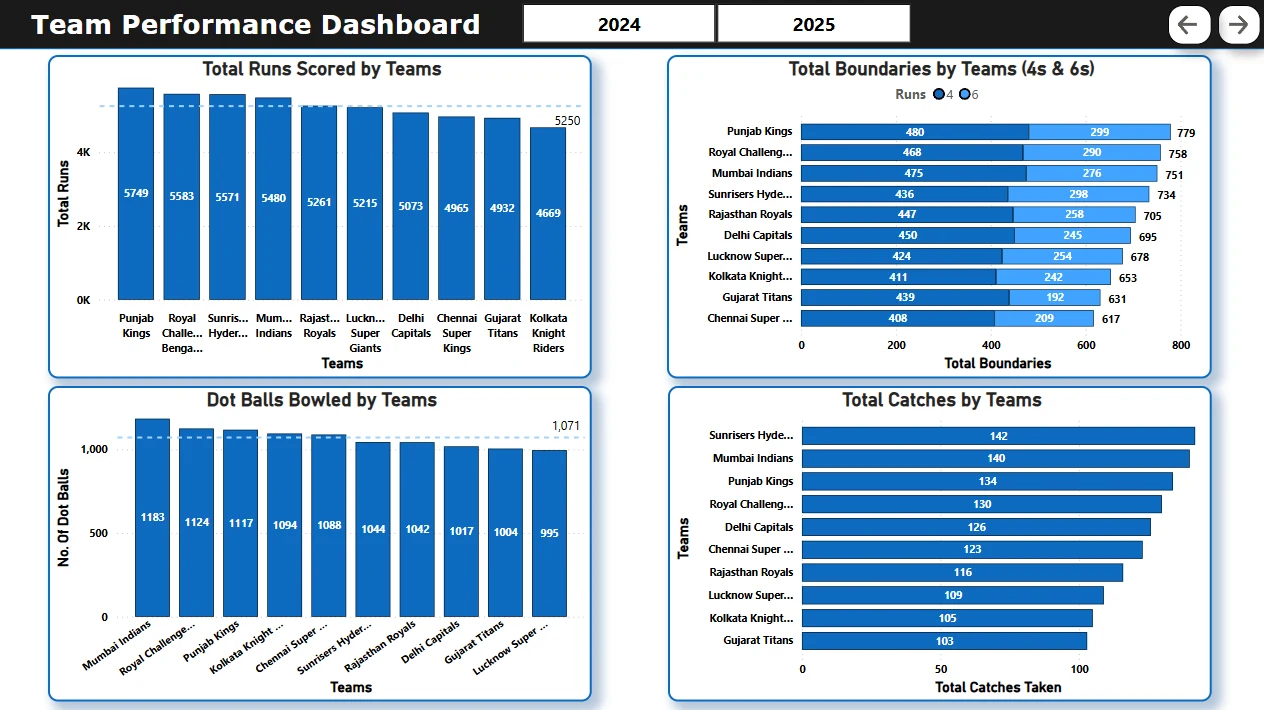
📄 Page 2: Boundary & Dot Ball Insights
Total Runs scored by Teams.
Total 4s and 6s by team.
Dot balls bowled per team (per season)
Total Catches taken by each team.
Slicers for seasons.
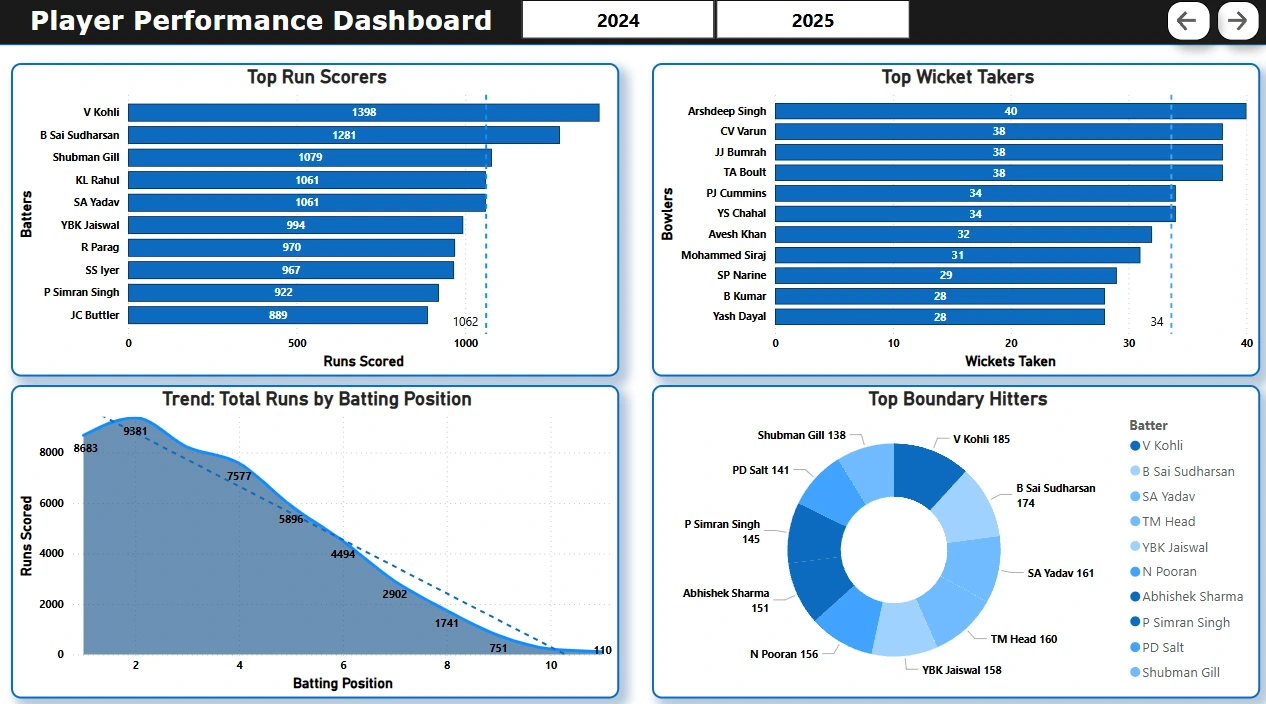
📄 Page 3: Batting Performance
Trendline: Batting position vs runs scored.
Donut: Top 10 boundary hitters
Bar Charts: Top run scorers, wicket takers, i.e. Orange and Purple Cap Leaderboard.
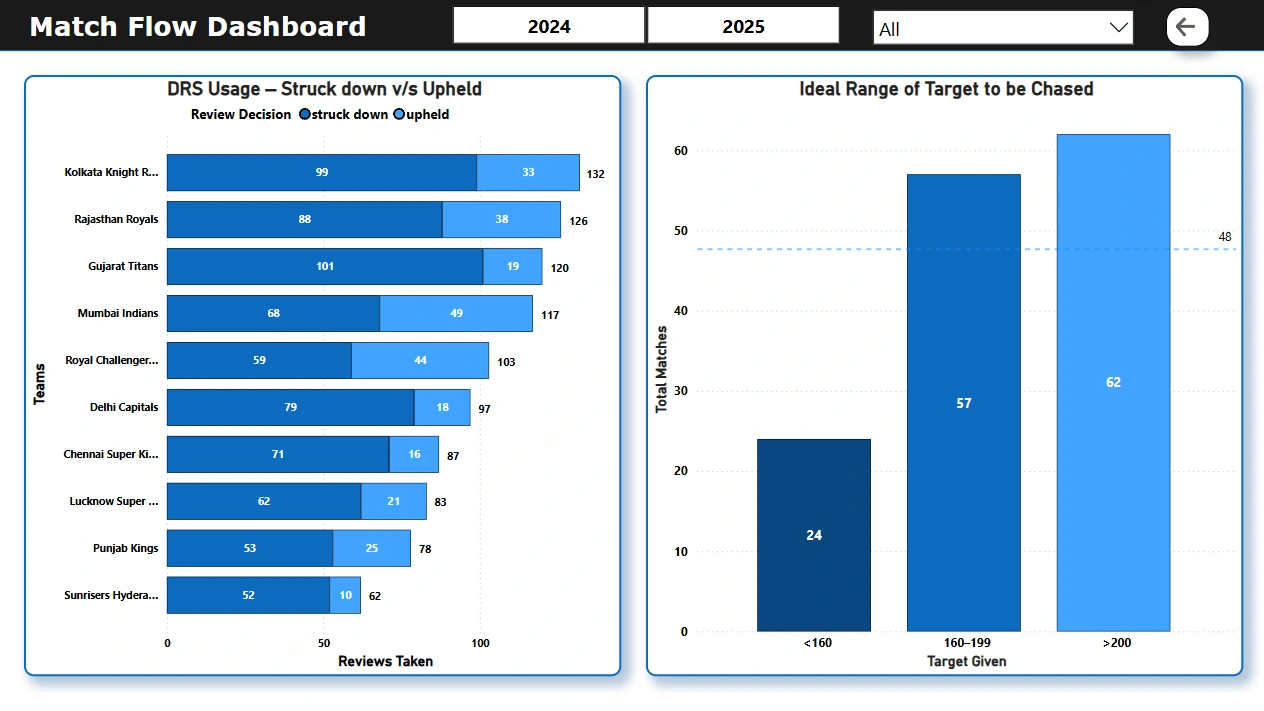
📄 Page 4: Match Behaviour
Review system summary
Target range distribution while chasing
➡️ Power BI File:
IPL_Analysis_Dashboard.pbix
🖼️ Published version: [Add Power BI service link here]📊 Key Insights
🏏 Punjab Kings led in total catches in 2025.
🎯 Most teams had to chase targets of more than 200 runs.
🥇 V. Kohli, B. Sai Sudharsan had dominant batting performances.
⚖️ Toss winner didn't always secure match wins — strategy mattered more.
🔄 Several matches had successful DRS overturns — DRS efficiency varies by team.
🎯 Dot ball count helped teams control run flow, especially in 2024.
💡 Things I Learned
This project taught me a lot — not just about cricket data, but about organising a full-stack data project from scratch:
How to set up and clean real-world data in SQL.
Structuring exploratory analysis in Python before designing visuals.
Creating clean, slicer-friendly dashboards in Power BI.
Avoiding visual clutter and focusing on what insights actually matter.
Balancing aesthetics with interactivity (tooltips, maps, dynamic filtering).
Using AI tools for efficiency and handling complex tasks easily.
📦 How to Explore
If you're checking this project out:
You can review the
.sql file to recreate the databaseUse the Jupyter Notebook to experiment or modify visualisations
View the Power BI
.pbix file directly, or try the online published versionTHANK YOU
Like this project
Posted Jul 27, 2025
Data analysis of IPL 2024-25 using SQL, Python, Power BI, and Generative AI.
Likes
1
Views
0