InsightLens - AI-Powered Data Analysis Platform
Zeeshan Siddiqui
InsightLens - AI-Powered Data Analysis Platform
A modern, full-stack data analysis application that transforms CSV data into powerful insights using Google Gemini AI. Built with React, TypeScript, and Tailwind CSS.
🚀 Features
Smart Data Upload: Drag-and-drop CSV file upload with validation
Interactive Data Preview: Advanced filtering, sorting, and search capabilities
Statistical Analysis: Comprehensive statistical insights including distributions and correlations
Dynamic Charts: Multiple chart types (Bar, Line, Pie, Scatter) with customizable options
AI-Powered Insights: Ask questions about your data using Google Gemini AI
Responsive Design: Beautiful, mobile-friendly interface
Real-time Processing: All data processing happens locally in your browser
🛠️ Tech Stack
Frontend: React 18, TypeScript, Tailwind CSS
Charts: Chart.js with React Chart.js 2
AI Integration: Google Gemini AI
Build Tool: Vite
Deployment: Netlify
📋 Prerequisites
Node.js (version 16 or higher)
npm or yarn
Google Gemini AI API key
🔧 Installation
Clone the repository
Install dependencies
Set up environment variables
Create a
.env file in the root directory:Get your Gemini API key
Start the development server
The application will be available at
http://localhost:5173🚀 Usage
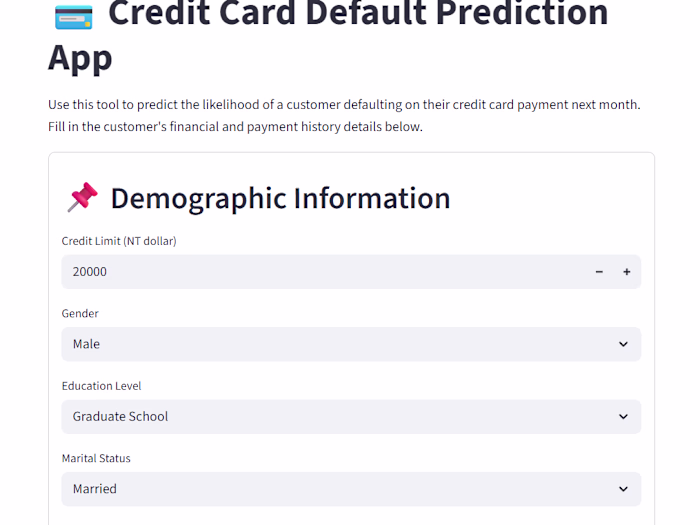
1. Upload Data
Drag and drop a CSV file or click to browse
Supported file size: up to 10MB
CSV files should have headers in the first row
2. Explore Your Data
Data Preview: View, search, filter, and sort your data
Statistics: Get comprehensive statistical analysis
Charts: Create interactive visualizations
AI Assistant: Ask questions about your data
3. Generate Insights
Use the AI Assistant to ask questions like:
"What are the main trends in this data?"
"What insights can you provide about the sales data?"
"Are there any correlations between these variables?"
📊 Supported Chart Types
Bar Charts: Compare categories and discrete data
Line Charts: Show trends and changes over time
Pie Charts: Display proportions and parts of a whole
Scatter Plots: Reveal correlations between variables
🔒 Privacy & Security
All data processing happens locally in your browser
No data is sent to external servers (except for AI queries)
CSV files are processed client-side for maximum privacy
🏗️ Build for Production
The built files will be in the
dist directory, ready for deployment.🌐 Deployment
This project is configured for easy deployment on various platforms:
Netlify (Recommended)
Connect your GitHub repository to Netlify
Set build command:
npm run buildSet publish directory:
distAdd environment variables in Netlify dashboard
Vercel
Import your GitHub repository
Vercel will auto-detect the Vite configuration
Add environment variables in Vercel dashboard
Other Platforms
The built files in
dist can be deployed to any static hosting service.🔧 Configuration
Environment Variables
Variable Description Default
VITE_GEMINI_API_KEY Google Gemini AI API key Required VITE_APP_NAME Application name InsightLens VITE_APP_VERSION Application version 1.0.0 VITE_DEV_MODE Enable development features true VITE_DEBUG_ENABLED Enable debug logging false VITE_API_TIMEOUT API request timeout (ms) 30000 VITE_MAX_FILE_SIZE Maximum file size (bytes) 10485760📁 Project Structure
🤝 Contributing
Fork the repository
Create a feature branch (
git checkout -b feature/amazing-feature)Commit your changes (
git commit -m 'Add amazing feature')Push to the branch (
git push origin feature/amazing-feature)Open a Pull Request
📝 License
This project is licensed under the MIT License - see the LICENSE file for details.
🆘 Troubleshooting
Common Issues
API Key Issues
Ensure your Gemini API key starts with
AIzaSyCheck that the API key is correctly set in your
.env fileVerify the API is enabled in your Google Cloud Console
File Upload Issues
Ensure CSV files have headers in the first row
Check file size is under 10MB
Verify the file is properly formatted CSV
Build Issues
Clear node_modules and reinstall:
rm -rf node_modules package-lock.json && npm installEnsure all environment variables are set correctly
🔗 Links
📧 Support
If you encounter any issues or have questions, please open an issue on GitHub.
Built with ❤️ using React, TypeScript, and Google Gemini AI
Like this project
Posted Jul 1, 2025
Developed InsightLens, a data analysis platform using React, TypeScript, and Google Gemini AI.
Likes
0
Views
6